Metagenomic Nanopore Sequencing of Influenza Virus Direct
from Clinical Respiratory Samples
Kuiama Lewandowski,aYifei Xu,b,eSteven T. Pullan,aSheila F. Lumley,cDona Foster,b,eNicholas Sanderson,b,e
Alison Vaughan,b,eMarcus Morgan,cNicole Bright,bJames Kavanagh,bRichard Vipond,aMiles Carroll,aAnthony C. Marriott,a Karen E. Gooch,aMonique Andersson,cKatie Jeffery,cTimothy E. A. Peto,b,c,eDerrick W. Crook,b,c,eA. Sarah Walker,b Philippa C. Matthewsc,d,e
aPublic Health England, National infection Service, Porton Down, Salisbury, United Kingdom
bNuffield Department of Medicine, University of Oxford, John Radcliffe Hospital, Headington, Oxford, United Kingdom
cDepartment of Infectious Diseases and Microbiology, Oxford University Hospitals NHS Foundation Trust, John Radcliffe Hospital, Headington, Oxford, United Kingdom dPeter Medawar Building for Pathogen Research, Nuffield Department of Medicine, University of Oxford, Oxford, United Kingdom
eOxford NIHR BRC, John Radcliffe Hospital, Headington, Oxford, United Kingdom
Kuiama Lewandowski, Yifei Xu, and Steven T. Pullan contributed equally to this work.
ABSTRACT Influenza is a major global public health threat as a result of its highly pathogenic variants, large zoonotic reservoir, and pandemic potential. Metagenomic viral sequencing offers the potential for a diagnostic test for influenza virus which also provides insights on transmission, evolution, and drug resistance and simultane-ously detects other viruses. We therefore set out to apply the Oxford Nanopore Technologies sequencing method to metagenomic sequencing of respiratory
sam-ples. We generated influenza virus reads down to a limit of detection of 102to 103
genome copies/ml in pooled samples, observing a strong relationship between the
viral titer and the proportion of influenza virus reads (P⫽4.7⫻10⫺5). Applying our
methods to clinical throat swabs, we generated influenza virus reads for 27/27
sam-ples with mid-to-high viral titers (cycle threshold [CT] values,⬍30) and 6/13 samples
with low viral titers (CT values, 30 to 40). No false-positive reads were generated
from 10 influenza virus-negative samples. Thus, Nanopore sequencing operated with 83% sensitivity (95% confidence interval [CI], 67 to 93%) and 100% specificity (95% CI, 69 to 100%) compared to the current diagnostic standard. Coverage of full-length virus was dependent on sample composition, being negatively influenced by in-creased host and bacterial reads. However, at high influenza virus titers, we were
able to reconstruct⬎99% complete sequences for all eight gene segments. We also
detected a human coronavirus coinfection in one clinical sample. While further opti-mization is required to improve sensitivity, this approach shows promise for the Nanopore platform to be used in the diagnosis and genetic analysis of influenza vi-rus and other respiratory vivi-ruses.
KEYWORDS influenza, Nanopore, metagenomic, diagnosis, epidemiology,
sequencing, DNA sequencing, diagnostics, metagenomics, molecular epidemiology
I
nfluenza A virus is an RNA orthomyxovirus of approximately 13 kb in length, with aneight-segment genome. It is typically classified on the basis of hemagglutinin (HA) and neuraminidase (NA), of which there are 16 and 9 main variants, respectively (1). Genetic reassortment underpins the potential for transmission between different host species (2) and for the evolution of highly pathogenic variants (3–6), recognized in the WHO list of “ten threats to global health” (7). Seasonal influenza causes an estimated 650,000 deaths globally each year, and the H3N2 variant alone kills 35,000 people each year in the United States (1, 8). Certain groups are particularly at risk, including older
CitationLewandowski K, Xu Y, Pullan ST, Lumley SF, Foster D, Sanderson N, Vaughan A, Morgan M, Bright N, Kavanagh J, Vipond R, Carroll M, Marriott AC, Gooch KE, Andersson M, Jeffery K, Peto TEA, Crook DW, Walker AS, Matthews PC. 2020. Metagenomic Nanopore sequencing of influenza virus direct from clinical respiratory samples. J Clin Microbiol 58:e00963-19.https://doi.org/10.1128/JCM .00963-19.
EditorAlexander Mellmann, University Hospital Münster
Copyright© 2019 Lewandowski et al. This is an open-access article distributed under the terms of theCreative Commons Attribution 4.0 International license.
Address correspondence to Steven T. Pullan, steven.pullan@phe.gov.uk.
Received18 June 2019
Returned for modification17 July 2019
Accepted21 October 2019
Accepted manuscript posted online30 October 2019
Published
VIROLOGY
crossm
23 December 2019
on May 17, 2020 by guest
http://jcm.asm.org/
adults, infants, young children, pregnant women, those with underlying lung disease, and the immunocompromised (9). The burden of disease disproportionately affects low-/middle-income settings (10). Influenza virus diagnostics and surveillance are fundamental to identify the emergence of novel strains, to improve the prediction of potential epidemics and pandemics (4, 8), and to inform vaccine strategy (11). Diag-nostic data facilitate real-time surveillance, can underpin infection control interventions (12, 13), and can inform the prescription of neuraminidase inhibitors (NAI) (9).
Currently, most clinical diagnostic tests for influenza virus depend on detecting viral antigen or on PCR amplification of viral nucleic acid derived from respiratory samples (14). These two approaches offer trade-offs in benefits, as follows: antigen tests (including point-of-care tests [POCT]) are typically rapid but have low sensitivity (15– 17), while PCR is more time-consuming but more sensitive (9). Irrespective of the test used, most clinical diagnostic facilities report a nonquantitative (binary) diagnostic result, and the data routinely generated for influenza diagnosis have limited capacity to inform insights into epidemiological linkage, vaccine efficacy, or antiviral susceptibility. On these grounds, there is an aspiration to generate new diagnostic tests that combine speed (incorporating the potential for POCT [18, 19]), sensitivity, detection of coinfec-tion (20, 21), and generacoinfec-tion of quantitative or semiquantitative data that can be used to identify drug resistance and reconstruct phylogeny to inform surveillance, public health strategy, and vaccine design.
The application of Oxford Nanopore Technologies (ONT) sequencing to generate full-length influenza virus sequences from clinical respiratory samples can address these challenges. ONT offers a “third-generation,” portable, real-time approach to generating long-read single-molecule sequence data, with demonstrated success across a range of viruses (20, 22–24). To date, Nanopore sequencing of influenza virus
has been reported using high-titer virus from an in vitro culture system, producing
full-length genome sequences through direct RNA sequencing (25), or using targeted enrichment by either hybridization of cDNA (26) or influenza virus-specific PCR ampli-fication (27).
We therefore aimed to optimize a metagenomic protocol for detecting influenza viruses directly from clinical samples using Nanopore sequencing. We determine its sensitivity compared to that of existing diagnostic methods and its accuracy compared to short-read (Illumina) sequencing, using clinical samples from hospital patients during an influenza season and samples from a controlled laboratory infection in ferrets. Further optimization is required before the Nanopore method can be rolled out as a diagnostic test, but we highlight the potential impact of this technology in advancing molecular diagnostics for respiratory pathogens.
MATERIALS AND METHODS
Study cohort and sample collection.We collected respiratory samples from the clinical microbi-ology laboratory at Oxford University Hospitals NHS Foundation Trust, a large tertiary referral teaching hospital in Southeast England. We worked with anonymized residual material from throat and nose swabs generated as a result of routine clinical investigations between January and May 2018. Samples were collected using a sterile polyester swab inoculated into 1 to 3 ml of sterile viral transport medium (VTM), using a standard approach described on the CDC website (28). During the study, respiratory samples submitted to the clinical diagnostic laboratory were routinely tested by a PCR-based test using the GeneXpert assay (Cepheid) to detect influenza A and B viruses and respiratory syncytial virus (RSV). The workflow is shown in Fig. 1. Samples from patients in designated high-risk locations (hematology, oncology, and critical care) were tested using the BioFire FilmArray (bioMérieux) to detect an expanded panel of bacterial and viral pathogens. Quantitative data (cycle threshold [CT]) were generated by the
GeneXpert assay, and we used the influenza virusCTvalue to estimate the viral titers in clinical samples.
Using the GeneXpert assay, up to 40 PCR cycles are performed before a sample is called negative (i.e., positives have aCTvalue of⬍40). Quantification was not available for the BioFire results.
For methodological assessment, we focused on four categories of samples, as follows: positive pool, negative pools, individual positive samples, and individual negative samples. For the positive pool, we pooled 19 throat swab samples that had tested positive for influenza A virus in the clinical diagnostic laboratory to provide a large enough sample to assess reproducibility (Fig. 1B). For the negative pools, we generated three pools of throat swab samples that had tested negative for influenza virus (consisting of 24, 38, and 38 individual samples) (Fig. 1B). For the individual positive samples, we included 40 individual samples (35 throat swabs and 5 nasal swabs) that had tested positive for influenza A or B virus,
on May 17, 2020 by guest
http://jcm.asm.org/
selected to represent the widest range of GeneXpert assayCTvalues (13.5 to 39.3; valid test result range,
12 to 40). For the individual negative samples, we selected 10 individual throat swab samples that were influenza virus negative.
Quantification of viral RNA in samples.We quantified viral titers in Hazara virus stocks and pooled influenza A virus-positive throat swabs by quantitative reverse transcription-PCR (qRT-PCR), using previously described assays and standards (29, 30).
Optimization of methods.Prior to establishing the protocol detailed in full below, we assessed the impact of two possible optimization steps, centrifugation versus filtration and reduced time for cDNA synthesis. For centrifugation versus filtration, we investigated two approaches to deplete human/ bacterial nucleic acid from our samples, i.e., filtration of the raw sample via a 0.4-m filter (Sartorius) before further processing versus using a hard spin (16,000⫻ gfor 2 min). cDNA libraries for this comparison were produced as described previously (20). For the reduced time for cDNA synthesis, to assess the possibility of time saving in the cDNA synthesis steps, we compared performance of the previously described protocol (20) to that of a modified version with two alterations, first using SuperScript IV (Thermo Fisher) in place of SuperScript III (Thermo Fisher) for reverse transcription, with the incubation time reduced from 60 min to 10 min at 42°C, and second, reducing the cDNA amplifi-cation PCR extension cycling time from 5 min to 2 min.
Positive control.Prior to nucleic acid extraction, each sample was spiked with Hazara virus virions to a final concentration of 104genome copies per ml as a positive internal control. This is an enveloped
negative-stranded RNA virus (genusOrthonairovirus, orderBunyavirales) with a trisegmented genome of 11,980, 4,575, and 1,677 nucleotides in length (GenBank accession numbersKP406723toKP406725). It is nonpathogenic in humans and would therefore not be anticipated to arise in any of our clinical samples. Cultured virions from an SW13 cell line were provided by the National Collection of Pathogenic Viruses (NCPV; catalog no. 0408084v).
Nucleic acid extraction.Samples were centrifuged at 16,000⫻gfor 2 min. The supernatant was eluted without disturbing the pelleted material and was used in nucleic acid extraction. Total nucleic acid was extracted from 100l of supernatant using the QIAamp viral RNA kit (Qiagen) eluting in 50l of H2O,
followed by a DNase treatment with Turbo DNase (Thermo Fisher Scientific) at 37°C for 30 min. RNA was purified and concentrated to 6l using the RNA Clean & Concentrator-5 kit (Zymo Research), following the manufacturer’s instructions. Randomly amplified cDNA was prepared for each sample using a sequence-independent single-primer amplification (SISPA) approach, adapted from our previously de-scribed workflow (20), based on the round A/B methodology (23). For reverse transcription, 4l of RNA and 1l of primer A (5=-GTTTCCCACTGGAGGATA-N9-3=, 40 pmol/l) (23) were mixed and incubated for 5 min at 65°C and then cooled to room temperature. First-strand synthesis was performed by the addition of 2l SuperScript IV first-strand buffer, 1l of 12.5 mM dinucleoside triphosphates (dNTPs), 0.5l of 0.1 M dithiothreitol (DTT), 1l H2O, and 0.5l SuperScript IV (Thermo Fisher) before incubation
for 10 min at 42°C. Second-strand synthesis was performed by the addition of 1l Sequenase buffer, FIG 1Schematic to show processing protocol through clinical and research pipelines for influenza diagnosis. (A) Clinical sample collection (orange), clinical diagnostic testing (yellow), sample processing and sequencing using Oxford Nanopore Technologies (blue), and processing of sequence data (purple). (B) Outline of pooled influenza virus-positive samples into an influenza virus-negative background to generate various titers of influenza virus (from 0 to 106genome copies/ml), undertaken in triplicate, and spiked with a standard titer of Hazara virus control
at 104genome copies/ml. FluA, influenza A virus.
Nanopore Sequencing of Influenza Virus Journal of Clinical Microbiology
on May 17, 2020 by guest
http://jcm.asm.org/
[image:3.585.43.400.71.302.2]3.85l H2O, and 0.15l Sequenase (Affymetrix) prior to incubation for 8 min at 37°C, followed by the
addition of 0.45l Sequenase dilution buffer and 0.15l Sequenase and a further incubation at 37°C for 8 min. Amplification of cDNA was performed in triplicate using 5l of the reaction mixture as input to a 50-l AccuTaq LA (Sigma) reaction mixture, according to the manufacturer’s instructions, using 1l primer B (5=-GTTTCCCACTGGAGGATA-3=) (23), with PCR cycling conditions of 98°C for 30 s, 30 cycles of 94°C for 15 s, 50°C for 20 s, and 68°C for 2 min, followed by 68°C for 10 min. Amplified cDNA was pooled from the triplicate reaction mixtures, purified using a 1:1 ratio of AMPure XP beads (Beckman Coulter, Brea, CA), and quantified using a Qubit high-sensitivity double-stranded DNA (dsDNA) kit (Thermo Fisher), both according to the manufacturers’ instructions.
Nanopore library preparation and sequencing.Multiplex sequencing libraries were prepared using 250 ng of cDNA from up to 12 samples as input to the SQK-LSK108 or SQK-LSK109 kit and barcoded individually using the EXP-NBD103 Native barcodes (Oxford Nanopore Technologies) and a modified One-pot protocol (https://www.protocols.io/view/one-pot-ligation-protocol-for-oxford-nanopore-libr -k9acz2e). Libraries were sequenced on FLO-MIN106 flow cells on the MinION Mk1b or GridION device (Oxford Nanopore Technologies), with sequencing proceeding for 48 h. Samples were batched according to the GeneXpertCTvalue (see File S1 in the supplemental material).
Illumina methods.Nextera XT V2 kit (Illumina) sequencing libraries were prepared using 1.5 ng of amplified cDNA, as per the manufacturer’s instructions, and sequenced on a 2⫻150-bp paired-end Illumina MiSeq run by the Genomics Services Development Unit of Public Health England.
Bioinformatic analysis.Nanopore reads were base called using Guppy (Oxford Nanopore Technol-ogies, Oxford, UK). Output base called fastq files were demultiplexed using Porechop v0.2.3 (https:// github.com/rrwick/Porechop). The reads were first taxonomically classified against the RefSeq database using Centrifuge v1.0.3 (31). The reads were then mapped against the reference sequence selected from the Centrifuge report using Minimap2 v2.9 (31, 32). A draft consensus sequence was generated by using a majority voting approach to determine the nucleotide at each position. The resulting draft consensus sequences were subjected to a BLAST search against an influenza virus sequence database that included
⬎2,000 H1N1 and H3N2 seasonal influenza virus sequences between 2018 and 2019 and were down-loaded from the Influenza Research Database (33). The reads were again mapped against the reference sequence using Minimap2 v2.9, and the number of mapped reads was calculated using SAMtools v1.5 (34) and Pysam (https://github.com/pysam-developers/pysam). The subtype of the influenza A virus derived from each clinical sample was determined by the subtypes of the HA and NA reference sequences. A consensus sequence was built using Nanopolish v0.11.0 (35, 36) and the margin_cons.py script (37) (https://github.com/zibraproject/zika-pipeline). For the Illumina data, reads were quality trimmed to a minimum score of Q30 across the read with Trimmomatic (38). BWA-MEM v0.7.15 (39) was used to align the reads to reference genomes using MEM defaults. SAMtools v1.4 was used to compute the percent reads mapped and coverage depth (34). Mapping consensuses for Illumina sequencing were generated using QuasiBam (40). Maximum likelihood phylogeny was generated for the HA gene segment using RAxML v8.2.10 (41), in which a general time-reversible model of nucleotide substitution and a gamma-distributed rate variation among sites were applied. Sequence alignments were performed by using MUSCLE v3.8 (42).
Ferret study.We applied our sequencing approach to residual samples collected in a previous time course experiment undertaken in a controlled laboratory environment (43). We tested ferret nasal saline wash samples from three independent animals over an 8-day time course, from 3 days prior to first exposure with influenza H1N1pdm09 virus and at days 1, 2, 3, and 5 postinfection. Sampling and plaque assays of the viral titer were described previously (43).
Ethics approval.The study of anonymized discarded clinical samples was approved by the London-Queen Square Research Ethics Committee (17/LO/1420). Ferret samples were residual samples from an existing study (43) for which the project license was reviewed by the local Animal Welfare and Ethics Review Board of Public Health England (Porton) and subsequently granted by the Home Office.
Data availability.Following the removal of human reads, our sequence data have been uploaded to the European Bioinformatics Institute (https://www.ebi.ac.uk/) under BioProject numberPRJEB32861.
RESULTS
Method optimization to increase the proportion of viral reads derived from throat swabs. Our method protocol is shown in Fig. 1A. We first sequenced five influenza A virus-positive and five influenza virus-negative throat swabs, each spiked
with Hazara virus control at 104 genome copies/ml. Using a sequence-independent
single-primer amplification (SISPA) approach (20), followed by Nanopore sequencing, we produced metagenomic data dominated by reads that were bacterial in origin, with
extremely few viral reads detected. Passing the sample through a 0.4-m filter prior to
nucleic acid extraction increased the detection of viral reads by several orders of magnitude (Fig. S1). Filtration is relatively expensive, so we also assessed the alternative approach of adding a rapid-centrifugation step to pellet bacterial and human cells, followed by nucleic acid extraction from the supernatant. We used a pooled set of
influenza A virus-positive samples (concentration, 106genome copies/ml) to provide a
large enough sample to assess reproducibility, with the Hazara virus control spiked in
at 104genome copies/ml. Enrichment for influenza virus and Hazara virus was similar
on May 17, 2020 by guest
http://jcm.asm.org/
for filtration versus centrifugation, based on read mapping to the viral genome (Fig. S2). As centrifugation is simpler and less expensive, we selected this approach for all further testing.
Method optimization to reduce time for cDNA synthesis.Synthesis of tagged randomly primed cDNA and its subsequent amplification via SISPA (20) required lengthy reverse transcription and PCR steps (1 h and 3 h 45 min), respectively. Optimiz-ing these stages upgraded the reverse transcriptase from SuperScript III to SuperScript IV (Thermo Fisher), reduced the incubation time to 10 min (processing time reduction, 50 min), and reduced the PCR extension time within each cycle from 5 min to 2 min (1 h 30 min processing time reduction). Comparing this final method with our original protocol, using triplicate extractions from the pooled set of influenza A virus-positive samples demonstrated no significant loss in performance in the more rapid protocol (Fig. S3), and we adopted this approach as our routine protocol, giving a wet-lab
processing time of⬃8 h.
Consistent retrieval of Hazara virus by Nanopore sequencing.Starting with an
influenza A virus-positive sample pool (106 genome copies/ml), we made three
volu-metric dilution series using three independent influenza virus-negative pools (Fig. 1B). The total quantity of cDNA after preparation for sequencing was consistently higher in all samples using negative pool 3 as the diluent (Fig. 2A), indicating the presence of a higher concentration of nonviral RNA within pool 3. This is likely due to host cell lysis or higher bacterial presence and demonstrates the variable nature of throat swab samples.
FIG 2Characteristics of three pools of influenza virus-negative throat swabs and Nanopore sequence results following spiking with influenza A virus. (A) Total concentration of cDNA produced per pooled sample following amplification by the SISPA reaction, grouped by dilution series. The 106 genome
copies/ml sample in each pool is the original, undiluted material, represented by the black bars. Samples diluted to influenza virus titers of 104, 103, and 102contain more cDNA due to higher background
material (bacterial/human) present in the diluent. Dilution series 1 and 2 contain comparable amounts of background material; dilution series 3 contains substantially more background. (B) Viral reads generated by Nanopore sequencing of samples with different titers of influenza A virus and a consistent titer of Hazara virus (104genome copies/ml). Graphs show reads per million of total reads mapping to
influenza A or Hazara virus genomes, across the three individual dilution series. Note the logarithmic scale on theyaxis.
Nanopore Sequencing of Influenza Virus Journal of Clinical Microbiology
on May 17, 2020 by guest
http://jcm.asm.org/
[image:5.585.67.348.73.351.2]We consistently retrieved Hazara virus reads from all three dilution series by Nanopore sequencing, independently of influenza virus titer in the sample (Fig. 2B). Sequencing from dilution series 1 and 2 gave a consistent proportion of total reads mapping to the Hazara virus genome, across dilutions and between the first two pools,
with mean⫾standard deviation values per pool of 1.4⫻103⫾660 reads per million
(RPM) of total reads and 1.2⫻103⫾350 RPM, respectively. The pool 3 dilution series
generated 260⫾340 RPM Hazara virus reads across samples and showed a decreasing
trend associated with increased dilution factor as increasingly more nonviral RNA was introduced from this high-background pool.
Limit of influenza virus detection by Nanopore sequencing from pooled sam-ples. Nanopore sequencing of the triplicate SISPA preparations of the influenza A
virus-positive pool produced mean⫾standard deviation of 5.3⫻104⫾3.6⫻104RPM
mapping to the influenza A virus genome (Fig. 2B). Across the dilution series, the
proportion of influenza virus reads was strongly associated with influenza virus titer (P
value ⫽ 4.7⫻10⫺5) but was also influenced by which negative pool was used for
dilution, consistent with the pattern observed for the Hazara virus control. Sequencing the negative controls (pools with no influenza virus spike) generated no reads mapping
to influenza virus. At influenza virus titers of⬍103copies/ml, influenza virus reads were
inconsistently detected across the samples (Fig. 2B), suggesting that the limit of
detection is between 102and 103influenza virus copies/ml.
Retrieval and reconstruction of complete influenza virus genomes from pooled/spiked samples.For the Hazara virus control (104genome copies/ml spike),
genome coverage was 81.4 to 99.4% (at 1⫻depth) for pools 1 and 2. Coverage in the
high-background pool 3 was more varied (21.5 to 96.5%; Fig. 3A). Influenza A virus
genome coverage at 106copies/ml wasⱖ99.3% for each segment in all samples (Fig.
3A). At 104genome copies/ml of influenza virus, a mean 1⫻coverage per segment was
90.3% for pools 1 and 2 but was substantially reduced in the high-background pool 3
to 5.7% (Fig. 3A). At influenza virus titers of⬍104copies/ml, coverage was highly varied
across genome segments. However, when present at 103 copies/ml, 2/3 pools had
sufficient data for correct subtyping as H3N2 (Table 1).
Influenza virus detection from individual clinical samples.Having demonstrated our ability to retrieve influenza virus sequences from pooled influenza virus-positive material diluted with negative samples, we next applied our methods to individual anonymized clinical samples, with 40 samples testing influenza virus positive and 10 samples testing influenza virus negative in the clinical diagnostic laboratory. Data yield
varied between flow cells (range, 2.5⫻106 to 13.2⫻106reads from up to 12
multi-plexed samples). Within flow cells, barcode performance was inconsistent when using a stringent, dual-barcode, demultiplexing method (21). From each clinical sample, the
range of total reads generated was 1.0⫻105to 2.4⫻106 (median, 3.8⫻105reads)
(Table S1).
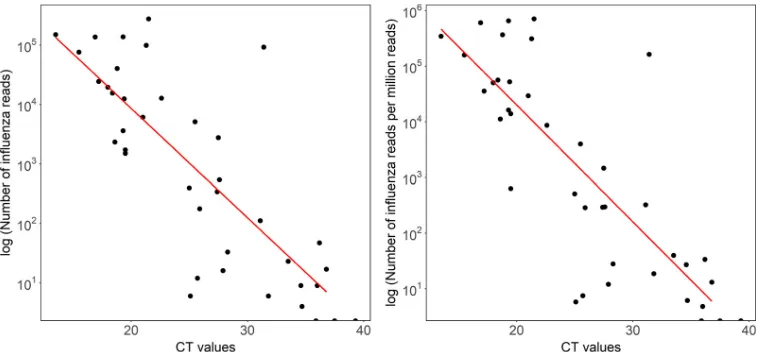
Reads mapping to either the influenza A or B virus genome were present in all 27
samples with aCTof ⬍30 (range, 6 to 274,955 reads). At aCTof⬎30, 6/13 samples
generated influenza virus reads (range, 6 to 92,057 reads) (difference between
sensi-tivity at a CTthreshold of 30,P⬍0.0001; Fig. 4). The highestCTvalue at which any
influenza virus reads were detected was 36.8 (sample 37; 17 reads of influenza A virus). No reads classified as influenza virus were obtained from sequencing the 10 GeneXpert assay-negative samples (Table S1). Based on this small data set, sensitivity is 83% and specificity is 100% (95% CI, 67 to 93% and 69 to 100%, respectively). There was a strong
correlation betweenCTvalue and both the reads per sample classified as influenza virus
(R2⫽0.60) and the number of influenza virus reads per million reads (R2⫽0.62) (Fig.
4). The consensus genome sequences generated (at 10⫻ minimum depth) covered
over 90% of the influenza virus genome for 17 samples, with another two generating
over 80% coverage. The highestCTvalue of a sample from which⬎90% of an influenza
virus genome sequence was generated was 27.5 (Fig. S4).
on May 17, 2020 by guest
http://jcm.asm.org/
FIG 3Coverage of influenza virus and Hazara virus genome segments achieved by Nanopore sequencing from pooled samples (A) Data from three dilution series of pooled influenza virus-positive samples, diluted with three separate negative-sample pools to generate different titers of influenza virus. Each individual dilution was spiked with Hazara virus at 104genome copies/ml. The proportion of genome covered at 1⫻depth is shown for each of the eight
influenza virus genome segments (encoding PB2 [polymerase subunit 2], PB1 [polymerase subunit 1], PA [polymerase acidic protein], HA [hemagglutinin], NP [nucleocapsid protein], NA [neuraminidase], M [matrix protein], and NS [nonstructural protein]) across the three dilution series. For simplicity, the coverage of the Hazara virus genome is plotted as the total of all three genome segments. (B) Representative coverage plots of influenza A virus genome segments from the dilution series 1 sample at 104influenza virus copies per ml.
Nanopore Sequencing of Influenza Virus Journal of Clinical Microbiology
on May 17, 2020 by guest
http://jcm.asm.org/
[image:7.585.45.540.66.626.2]Detection of Hazara virus internal control.Detection of the control virus (Hazara
virus at 104genome copies/ml) was highly varied, demonstrating that levels of
back-ground nontarget RNA are a major source of intersample variation. The number of
Hazara virus reads per sample ranged from 0 to 13.5⫻103(0 to 3.5⫻104RPM), with
a median of 70 reads (160 RPM) and mean of 706 reads (1.7⫻103RPM) (Table S1). Four
(8%) of 50 samples generated no detectable Hazara virus reads, two with high numbers
of influenza virus reads (for sample 1,CTof 13.5 and 1.5⫻105influenza B virus reads,
and for sample 6,CTof 18.4 and 1.5⫻104influenza A virus reads) acting to dilute the
control signal. The other two samples contained no detectable influenza virus reads (for
sample 34,CTof 35.9, and for sample 46, influenza virus negative). The lack of control
detection therefore indicates a loss of assay sensitivity due to high levels of background nucleic acid present in some samples.
Comparison of Nanopore and Illumina sequencing.We selected a subset of 15 samples from across the viral titer range and resequenced on an Illumina MiSeq platform. The proportions of reads generated that mapped to the influenza virus genome were similar between the two sequencing technologies (Fig. S5). From 4 of the samples, nearly complete genomes were obtained. A comparison of consensus se-quences derived from Nanopore and Illumina sequencing showed 100% concordance, except one sample that showed 7 nucleotide differences (identity, 99.94%) (Table S2).
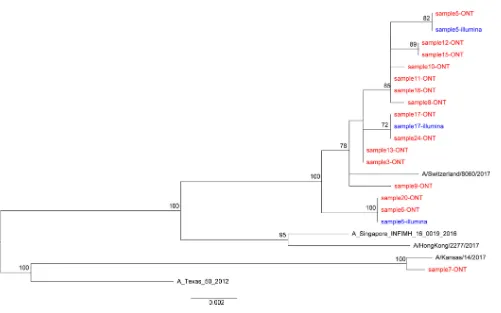
Influenza virus phylogeny. We reconstructed the phylogeny using consensus sequences for the HA gene (Fig. 5). This demonstrates closely related sequences, as expected within one geographic setting in a single influenza season.
Detection of other RNA viruses in clinical samples.Within the 50 clinical samples sequenced, we found limited evidence for the presence of other RNA viruses. Sample
6 produced 109 reads mapping to human coronavirus in addition to ⬎1.5⫻104
influenza A virus reads, suggesting coinfection. We also derived⬎4.0⫻104reads from
human metapneumovirus from an influenza virus-negative sample, providing a nearly complete genome (99.8% coverage) from one sample (Fig. S1, sample I), further detailed previously (44).
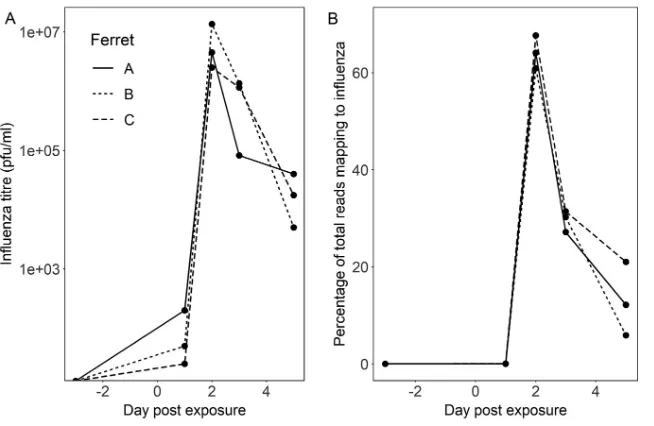
Animal time course study. Finally, we used samples collected from a previous animal experiment (43) to test the reproducibility of our methods across a time course
[image:8.585.42.546.93.309.2]model of influenza A virus infection (three ferrets swabbed preinfection [day⫺3] and
TABLE 1Summary of results from Nanopore sequencing based on pooled samples with various titers of influenza A virus and a consistent titer of Hazara virus controla
Influenza A virus titer (genome copies/ml)
Dilution pool no.
Total no. of reads
No. of influenza A virus reads (reads per million)
Influenza A virus subtypingb
No. of Hazara virus reads (reads per million)
106 1 473,718 33,103 (6.9⫻104) H3N2 527 (1.1⫻103)
2 572,106 6,957 (1.2⫻104) H3N2 102 (178)
3 526,852 41,196 (7.8⫻104) H3N2 534 (1.0⫻103)
104 1 354,163 280 (791) H3N2 738 (2.1⫻103)
2 433,033 299 (690) H3N2 691 (1.6⫻103)
3 43,512 2 (46) Not possible 9 (207)
103 1 231,929 7 (30) H3N2 298 (1.3⫻103)
2 461,281 24 (52) H3N2 638 (1.4⫻103)
3 397,672 2 (5) Not possible 38 (96)
102 1 375,183 1 (3) Not possible 453 (1.2⫻103)
2 671,133 0 (0) Not possible 598 (891)
3 37,897 0 (0) Not possible 2 (53)
Negative 1 903,430 0 (0) NA 1,731 (1.9⫻103)
2 900,471 0 (0) NA 692 (768)
3 818,549 0 (0) NA 54 (66)
aEach dilution is undertaken in triplicate (shown as 3 dilution pools). bNA, not applicable.
on May 17, 2020 by guest
http://jcm.asm.org/
then sampled at days 1, 2, 3, and 5 following laboratory infection with influenza A virus). The proportion of viral reads present at each time point was highly congruent with viral titer (titer is shown in Fig. 6A and sequencing reads in Fig. 6B). We generated consensus genome sequences from Nanopore data at days 2, 3, and 5 postinfection; these were 100% concordant with Illumina-derived consensus sequences from the same cDNA (Table S2).
DISCUSSION
To our knowledge, this is the first report of successfully applying metagenomic Nanopore sequencing directly to respiratory samples to detect influenza virus and generate influenza virus sequences. The approach demonstrates excellent specificity. Sensitivity varies by viral titer but is comparable to that of existing laboratory diagnostic
tests for CT values of ⬍30. Our optimized protocol depletes human and bacterial
nucleic acids and reduces the time from sample to sequence. This method has the potential to be further optimized and validated to improve sensitivity for influenza virus, identify other RNA viruses, detect drug resistance mutations, and provide insights into quasispecies diversity (45, 46). At a population level, these sequence-based diag-nostic data can, in addition, provide phyloepidemiological reconstruction, insights into transmission events, the potential to estimate vaccine efficacy (47), and approaches for public health intervention (48).
Whole-genome viral sequencing, coupled with phylogenetic analysis and appropri-ate clinical metadata, can contribute to the accurappropri-ate tracking of outbreaks across time
and space (49). The metagenomic method employed here produced⬎90% complete
genomes for 17/27 samples with aCTvalue ofⱕ30 (Fig. S4), demonstrating the ability
of metagenomics to produce sufficient data for influenza virus diagnostics and genome characterization, while also detecting and sequencing other common RNA viruses.
Despite time reductions in wet-laboratory processing, this method requires further modification to simplify and accelerate the protocol if it is to become viable as a near-to-patient test. High error rates are a recognized concern in Nanopore sequence data, and cross-barcode contamination can create challenges when low- and high-titer samples are batched (21). To avoid these problems, we batched samples according to
CTvalue and applied stringent barcode demultiplexing criteria; however, this reduces
the total data available for analysis, typically by ⬃50% but with variation between
sequencing runs (21). For future primary diagnostic use, it would be preferable to sequence samples individually using a lower-throughput flow cell, e.g., ONT Flongle
FIG 4Total and proportion of influenza virus reads derived by Nanopore sequencing of individual samples across a range ofCTvalues.CTvalues were derived by testing using the GeneXpert (Cepheid) assay in a clinical diagnostic laboratory. Left,
correlation betweenCTvalue and total number of influenza virus reads generated.R2⫽0.604,P⫽2.47e⫺08. Right,
correlation betweenCTvalue and number of influenza virus reads per million reads.R2⫽0.623,P⫽1.07e⫺08.
Nanopore Sequencing of Influenza Virus Journal of Clinical Microbiology
on May 17, 2020 by guest
http://jcm.asm.org/
[image:9.585.41.430.70.250.2](each paired with a negative-extraction-control sample, for which a prior spike with Hazara virus, using the same methods described here, would remain appropriate). Careful optimization of laboratory and bioinformatic methods is required to resolve individual sequence polymorphisms, particularly for drug resistance alleles.
Infectious Diseases Society of America (IDSA) guidelines (9) recommend nasal/ nasopharyngeal specimens for influenza diagnosis, but throat swabs are easier to collect in clinical practice and therefore account for the majority of diagnostic samples processed by our clinical microbiology laboratory. Further work is needed to investigate the sensitivity and specificity of our protocol for a wider array of respiratory sample types (also including bronchoalveolar lavage fluid, sputum, and saliva), which may contain different degrees of contaminating bacterial and/or human reads. Loss of assay sensitivity due to the presence of high-level background DNA from either the host or bacterial origin is a fundamental issue for metagenomic approaches, even in cell-free sample types such as cerebrospinal fluid (50). This challenge is exacerbated in throat swabs, as seen in our data. Our use of Hazara virus as an internal positive control allows
us to identify those samples in which sensitivity has dropped to⬍104 viral genome
copies per ml. In our test set, 8% of samples showed insufficient sensitivity for Hazara virus; however, half of these contained a high titer of influenza virus, so only 4% were true sensitivity failures. This figure is in line with the reported 6% failure rate due to high background for RNA virus detection from a clinically validated metagenomic sequencing assay for pathogen detection in cerebrospinal fluid (50).
At the higher CT values in our clinical samples (CT, 30 to 40), the sensitivity of
Nanopore sequencing was reduced compared to that of the current PCR-based test (GeneXpert assay; Cepheid). Further optimization will be required to maximize the diagnostic yield from this group of samples without sacrificing specificity.
The correlation betweenCTvalue and Nanopore reads confirms semiquantitative
FIG 5Phylogenetic trees of consensus influenza virus HA gene derived by Nanopore and Illumina sequencing. A maximum likelihood tree was generated using 500 bootstrap replicates in the RAxML v8.2.10 software. Bootstrap values of⬎70 are shown. The scale bar shows the substitutions per site. Red and blue indicate sequences derived from Oxford Nanopore Technology (ONT) and Illumina sequencing, respectively. Reference sequences are shown in black.
on May 17, 2020 by guest
http://jcm.asm.org/
[image:10.585.45.546.61.374.2]output. Using samples from the ferret influenza virus model, collected under standard-ized laboratory conditions, we demonstrated excellent reproducibility of viral read proportions at a given viral titer across biological replicates. However, we observed heterogeneity in output between clinical samples as well as between Nanopore flow cells, suggesting that the current platform is not yet sufficiently reliable for reproducibly generating quantitative data. In addition, the detection of positive controls can be impaired in high-background samples.
Future application of this method will involve real-time laboratory testing of respi-ratory samples, running the platform head to head with existing clinical diagnostics to further assess sensitivity and specificity, and using influenza virus sequence data to investigate transmission events. Identifying instances of nosocomial transmission may shed light on health care-acquired infection, thus helping to improve infection control practice. Assessment of diversity within deep-sequence data sets provides an oppor-tunity to investigate the relationship between within-host polymorphisms and clinical outcomes. Long-read sequences confer the potential advantage of identifying viral haplotypes and ascertaining the extent to which significant polymorphisms are trans-mitted together or independently (24). We have shown that the method is robust for the identification of commonly circulating influenza virus strains in human populations, but further investigation is required to ascertain the extent to which it performs reliably in other (avian and animal) strains.
Comparison with existing/alternative approaches.The current standard assay for influenza diagnosis employed within the large tertiary referral teaching hospital in which this study was performed is the GeneXpert assay (Cepheid), which detects influenza A and B viruses and respiratory syncytial virus (RSV). Wider testing is performed on a subset of samples using the BioFire FilmArray respiratory panel (bioMérieux), targeted at 20 common respiratory pathogens (17 viruses and 3 bacteria). These assays have the advantages over a metagenomic approach of higher sensitivity, shorter handling times, simpler laboratory workflow, and very rapid time to result (30 and 65 min, respectively). Compared to a metagenomic approach, their limitations are that no sequence data informative for molecular epidemiology and drug resistance typing are generated for the target pathogens, and that the assay will only detect the small number of pathogens targeted. Periodic refinement of such assays is required in
FIG 6Time course experiment showing influenza A virus infection in three laboratory ferrets. Infection was introduced at day 0. Samples were collected 3 days prior to infection and at days 1, 3 and 5 postinfection. (A and B) Influenza virus titer (log scale) (A) and proportion of total Nanopore reads (linear scale) (B) mapping to influenza A virus from metagenomic sequencing of ferret nasal washes taken before and after influenza virus challenge.
Nanopore Sequencing of Influenza Virus Journal of Clinical Microbiology
on May 17, 2020 by guest
http://jcm.asm.org/
[image:11.585.43.370.69.282.2]the event of newly emergent pathogens or diverse strains of established pathogens leading to assay escape. This is not an issue affecting metagenomic sequencing, which has the ability to detect all RNA viruses in a sequence-independent manner. At the time of undertaking this laboratory work, the materials costs of the metagenomic
sequenc-ing were⬃£140 per sample when multiplexing six samples per flow cell and
purchas-ing 48 flow cells together. The cost of the current influenza A/B and RSV GeneXpert test
is⬃£56, and the BioFire RP panel costs⬃£139 per sample. The existing tests have the
significant advantage of short handling times and simple processing, whereas the
metagenomic sequencing requires⬃8 h and skilled laboratory staff.
Alternative approaches to generate sequence data include amplicon-based se-quencing of the influenza virus genome (51, 52). However, this approach detects only the target pathogen, requiring multiple assays or more complex multiplex primer schemes to add targets and capture diverse strains of the original target. The use of short-read Illumina sequencing instead of Nanopore sequencing for metagenomic sequencing of influenza virus (53) provides the current gold standard of sequence quality and some potential cost savings per base of sequence generated. However, our
data show that at a relatively modest minimum coverage depth of 10⫻,
Nanopore-generated consensus viral genome sequences are 99.95 to 100% identical to Illumina sequences. Of the 13 samples compared, 12 samples were 100% concordant. The few bases that differed between the technologies in a single sample appear to be clear in each case and a genuine disagreement between the long- and short-read approaches,
rather than simply being due to the higher per-base error rate of Nanopore per se.
Larger and more diverse data sets will be required to set more rigorous thresholds for base calling. Currently, it is wise to bear such potential issues in mind when comparing genome sequences generated by different technological platforms.
The per-read differences in base accuracy are also compensated for by the increased read length, providing further confidence in the case of individual read taxonomic assignment. Consideration of relative costs must also take into account other cost-saving attributes. These include the substantially lower infrastructure and startup costs of Nanopore sequencing, the unique ability to interrogate sequence data as they are generated in real time, and the potential for the portable MinION device to be utilized near to patient, potentially decreasing turnaround time, particularly for high-virus-load samples which may be identified within minutes. The throughput of the Nanopore flow cells allows for a small number of samples to be run immediately rather than requiring samples to be batched to reach a number sufficient to cost efficiently run a greater-throughput short-read sequencing device. In the future, the use of an even lower-throughput flow cell with the ONT Flongle adaptor may allow individual samples to be run per cell, offering quicker turnaround per sample and minimizing cross-sample contamination. A summary table comparing the different approaches is included in supplemental material (Table S3).
Limitations of the method.The current limitations of metagenomic methods are their sensitivity in the context of low-pathogen-titer samples. PCR-based methods measure the absolute count of viral genome copies present within a sample. Metagenomic sequencing measures the proportion of total RNA that is viral. Metag-enomic sequencing is therefore affected by the level of nontarget RNA within a given sample, whereas PCR is not. As demonstrated here (Fig. 2b and Table 1), detection of
as little as 102 genome copies per ml is possible from throat swab samples (a level
comparable with PCR-based methods), but variation in the level of background nucleic acids between individual samples makes detection at this level inconsistent. Further development of methods to deplete host and bacterial RNA within the samples is
required to improve the performance of the assay atCTvalues of⬎30. Enrichment of
pathogen sequences within libraries through either target capture or amplification is also an effective method to reduce the limit of target detection (54, 55) but requires the samea prioriknowledge of both which pathogens are to be targeted and the full range of circulating viral diversity as other targeted methods discussed above, albeit with
on May 17, 2020 by guest
http://jcm.asm.org/
increased tolerance for diversity over PCR-based methods. A further limitation com-pared to alternative sequencing technologies is the lack of confidence in determining the presence of minority variants due to the limited per-read accuracy, although we expect this to be addressed in future iterations of the ONT sequencing.
In summary, while substantial further work is needed, our methods show promise for generating influenza virus sequences directly from respiratory samples. The “pathogen-agnostic” metagenomic sequencing approach offers an opportunity for simultaneous testing for a wide range of potential pathogens, providing a faster route to optimum treatment and contributing to antimicrobial stewardship. Longer term, this approach has promise as a routine laboratory test, providing data to inform treatment, vaccine design and deployment, infection control policies, and surveillance.
SUPPLEMENTAL MATERIAL
Supplemental material is available online only.
SUPPLEMENTAL FILE 1, PDF file, 0.3 MB.
ACKNOWLEDGMENTS
The study was funded by the NIHR Oxford Biomedical Research Centre. Computa-tion used the Oxford Biomedical Research Computing (BMRC) facility, a joint develop-ment between the Wellcome Centre for Human Genetics and the Big Data Institute supported by Health Data Research UK and the NIHR Oxford Biomedical Research Centre.
The views expressed in this publication are those of the authors and not necessarily those of the NHS, the National Institute for Health Research, the Department of Health, or Public Health England.
P.C.M. is funded by the Wellcome Trust (grant 110110). D.W.C., T.E.A.P., and A.S.W. are NIHR senior investigators.
REFERENCES
1. Krammer F, Smith GJD, Fouchier RAM, Peiris M, Kedzierska K, Doherty PC, Palese P, Shaw ML, Treanor J, Webster RG, García-Sastre A. 2018. Influenza. Nat Rev Dis Primers 4:3.https://doi.org/10.1038/s41572-018 -0002-y.
2. Joseph U, Su YCF, Vijaykrishna D, Smith G. 2017. The ecology and adaptive evolution of influenza A interspecies transmission. Influenza Other Respir Viruses 11:74 – 84.https://doi.org/10.1111/irv.12412. 3. Humphreys M. 2018. The influenza of 1918: evolutionary perspectives in
a historical context. Evol Med Public Health 2018:219 –229.https://doi .org/10.1093/emph/eoy024.
4. Smith GJD, Vijaykrishna D, Bahl J, Lycett SJ, Worobey M, Pybus OG, Ma SK, Cheung CL, Raghwani J, Bhatt S, Peiris JSM, Guan Y, Rambaut A. 2009. Origins and evolutionary genomics of the 2009 swine-origin H1N1 in-fluenza A epidemic. Nature 459:1122–1125. https://doi.org/10.1038/ nature08182.
5. Sutton TC. 2018. The pandemic threat of emerging H5 and H7 avian influenza viruses. Viruses 10:E461.https://doi.org/10.3390/v10090461. 6. Xiang D, Pu Z, Luo T, Guo F, Li X, Shen X, Irwin DM, Murphy RW, Liao M,
Shen Y. 2018. Evolutionary dynamics of avian influenza A H7N9 virus across five waves in mainland China, 2013–2017. J Infect 77:205–211. https://doi.org/10.1016/j.jinf.2018.05.006.
7. World Health Organization. 2019. Ten threats to global health in 2019. World Health Organization, Geneva, Switzerland.https://www.who.int/ emergencies/ten-threats-to-global-health-in-2019.
8. World Health Organization. 2018. Burden of disease. World Health Organi-zation, Geneva, Switzerland. https://www.who.int/influenza/surveillance _monitoring/bod/en/.
9. Uyeki TM, Bernstein HH, Bradley JS, Englund JA, File TM, Jr, Fry AM, Gravenstein S, Hayden FG, Harper SA, Hirshon JM, Ison MG, Johnston BL, Knight SL, McGeer A, Riley LE, Wolfe CR, Alexander PE, Pavia AT. 2018. Clinical practice guidelines by the Infectious Diseases Society of America: 2018 update on diagnosis, treatment, chemoprophylaxis, and institu-tional outbreak management of seasonal influenza. Clin Infect Dis 48: 1003–1032.https://doi.org/10.1086/598513.
10. Iuliano AD, Roguski KM, Chang HH, Muscatello DJ, Palekar R, Tempia S,
Cohen C, Gran JM, Schanzer D, Cowling BJ, Wu P, Kyncl J, Ang LW, Park M, Redlberger-Fritz M, Yu H, Espenhain L, Krishnan A, Emukule G, van Asten L, Pereira da Silva S, Aungkulanon S, Buchholz U, Widdowson M-A, Bresee JS, Global Seasonal Influenza-associated Mortality Collaborator Network. 2018. Estimates of global seasonal influenza-associated respi-ratory mortality: a modelling study. Lancet 391:1285–1300.https://doi .org/10.1016/S0140-6736(17)33293-2.
11. Morris DH, Gostic KM, Pompei S, Bedford T, Łuksza M, Neher RA, Grenfell BT, Lässig M, McCauley JW. 2018. Predictive modeling of influenza shows the promise of applied evolutionary biology. Trends Microbiol 26: 102–118.https://doi.org/10.1016/j.tim.2017.09.004.
12. Blanco N, Eisenberg MC, Stillwell T, Foxman B. 2016. What transmission precautions best control influenza spread in a hospital? Am J Epidemiol 183:1045–1054.https://doi.org/10.1093/aje/kwv293.
13. Sansone M, Wiman Å, Karlberg ML, Brytting M, Bohlin L, Andersson L-M, Westin J, Nordén R. 2019. Molecular characterization of a nosocomial outbreak of influenza B virus in an acute care hospital setting. J Hosp Infect 101:30 –37.https://doi.org/10.1016/j.jhin.2018.06.004.
14. Ito Y. 2018. Clinical diagnosis of influenza. Methods Mol Biol 1836:23–31. https://doi.org/10.1007/978-1-4939-8678-1_2.
15. Green DA, StGeorge K. 2018. Rapid antigen tests for influenza: rationale and significance of the FDA reclassification. J Clin Microbiol 56:e00711 -18.https://doi.org/10.1128/JCM.00711-18.
16. Benirschke RC, McElvania E, Thomson RB, Jr, Kaul K, Das S. 2019. Clinical impact of rapid point-of-care polymerase chain reaction influenza test-ing in an urgent care setttest-ing: a stest-ingle center study. J Clin Microbiol 57:e01281-18.https://doi.org/10.1128/JCM.01281-18.
17. Schmidt RLJ, Simon A, Popow-Kraupp T, Laggner A, Haslacher H, Fritzer-Szekeres M, Redlberger-Fritz M, Mayer FJ. 2018. A novel PCR-based point-of-care method facilitates rapid, efficient, and sensitive diagnosis of influenza virus infection. Clin Microbiol Infect 25:1032–1037.https:// doi.org/10.1016/j.cmi.2018.12.017.
18. Votintseva AA, Bradley P, Pankhurst L, del Ojo Elias C, Loose M, Nilgiri-wala K, Chatterjee A, Smith EG, Sanderson N, Walker TM, Morgan MR, Wyllie DH, Walker AS, Peto TEA, Crook DW, Iqbal Z. 2017. Same-day
Nanopore Sequencing of Influenza Virus Journal of Clinical Microbiology
on May 17, 2020 by guest
http://jcm.asm.org/
diagnostic and surveillance data for tuberculosis via whole-genome sequencing of direct respiratory samples. J Clin Microbiol 55:1285–1298. https://doi.org/10.1128/JCM.02483-16.
19. Yan Y, Jia X-J, Wang H-H, Fu X-F, Ji J-M, He P-Y, Chen L-X, Luo J-Y, Chen Z-W. 2016. Dynamic quantification of avian influenza H7N9(A) virus in a human infection during clinical treatment using droplet digital PCR. J Virol Methods 234:22–27.https://doi.org/10.1016/j.jviromet.2016.04.001. 20. Kafetzopoulou LE, Efthymiadis K, Lewandowski K, Crook A, Carter D, Osborne J, Aarons E, Hewson R, Hiscox JA, Carroll MW, Vipond R, Pullan ST. 2018. Assess-ment of metagenomic Nanopore and Illumina sequencing for recovering whole genome sequences of chikungunya and dengue viruses directly from clinical samples. Euro Surveill 23:pii⫽1800228.https://www.eurosurveillance .org/content/10.2807/1560-7917.ES.2018.23.50.1800228.
21. Xu Y, Lewandowski K, Lumley S, Pullan S, Vipond R, Carroll M, Foster D, Matthews PC, Peto T, Crook D. 2018. Detection of viral pathogens with multiplex Nanopore MinION sequencing: be careful with cross-talk. Front Microbiol 9:2225.https://doi.org/10.3389/fmicb.2018.02225. 22. Karamitros T, van Wilgenburg B, Wills M, Klenerman P, Magiorkinis G.
2018. Nanopore sequencing and full genome de novo assembly of human cytomegalovirus TB40/E reveals clonal diversity and structural variations. BMC Genomics 19:577.https://doi.org/10.1186/s12864-018 -4949-6.
23. Greninger AL, Naccache SN, Federman S, Yu G, Mbala P, Bres V, Stryke D, Bouquet J, Somasekar S, Linnen JM, Dodd R, Mulembakani P, Schneider BS, Muyembe-Tamfum J-J, Stramer SL, Chiu CY. 2015. Rapid metag-enomic identification of viral pathogens in clinical samples by real-time Nanopore sequencing analysis. Genome Med 7:99.https://doi.org/10 .1186/s13073-015-0220-9.
24. McNaughton AL, Roberts HE, Bonsall D, de Cesare M, Mokaya J, Lumley SF, Golubchik T, Piazza P, Martin JB, de Lara C, Brown A, Azim Ansari M, Bowden R, Barnes E, Matthews PC. 2018. Illumina and Nanopore meth-ods for whole genome sequencing of hepatitis B virus (HBV). bioRxiv https://www.biorxiv.org/content/biorxiv/suppl/2018/11/14/470633.DC1/ 470633-1.pdf.
25. Keller MW, Rambo-Martin BL, Wilson MM, Ridenour CA, Shepard SS, Stark TJ, Neuhaus EB, Dugan VG, Wentworth DE, Barnes JR. 2018. Direct RNA sequencing of the coding complete influenza A virus genome. Sci Rep 8:14408.https://doi.org/10.1038/s41598-018-32615-8.
26. Eckert SE, Chan J-M, Houniet D, the PATHSEEK Consortium, Breuer J, Speight G. 2016. Enrichment by hybridisation of long DNA fragments for Nanopore sequencing. Microb Genom 2:e000087.https://doi.org/10 .1099/mgen.0.000087.
27. Rambo-Martin BL, Keller MW, Wilson MM, Nolting JM, Anderson TK, Vincent AL, Bagal U, Jang Y, Neuhaus EB, Todd Davis C, Bowman AS, Wentworth DE, Barnes JR. 2019. Mitigating pandemic risk with influenza A virus field surveillance at a swine-human interface. bioRxivhttps:// www.biorxiv.org/content/10.1101/585588v1.
28. CDC. 2019. Influenza (flu) including seasonal, avian, swine, pandemic, and other. Centers for Disease Control and Prevention, Atlanta, GA. https://www.cdc.gov/flu/professionals/diagnosis/info-collection.htm. 29. Lewandowski K, Bell A, Miles R, Carne S, Wooldridge D, Manso C,
Hennessy N, Bailey D, Pullan ST, Gharbia S, Vipond R. 2017. The effect of nucleic acid extraction platforms and sample storage on the integrity of viral RNA for use in whole genome sequencing. J Mol Diagn 19:303–312. https://doi.org/10.1016/j.jmoldx.2016.10.005.
30. Marriott AC, Dove BK, Whittaker CJ, Bruce C, Ryan KA, Bean TJ, Rayner E, Pearson G, Taylor I, Dowall S, Plank J, Newman E, Barclay WS, Dimmock NJ, Easton AJ, Hallis B, Silman NJ, Carroll MW. 2014. Low dose influenza virus challenge in the ferret leads to increased virus shedding and greater sensitivity to oseltamivir. PLoS One 9:e94090.https://doi.org/10 .1371/journal.pone.0094090.
31. Kim D, Song L, Breitwieser FP, Salzberg SL. 2016. Centrifuge: rapid and sensitive classification of metagenomic sequences. Genome Res 26: 1721–1729.https://doi.org/10.1101/gr.210641.116.
32. Li H. 2018. Minimap2: pairwise alignment for nucleotide sequences. Bioinformatics 34:3094 –3100.https://doi.org/10.1093/bioinformatics/ bty191.
33. Squires RB, Noronha J, Hunt V, García-Sastre A, Macken C, Baumgarth N, Suarez D, Pickett BE, Zhang Y, Larsen CN, Ramsey A, Zhou L, Zaremba S, Kumar S, Deitrich J, Klem E, Scheuermann RH. 2012. Influenza research database: an integrated bioinformatics resource for influenza research and surveillance. Influenza Other Respir Viruses 6:404 – 416.https://doi .org/10.1111/j.1750-2659.2011.00331.x.
34. Li H, Handsaker B, Wysoker A, Fennell T, Ruan J, Homer N, Marth G,
Abecasis G, Durbin R, 1000 Genome Project Data Processing Subgroup. 2009. The Sequence Alignment/Map format and SAMtools. Bioinformat-ics 25:2078 –2079.https://doi.org/10.1093/bioinformatics/btp352. 35. Loman NJ, Quick J, Simpson JT. 2015. A complete bacterial genome
assembled de novo using only Nanopore sequencing data. Nat Methods 12:733–735.https://doi.org/10.1038/nmeth.3444.
36. Quick J, Loman NJ, Duraffour S, Simpson JT, Severi E, Cowley L, Bore JA, Koundouno R, Dudas G, Mikhail A, Ouédraogo N, Afrough B, Bah A, Baum JH, Becker-Ziaja B, Boettcher J-P, Cabeza-Cabrerizo M, Camino-Sanchez A, Carter LL, Doerrbecker J, Enkirch T, Dorival IGG, Hetzelt N, Hinzmann J, Holm T, Kafetzopoulou LE, Koropogui M, Kosgey A, Kuisma E, Logue CH, Mazzarelli A, Meisel S, Mertens M, Michel J, Ngabo D, Nitzsche K, Pallash E, Patrono LV, Portmann J, Repits JG, Rickett NY, Sachse A, Singethan K, Vitoriano I, Yemanaberhan RL, Zekeng EG, Trina R, Bello A, Sall AA, Faye O, et al. 2016. Real-time, portable genome sequencing for Ebola surveillance. Nature 530:228 –232.https://doi.org/ 10.1038/nature16996.
37. Quick J, Grubaugh ND, Pullan ST, Claro IM, Smith AD, Gangavarapu K, Oliveira G, Robles-Sikisaka R, Rogers TF, Beutler NA, Burton DR, Lewis-Ximenez LL, de Jesus JG, Giovanetti M, Hill SC, Black A, Bedford T, Carroll MW, Nunes M, Alcantara LC, Jr, Sabino EC, Baylis SA, Faria NR, Loose M, Simpson JT, Pybus OG, Andersen KG, Loman NJ. 2017. Multiplex PCR method for MinION and Illumina sequencing of Zika and other virus genomes directly from clinical samples. Nat Protoc 12:1261–1276.https:// doi.org/10.1038/nprot.2017.066.
38. Bolger AM, Lohse M, Usadel B. 2014. Trimmomatic: a flexible trimmer for Illumina sequence data. Bioinformatics 30:2114 –2120.https://doi.org/10 .1093/bioinformatics/btu170.
39. Li H. 2013. Aligning sequence reads, clone sequences and assembly contigs with BWA-MEM. arXiv arXiv:1303.3997.
40. Penedos AR, Myers R, Hadef B, Aladin F, Brown KE. 2015. Assessment of the utility of whole genome sequencing of measles virus in the charac-terisation of outbreaks. PLoS One 10:e0143081.https://doi.org/10.1371/ journal.pone.0143081.
41. Stamatakis A. 2014. RAxML version 8: a tool for phylogenetic analysis and post-analysis of large phylogenies. Bioinformatics 30:1312–1313. https://doi.org/10.1093/bioinformatics/btu033.
42. Edgar RC. 2004. MUSCLE: multiple sequence alignment with high accu-racy and high throughput. Nucleic Acids Res 32:1792.https://doi.org/10 .1093/nar/gkh340.
43. Gooch KE, Marriott AC, Ryan KA, Yeates P, Slack GS, Brown PJ, Fothergill R, Whittaker CJ, Carroll MW. 2019. Heterosubtypic cross-protection cor-relates with cross-reactive interferon-gamma-secreting lymphocytes in the ferret model of influenza. Sci Rep 9:2617.https://doi.org/10.1038/ s41598-019-38885-0.
44. Xu Y, Lewandowski K, Lumley S, Sanderson ND, Vaughan A, Vipond RT, Carroll MW, Jeffery K, Foster D, Sarah Walker A, Peto TEA, Crook DW, Pullan ST, Matthews PC. 2018. Nanopore metagenomic sequencing of full length human metapneumovirus (HMPV) within a unique sub-lineage. bioRxivhttps://www.biorxiv.org/node/147782.full.
45. Meinel DM, Heinzinger S, Eberle U, Ackermann N, Schönberger K, Sing A. 2018. Whole genome sequencing identifies influenza A H3N2 transmis-sion and offers superior resolution to classical typing methods. Infection 46:69 –76.https://doi.org/10.1007/s15010-017-1091-3.
46. Rambaut A, Pybus OG, Nelson MI, Viboud C, Taubenberger JK, Holmes EC. 2008. The genomic and epidemiological dynamics of human influ-enza A virus. Nature 453:615– 619.https://doi.org/10.1038/nature06945. 47. Thompson CP, Lourenço J, Walters AA, Obolski U, Edmans M, Palmer DS, Kooblall K, Carnell GW, O’Connor D, Bowden TA, Pybus OG, Pollard AJ, Temperton NJ, Lambe T, Gilbert SC, Gupta S. 2018. A naturally protective epitope of limited variability as an influenza vaccine target. Nat Com-mun 9:3859.https://doi.org/10.1038/s41467-018-06228-8.
48. Kafetzopoulou LE, Pullan ST, Lemey P, Suchard MA, Ehichioya DU, Pahlmann M, Thielebein A, Hinzmann J, Oestereich L, Wozniak DM, Efthymiadis K, Schachten D, Koenig F, Matjeschk J, Lorenzen S, Lumley S, Ighodalo Y, Adomeh DI, Olokor T, Omomoh E, Omiunu R, Agbukor J, Ebo B, Aiyepada J, Ebhodaghe P, Osiemi B, Ehikhametalor S, Akhilomen P, Airende M, Esumeh R, Muoebonam E, Giwa R, Ekanem A, Igenegbale G, Odigie G, Okonofua G, Enigbe R, Oyakhilome J, Yerumoh EO, Odia I, Aire C, Okonofua M, Atafo R, Tobin E, Asogun D, Akpede N, Okokhere PO, Rafiu MO, Iraoyah KO, Iruolagbe CO, et al. 2019. Metagenomic sequenc-ing at the epicenter of the Nigeria 2018 Lassa fever outbreak. Science 363:74 –77.https://doi.org/10.1126/science.aau9343.
49. Dudas G, Bedford T. 2019. The ability of single genes vs full genomes to
on May 17, 2020 by guest
http://jcm.asm.org/
resolve time and space in outbreak analysis. bioRxivhttps://www.biorxiv .org/content/10.1101/582957v1.
50. Miller S, Naccache SN, Samayoa E, Messacar K, Arevalo S, Federman S, Stryke D, Pham E, Fung B, Bolosky WJ, Ingebrigtsen D, Lorizio W, Paff SM, Leake JA, Pesano R, DeBiasi R, Dominguez S, Chiu CY. 2019. Laboratory validation of a clinical metagenomic sequencing assay for pathogen detection in cerebrospinal fluid. Genome Res 29:831– 842.https://doi .org/10.1101/gr.238170.118.
51. Imai K, Tamura K, Tanigaki T, Takizawa M, Nakayama E, Taniguchi T, Okamoto M, Nishiyama Y, Tarumoto N, Mitsutake K, Murakami T, Mae-saki S, Maeda T. 2018. Whole genome sequencing of influenza A and B viruses with the MinION sequencer in the clinical setting: a pilot study. Front Microbiol 9:2748.https://doi.org/10.3389/fmicb.2018.02748. 52. Wang J, Moore NE, Deng Y-M, Eccles DA, Hall RJ. 2015. MinION Nanopore
sequencing of an influenza genome. Front Microbiol 6:766.https://doi .org/10.3389/fmicb.2015.00766.
53. Greninger AL, Chen EC, Sittler T, Scheinerman A, Roubinian N, Yu G, Kim E,
Pillai DR, Guyard C, Mazzulli T, Isa P, Arias CF, Hackett J, Jr, Schochetman G, Miller S, Tang P, Chiu CY. 2010. A metagenomic analysis of pandemic influenza A (2009 H1N1) infection in patients from North America. PLoS One 5:e13381.https://doi.org/10.1371/journal.pone.0013381.
54. Wylie TN, Wylie KM, Herter BN, Storch GA. 2015. Enhanced virome sequencing using targeted sequence capture. Genome Res 25: 1910 –1920.https://doi.org/10.1101/gr.191049.115.
55. Metsky HC, Siddle KJ, Gladden-Young A, Qu J, Yang DK, Brehio P, Goldfarb A, Piantadosi A, Wohl S, Carter A, Lin AE, Barnes KG, Tully DC, Corleis B, Hennigan S, Barbosa-Lima G, Vieira YR, Paul LM, Tan AL, Garcia KF, Parham LA, Odia I, Eromon P, Folarin OA, Goba A, Simon-Lorière E, Hensley L, Balmaseda A, Harris E, Kwon DS, Allen TM, Runstadler JA, Smole S, Bozza FA, Souza TML, Isern S, Michael SF, Lorenzana I, Gehrke L, Bosch I, Ebel G, Grant DS, Happi CT, Park DJ, Gnirke A, Sabeti PC, Matranga CB. 2019. Capturing sequence diversity in metagenomes with comprehensive and scalable probe design. Nat Biotechnol 37:160 –168. https://doi.org/10.1038/s41587-018-0006-x.
Nanopore Sequencing of Influenza Virus Journal of Clinical Microbiology