The Role of Insulin Resistance in Diabetic Neuropathy in Koreans
with Type 2 Diabetes Mellitus: A 6-Year Follow-Up Study
Yu Na Cho,
1Kee Ook Lee,
2Julie Jeong,
3Hyung Jun Park,
4Seung-Min Kim,
1Ha Young Shin,
1Ji-Man Hong,
5Chul Woo Ahn,
6and Young-Chul Choi
11Department of Neurology, Yonsei University College of Medicine, Seoul;
2Department of Neurology, Konyang University College of Medicine, Daejeon;
3Department of Neurology, Wonkwang University College of Medicine, Gunpo;
4Department of Neurology, Ewha Womans University College of Medicine, Seoul;
5Department of Neurology, Yonsei University College of Medicine, Yongin;
6Department of Internal Medicine, Yonsei University College of Medicine, Seoul, Korea.
Received: August 9, 2013 Revised: September 14, 2013 Accepted: October 2, 2013
Corresponding author: Dr. Young-Chul Choi, Department of Neurology,
Yonsei University College of Medicine, 211 Eonju-ro, Gangnam-gu, Seoul 135-720, Korea.
Tel: 82-2-2019-3323, Fax: 82-2-3462-5904 E-mail: ycchoi@yuhs.ac
∙ The authors have no financial conflicts of interest.
© Copyright:
Yonsei University College of Medicine 2014 This is an Open Access article distributed under the terms of the Creative Commons Attribution Non-Commercial License (http://creativecommons.org/ licenses/by-nc/3.0) which permits unrestricted non-commercial use, distribution, and reproduction in any medium, provided the original work is properly cited.
Purpose: We previously reported that insulin resistance, low high-density lipopro-tein (HDL) cholesterol, and glycaemic exposure Index are independently associated with peripheral neuropathy in Korean patients with type 2 diabetes mellitus. We fol-lowed the patients who participated in that study in 2006 for another 6 years to deter-mine the relationship between insulin resistance and neuropathy. Materials and Methods: This study involved 48 of the original 86 Korean patients with type 2 betes mellitus who were referred to the Neurology clinic for the assessment of dia-betic neuropathy from January 2006 to December 2006. These 48 patients received management for glycaemic control and prevention of diabetic complications in the outpatient clinic up to 2012. We reviewed blood test results and the nerve conduction study findings of these patients, taken over a 6-year period. Results: Low HDL cho-lesterol and high triglycerides significantly influenced the development of diabetic neuropathy. Kitt value (1/insulin resistance) in the previous study affected the occur-rence of neuropathy, despite adequate glycaemic control with HbA1c <7%. Insulin resistance affected the development of diabetic neuropathy after 6 years: insulin re-sistance in 2006 showed a positive correlation with a change in sural sensory nerve action potential in 2012. Conclusion: Diabetic neuropathy can be affected by previ-ous insulin resistance despite regular glycaemic control. Dyslipidaemia should be controlled in patients who show high insulin resistance because HDL cholesterol and triglycerides are strongly correlated with later development of diabetic neuropathy.
Key Words: Insulin resistance, type 2 diabetes mellitus, diabetic neuropathy, met-abolic syndrome
INTRODUCTION
ological examinations, conducted 6 years previously, for the screening of diabetic neuropathy.
MATERIALS AND METHODS
Patients
This study involved 48 of the original 86 Korean patients with type 2 diabetes mellitus who were referred from the dia-betes mellitus clinic at Gangnam Severance Hospital, Seoul, Korea, to the neurology outpatient clinic for the assessment of diabetic neuropathy from January 2006 to December 2006. These 48 patients received management for glycae-mic control and prevention of diabetic complications in the outpatient clinic up to 2012 (Fig. 1). We reviewed blood test results and the nerve conduction study findings of these patients, taken over a 6-year period. Subjects included those with symptomatic neuropathy as well as asymptomatic pa-tients who had been referred for screening purposes. The diagnosis was based on a previous history of diabetes melli-tus or using the American Diabetes Association’s diagnostic guidelines.13 Exclusion criteria were as follows: type 1
dia-betes mellitus, severe liver dysfunction (alanine aminotrans-ferase or aspartate aminotransaminotrans-ferase more than 2 times the upper limit of normal values), severe renal dysfunction (se-rum creatinine >1.6 mg/dL), current smoker, uncontrolled hypertension, recent infection history, malignancy, loss of reduced reactivity to insulin in target tissues such as liver,
muscle, and adipose tissue, and is known to be a major fac-tor in various physiological dysfunctions such as metabolic syndrome (obesity, hyperlipidaemia, hypertension, and glu-cose intolerance).1,2 Insulin resistance and metabolic
syn-drome are the most important risk factors for type 2 diabetes mellitus in Western populations. Korean patients with type 2 diabetes mellitus show different clinical characteristics from those in the West because of racial characteristics, dietary habits, and lifestyle. In Korea, however, the number of pa-tients with type 2 diabetes mellitus who have insulin resis-tance associated with metabolic syndrome has increased.3
We recently showed that insulin resistance is independently associated with peripheral neuropathy in Koreans with type 2 diabetes mellitus regardless of blood glucose level.4
Conventional electrophysiological studies are widely used for the objective diagnosis of diabetic neuropathy. The phys-iological function of nerves can be evaluated quantitatively by nerve conduction study (NCS).5,6 NCS abnormalities
oc-cur early in the course of type 2 diabetes mellitus, and the pattern of progression of peripheral neuropathy shows de-pendence on the length of the nerve fibers.7 NCS shows
complicated abnormalities of sensory, motor, and autonom-ic nervous systems.8 In addition, NCS shows mildly slow
nerve conduction velocity and low amplitude in diabetic polyneuropathy, suggesting that the peripheral neuropathy of type 2 diabetes mellitus is primarily caused by axonal degeneration.9,10
Because type 2 diabetes mellitus is a chronic disease, the management of complications such as neuropathy is impor-tant in terms of quality of life. However, a diagnosis of dia-betic neuropathy can be difficult to make, when based only on clinical characteristics. Patients do not express symp-toms in the course of mild neuropathy, and it is very diffi-cult to identify subclinical diabetic neuropathy without per-forming procedures such as NCS.11 Moreover, in the early
stage of diabetic neuropathy, NCS can only detect the most distal sensory nerves, such as medial-plantar and dorsal su-ral nerves, which are not usually included in routine nerve conduction studies.12
The purpose of this study is to determine whether insulin resistance is associated with the development and progres-sion of neuropathy in patients with type 2 diabetes mellitus. We previously demonstrated that insulin resistance is inde-pendently associated with peripheral neuropathy in Korean patients with type 2 diabetes mellitus.4 In this study, we
an-alysed the follow-up results of blood tests and
electrophysi-Fig. 1. Enrollment and follow-up of the study patients. DMPN, diabetes mel-litus induced polyneuropathy; NCS, nerve conduction study; NCV, nerve conduction velocity.
An
al
ys
is
Fo
llo
w
-u
p
En
ro
llm
en
t
Excluded, n=48 · Expire, n=5
· Refused to participate, n=21 · Out of contact, n=22 In 2006, NCV for DMPN screening of
type 2 DM patients, n=86
In 2012, reassessment for DMPN, n=48 (NCS, neurologic examination, blood marker)
Group I
n=33 Group IIn=6 Group IIIn=9 Normal results of
electrophysiologic study in 2006, n=39
Normal results of electrophysiologic study in 2012,
n=33
Abnormal results of electrophysiologic study in 2006,
n=9
Abnormal results of electrophysiologic study in 2012,
[image:2.595.311.539.466.695.2]considered affected by neuropathy.11 In the absence of a
re-sponse, the contralateral nerve was assessed.14
Insulin resistance
Serum insulin resistance was measured using a short insu-lin tolerance test and estimated by the Kitt index as previ-ously described.15 On the morning of the test day after more
than 10 h of fasting, a 20-gauge catheter was inserted into one arm, a 3-way tap was connected, and blood was ob-tained. A second 20-gauge catheter was inserted for insulin and glucose infusion. After insertion of the second catheter, patients were allowed to rest in the supine position for 20-30 min. A 1:100 dilution of insulin (insulin lispro, 0.1 u/kg) was then injected. Blood was obtained through the 3-way tap just prior to injection (0 min) and at 3, 6, 9, 12, and 15 min after injection and was stored in a tube with ethylene-diaminetetraacetic acid. Serum glucose was measured, and the Kitt value was obtained by linear regression analysis of the decrease in the log glucose value between 3 and 15 min as follows:
Kitt (rate constant for plasma glucose disappearance)= 0.693/t1/2,
where t1/2 is the time at which the baseline blood glucose
level reached 50% of its initial value.
Peripheral blood markers
All blood sampling was performed in the early morning af-ter fasting since midnight. Plasma glucose was measured by the glucose oxidase technique using an auto-analyser (Beckman, Fullerton, CA, USA). HbA1c was analysed us-ing high-performance liquid chromatography (Variant II, Bio-Rad, Hercules, CA, USA). Insulin and C-peptides (fast-ing and postprandial) were measured us(fast-ing radioimmunoas-say (Instar, Stillwater, MN, USA).
The glycaemic exposure (GE) Index was calculated us-ing the followus-ing equation:16
GE Index=(HbA1c)1/2×(duration of DM in years)1/8 Statistical analysis
Continuous variables are given as means with standard de-viation, and categorical variables are given as frequencies and percentages. Univariate analysis was initially performed to evaluate potential covariates associated with the develop-ment of neuropathy. Multivariate analysis using binary lo-dorsalis pedis arterial pulsation, and previous history of
neu-rologic disorders including stroke, peripheral vascular oc-clusive disease, autoimmune disease, or any other possible causes of peripheral neuropathy.
This study was approved by the human research ethical committee at Yonsei University College of Medicine, Seoul, Korea (No.3-2013-0006).
Analytical methods
All patients had height and weight measured for body mass index (BMI) determination, and the following tests were performed upon enrolment in the study.
Diagnosis of peripheral neuropathy
The diagnosis of peripheral neuropathy was made in two stages: objective neurologic exams and electrophysiologic studies, with slight modifications from the Michigan Dia-betic Neuropathy Score.11,14
For neurologic examinations, each patient was assessed for sensitivity, muscle strength, and reflexes of the bilateral upper and lower extremities and scored accordingly.11
Vi-bratory sensitivity was evaluated using a 128-Hz tuning fork and touch sensitivity with a 10 g monofilament. Mus-cle strength was assessed by abduction of the fingers, ex-tension of the great toe, and the ankle dorsiflexion. In addi-tion, reflexes of upper and lower limbs were evaluated.
NCS were performed using electromyography (Key-point, Dantec Medical, Skovlunde, Denmark). Skin tem-perature was measured at the forearm and was maintained at >32°C. Motor and sensory nerve conduction velocities were measured in median, ulnar, peroneal, posterior tibial, and su-ral nerves using standard methods. Electrical stimuli were produced at supramaximal intensity. Sensory nerve conduc-tion was measured using a 0.2-ms duraconduc-tion square wave pulse, 20-2000 Hz filter, 1 ms/division sweep speed, and 10 µV/ division sensitivity. Motor nerve conduction studies were performed using 2-10000 Hz filter, 2 ms/division sweep speed, and 2 mV/division sensitivity. NCS values lower than the 95th percentile of the normal control values were con-sidered abnormal.
The diagnosis of peripheral neuropathy was made when the clinical score was greater than 6 and/or in the presence of at least two abnormal results in NCS, amplitudes, or peak latencies.11,14 A reduction in motor or sensory NCS in
were normal in both 2006 and 2012, and 6 patients who had normal results in 2006 were diagnosed with peripheral neuropathy in 2012. The remaining 9 patients had peripher-al neuropathy peripher-already in 2006. The clinicperipher-al characteristics of the patients are presented in Table 1.
In univariate logistic regression analysis, higher BMI, low-er high-density lipoprotein (HDL) cholestlow-erol, and highlow-er triglyceride levels were related to the presence of peripheral neuropathy (Table 2). However, gender, age, C-peptide, in-sulin, HbA1c, cholesterol, DM duration, GE Index and number of abnormal autonomic function test were not cor-related with peripheral neuropathy. In multivariate analysis using binary logistic regression, high triglyceride and low HDL cholesterol were significantly associated with periph-eral neuropathy after adjusting for age and gender (Table 3). As in 2006, lower HDL cholesterol in 2012 increased the odds ratio for peripheral neuropathy.
We selected patients with a mean HbA1c <7% and good blood glucose control from 2006 to 2012. Among these pa-tients, a lower Kitt value in 2006 was related to the occur-rence of peripheral neuropathy in 2012 (Table 4).
The patients were divided into three groups according to the follow-up NCS results in 2012. In group I patients (n=33), gistic regression was then used for determination of
inde-pendent predictors of the presence of peripheral neuropathy. A p-value less than 0.05 was considered statistically signifi-cant. A general linear model was used to analyse the vari-ability of NCS data between 2006 and 2012. The Kruskal-Wallis test was used as a non-parametric test for comparisons between the three groups that were classified by the results of NCS.
Statistical analysis was performed using SPSS version 18.0 (Statistical Package for Social Sciences, SPSS Inc., Chicago, IL, USA).
RESULTS
Among 86 patients, 40 (46.5%) were diagnosed with pe-ripheral neuropathy in 2006.4 According to the results of our
[image:4.595.72.538.421.687.2]2006 study, insulin resistance (1/Kitt value), GE Index, du-ration of diabetes mellitus, and HDL cholesterol level were significantly different between the peripheral neuropathy group and non-neuropathy group. In 2012, we repeated NCS and blood sampling in 48 of the original 86 patients. In 33 patients, the results of NCS and neurologic examination
Table 1. Patient Demographics and Characteristics
Variables
2006 (n=86) 2012 (n=48)
Normal NCS
(n=46) Abnormal NCS (n=40) Total (n=86) Normal NCS (n=33) Abnormal NCS (n=15) Total (n=48) Age (yrs) 54.26±10.55 55.93±9.23 55.10±9.89 63.15±8.81 66.60±5.47 64.88±7.14
Male-Female ratio 3 5.67 4.25 2.18 6.5 4.34
Duration (yrs) 2.84±2.86 7.69±6.94 5.27±4.9 14.12±8.39 15.73±5.43 14.93±6.91 BMI (kg/m2) 23.86±3.17 24.87±2.76 24.37±2.97 24.09±3.34 25.74±2.66 24.92±3.00 C-peptide (nmol/L) 1.90±0.82 2.19±0.71 2.05±0.77 7.44±3.49 3.96±1.55 5.70±2.52 Insulin (pmol/L) 7.96±4.50 9.54±9.03 8.75±6.77 8.21±3.82 3.75±2.00 5.98±2.91 HbA1c (%) 7.30±1.73 8.20±1.71 7.75±1.72 7.02±0.84 8.34±5.48 7.68±3.16 Triglyceride (mg/dL) 162.83±51.21 176.70±45.48 169.77±48.35 136.24±51.29 169.27±42.48 152.76±46.89 Cholesterol (mg/dL) 182.80±35.38 180.00±30.55 181.4±32.97 178.33±20.80 185.27±18.46 181.8±19.63 LDL-cholesterol (mg/dL) 97.96±36.64 99.86±32.33 98.91±34.49 104.93±16.39 115.29±14.75 110.11±15.57 HDL-cholesterol (mg/dL) 52.28±12.76 44.80±8.43 48.54±10.60 50.03±10.70 40.93±12.87 45.48±11.79 GE Index 1.33±1.47 4.24±4.59 2.79±3.03 6.15±3.97 6.38±3.40 6.27±3.69 Kitt value in 2006 (%/min) 2.81±0.89 2.39±0.94 2.6±0.92 2.69±0.68* 1.93±0.54* 2.31±0.61* MDNS 0.54±1.31 2.18±2.22 1.36±1.77 1.15±1.00 6.33±1.50 3.74±1.25 Number of abnormal
autonomic function test 2.33±0.47 2.93±0.27 2.63±0.37 2.09±0.68 2.00±0.76 2.05±0.72 Abnormal NCS_Segment 0.20±0.40 5.43±2.58 2.82±1.49 0.36±0.49 8.47±3.64 4.42±2.07 BMI, body mass index; GE Index, glycemic exposure index; MDNS, Michigan Diabetic Neuropathy Score; NCS, nerve conduction study; LDL, low-density lipoprotein; HDL, high-density lipoprotein.
Table 2. Univariate Analysis of Risk Factors for the Development of Peripheral Neuropathy after 6 Years Follow-Up
Variables Peripheral neuropathy
Odds ratio 95% CI p value
Gender
Male 1
Female 0.41 0.77-2.189 0.462
Age (yrs)
<60 1
60-70 3.692 0.650-20.969 0.252
>70 3.75 0.579-24.282 0.209
C-peptide (nmol/L)
<3.2 1
>3.2 0.28 0.077-1.017 0.096
Insulin (pmol/L)
<10 1
>10 0.559 0.146-2.138 0.521
HbA1c (%)
<6 1
6-8 0.448 0.026-7.734 0.540
>8 0.333 0.009-11.939 1
BMI (kg/m2)
<25 1
>25 4.6 1.247-16.967 0.018
Cholesterol (mg/dL)
<200 1
>200 2.5 0.441-14.168 0.360
HDL-C (mg/dL)
<45 1
>45 0.25 0.068-0.912 0.031
Triglyceride (mg/dL)
<177 1
>177 6.325 1.617-24.745 0.011
DM duration (yrs)
<10 1
10-20 3.111 0.774-12.508 0.161
>20 3 0.501-17.954 0.327
GE Index
0-3.0 1
3.0-4.0 0.409 0.045-3.684 0.570
>4.0 0.789 0.113-5.528 0.590
Kitt value
>2.7 1
2.0-2.7 6.333 0.920-43.618 0.067
0.0-2.0 10.688 1.875-60.931 0.005
Number of abnormal AFT
1-2 1
3-5 1.222 0.672-1.892 0.312
AFT, autonomic function test; BMI, body mass Index; GE Index, glycemic exposure index; HDL-C, high-density lipoprotein cholesterol; DM, diabetes mel-litus; CI, confidence interval.
and height (Fig. 3).
DISCUSSION
In addition to clearly symptomatic diabetic neuropathy pa-tients, asymptomatic patients also often undergo mild neu-NCS results were normal in 2006 and 2012. In group II
pa-tients (n=6), NCS results were normal in 2006, but abnor-mal at the follow-up NCS in 2012. Group III patients (n=9) had already been diagnosed with diabetic neuropathy by NCS in 2006.
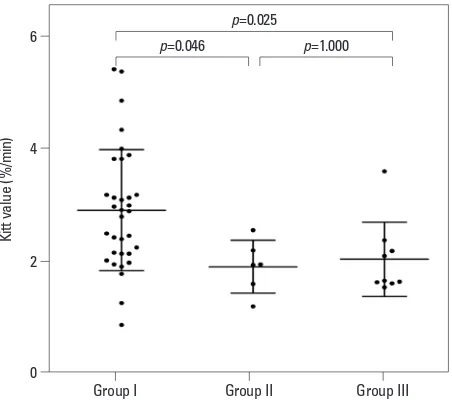
The Kitt value reflects insulin resistance: the lower the Kitt value, the higher the insulin resistance. The Kitt value of these three groups was significantly different (Kruskal-Wal-lis test, p=0.004). In post-hoc analysis, a significant differ-ence in Kitt value was observed between groups I and II (Dunn’s procedure, p=0.046) and between groups I and III (Dunn’s procedure, p=0.025). There was no significant dif-ference in Kitt value between groups II and III (Fig. 2).
We compared the follow-up NCS results and the data from 2006 for each group. In group I, there was no differ-ence between the 2006 and 2012 results. In groups II and III, sural sensory nerve conduction velocity and sensory nerve action potential (SNAP) amplitude were reduced in 2012 compared with the 2006 results, but there were no significant differences in the other parameters of NCS, such as median, ulnar, and tibial nerve conduction.
[image:6.595.68.544.93.234.2]Insulin resistance in 2006 showed a positive correlation (r=0.629, p=0.001) with differences in sural SNAP in group III between 2006 and 2012 after adjusting for age, gender,
Table 3. Multivariate Analysis Using Binary Logistic Regression of Risk Factors for Peripheral Neuropathy after 6 Years (Ad-justed for Age and Gender)
Variables Odds ratio Logistic regression95% CI p value
BMI (kg/m2)
<25 1
>25 2.558 0.456-14.340 0.285
HDL-C (mg/dL)
>45 1
<45 5.292 1.001-27.989 0.050
Triglyceride (mg/dL)
<177 1
>177 6.129 1.057-35.528 0.043
[image:6.595.71.540.282.362.2]BMI, body mass index; HDL-C, high-density lipoprotein cholesterol; CI, confidence interval.
Table 4. The Relationship between Initial Insulin Resistance and Peripheral Neuropathy in Patients with HbA1c <7% during 6 Years
Variables Logistic regression
Odds ratio 95% CI p value
Kitt value
>2.7 1
2.0-2.7 4.000 0.424-37.778 0.226
0.0-2.0 11.200 1.735-2.300 0.011
CI, confidence interval. Kitt value=(1/insulin resistance).
Fig. 2. A significant difference in Kitt value was observed between groups I and II, and between groups I and III. Kitt values=1/insulin resistance.
0 2 4 6
Ki
tt
va
lu
e
(%
/m
in
)
Group I Group II Group III
p=0.046
p=0.025
[image:6.595.314.540.393.594.2]apeutic target in type 2 diabetes mellitus.22,23
HbA1c values reflect overall glycaemic exposure over the prior 2-3 months.24,25 The American Diabetes Association
-recommended treatment goal to prevent microvascular complications in type 2 diabetes mellitus patients is HbA1c <7%, which is considered the standard for the monitoring of glycaemic control.26,27 Recent studies have shown that
high HbA1c is correlated with subclinical diabetic neuropa-thy.28 However, these studies are likely limited, because the
authors did not control the effects of other risk factors such as obesity or dyslipidaemia. Obesity, dyslipidaemia, and im-paired insulin tolerance are components of metabolic syn-drome that may potentially influence the occurrence of idio-pathic neuropathy.29 Therefore, without controlling metabolic
risk factors, it may be incorrect to conclude that only glycae-mic control affects the development of diabetic neuropathy.
In this study, multivariate analysis showed that patient gen-der, age, and obesity were not independent risk factors for di-abetic neuropathy. However, as in our previous study, low HDL cholesterol showed a strong association with neurothy, indicateing that the management of dyslipidaemia in pa-tients with type 2 diabetes mellitus is important for the pre-vention of neuropathy. Microvascular events caused by dyslipidaemia seem to have a lasting impact, even after sever-al years. However, there was no relationship between dyslipi-daemia and neuropathy in patients with HbA1c levels <7%.
Our study showed no difference in insulin resistance be-tween groups II and III; however, there were significant dif-ferences when comparing groups I and II as well as groups I and III. This indicates that past insulin resistance contrib-utes to the expression of neuropathy after many years. In particular, we found a relationship between low Kitt value in the past and worsened NCS data in the current study, even in patients with good glycaemic control and mean HbA1c <7% over the past 6 years. Therefore, past insulin resis-tance affects the onset of neuropathy many years later, even if glycaemic control is well managed.
The group III patients already had neuropathy in the previ-ous study. We found that the changes in SNAP in this group between 2006 and 2012 showed a positive correlation with past insulin resistance after adjusting for age and height. Higher insulin resistance in the past can therefore accelerate the deterioration associated with the process of neuropathy in type 2 diabetes mellitus. A decrease in SNAP, compared with past NCS data indicates the progression of neuropathy, even in mildly symptomatic or asymptomatic patients.
The current study has several limitations. First, as in our ropathic changes.17 Follow-up NCS should therefore be
considered in patients with diabetes mellitus in the absence of overt symptoms of neuropathy.11 Such studies also allow
physicians to determine the extent of deterioration due to diabetic neuropathy in patients with very mild symptoms. In this study, we investigated the risk factors for the devel-opment of diabetic neuropathy in type 2 diabetes mellitus over a 6-year follow-up period. Our earlier findings showed that insulin resistance and lower HDL cholesterol are asso-ciated with diabetic neuropathy. Here, we investigated the relationship between insulin resistance in the past and the later occurrence of neuropathy.
Over the past decade, mitochondrial dysfunction has been shown to play a key role in the pathologic features of insulin resistance.18 Mitochondrial fission in both cell bodies and
neurites increase during hyperglycaemic injury in dorsal root ganglia and axons.19 Excessive mitochondrial fission may
re-sult in dysregulation of energy production, activation of cas-pase-3, and subsequent dorsal root ganglion neuron inju-ry.19,20 Similar to other peripheral tissues, the expression of
the insulin receptor protein on ganglion cells is altered by hy-perglycaemia and consequent activation of downstream insu-lin receptor signalinsu-ling contributes to the onset of diabetic neuropathy in animal models.20 In addition, hyperlipidaemia
causes an increase in oxidized lipoproteins, and lipoprotein receptors on the dorsal root ganglia cause oxidative stress, which induces neuropathy.21 Several studies have provided
strong evidence that dyslipidaemia contributes to macro and microvascular complications, and lipid control is a new
ther-Fig. 3. Insulin resistance in 2006 showed a positive correlation (r=0.629, p=0.001) with changes in sural SNAP in group III between 2006 and 2012. r, Pearson’s correlation coefficient; SNAP, sensory nerve action potential.
Insulin resistance (1/Kitt value) -5
0 5 10 15
Ch
an
ge
s o
f s
ur
al
S
N
AP
(u
V)
-0.3 0.0 0.3 0.6
[image:7.595.56.282.63.271.2]5. Bril V. NIS-LL: the primary measurement scale for clinical trial endpoints in diabetic peripheral neuropathy. Eur Neurol 1999;41 Suppl 1:8-13.
6. Dyck PJ, Lais A, Karnes JL, O’Brien P, Rizza R. Fiber loss is pri-mary and multifocal in sural nerves in diabetic polyneuropathy. Ann Neurol 1986;19:425-39.
7. Said G. Diabetic neuropathy--a review. Nat Clin Pract Neurol 2007;3:331-40.
8. Karsidag S, Morali S, Sargin M, Salman S, Karsidag K, Us O. The electrophysiological findings of subclinical neuropathy in pa-tients with recently diagnosed type 1 diabetes mellitus. Diabetes Res Clin Pract 2005;67:211-9.
9. Abu-Shakra SR, Cornblath DR, Avila OL, Chaudhry V, Freimer M, Glass JD, et al. Conduction block in diabetic neuropathy. Mus-cle Nerve 1991;14:858-62.
10. Viader A, Sasaki Y, Kim S, Strickland A, Workman CS, Yang K, et al. Aberrant Schwann cell lipid metabolism linked to mitochon-drial deficits leads to axon degeneration and neuropathy. Neuron 2013;77:886-98.
11. Feldman EL, Stevens MJ, Thomas PK, Brown MB, Canal N, Greene DA. A practical two-step quantitative clinical and electro-physiological assessment for the diagnosis and staging of diabetic neuropathy. Diabetes Care 1994;17:1281-9.
12. Im S, Kim SR, Park JH, Kim YS, Park GY. Assessment of the medial dorsal cutaneous, dorsal sural, and medial plantar nerves in impaired glucose tolerance and diabetic patients with normal sural and superficial peroneal nerve responses. Diabetes Care 2012;35: 834-9.
13. Expert Committee on the Diagnosis and Classification of Diabetes Mellitus. Report of the expert committee on the diagnosis and classification of diabetes mellitus. Diabetes Care 2003;26 Suppl 1:S5-20.
14. England JD, Gronseth GS, Franklin G, Miller RG, Asbury AK, Carter GT, et al. Distal symmetric polyneuropathy: a definition for clinical research: report of the American Academy of Neurology, the American Association of Electrodiagnostic Medicine, and the American Academy of Physical Medicine and Rehabilitation. Neurology 2005;64:199-207.
15. Gelding SV, Robinson S, Lowe S, Niththyananthan R, Johnston DG. Validation of the low dose short insulin tolerance test for evaluation of insulin sensitivity. Clin Endocrinol (Oxf) 1994;40: 611-5.
16. Dyck PJ, Davies JL, Clark VM, Litchy WJ, Dyck PJ, Klein CJ, et al. Modeling chronic glycemic exposure variables as correlates and predictors of microvascular complications of diabetes. Diabe-tes Care 2006;29:2282-8.
17. Albers JW, Herman WH, Pop-Busui R, Martin CL, Cleary P, Waberski B, et al. Subclinical neuropathy among Diabetes Control and Complications Trial participants without diagnosable neurop-athy at trial completion: possible predictors of incident neuropa-thy? Diabetes Care 2007;30:2613-8.
18. Turner N, Heilbronn LK. Is mitochondrial dysfunction a cause of insulin resistance? Trends Endocrinol Metab 2008;19:324-30. 19. Kim B, McLean LL, Philip SS, Feldman EL. Hyperinsulinemia
induces insulin resistance in dorsal root ganglion neurons. Endo-crinology 2011;152:3638-47.
20. Höke A. Animal models of peripheral neuropathies. Neurothera-peutics 2012;9:262-9.
21. Vincent AM, Hayes JM, McLean LL, Vivekanandan-Giri A, Pen-nathur S, Feldman EL. Dyslipidemia-induced neuropathy in mice:
previous study, this study was conducted only on patients with type 2 diabetes mellitus. Comparison of our results with data for a normal control group would provide more comprehensive results. Second, the gender distribution of our data was not even, and there were many more males than females. Many reports have shown that males are more vulnerable to neuropathy than females;30,31 therefore, this
gender bias should be considered when interpreting the re-sults. Third, the Kitt value reflects insulin resistance, as as-sessed by a short insulin tolerance test instead of the eugly-caemic hyperinsulinaemic clamp test. In addition, we could not test the Kitt value in this follow-up study. Insulin toler-ance test must be performed in monitoring room because of unexpected low glucose level. Thus, Kitt value is not neces-sary test for common follow-up patients. We designed this study retrospectively, so that the Kitt value is not checked again. Nevertheless, the values of repeated measurements of insulin intolerance test may allow us to explain the rela-tionship between insulin resistance and diabetic neuropathy. Fourth, small number of patients could not show powerful results in statistical analysis. We added dunn’s procedure to calibrate the results of Kruskal-Wallis test.
In conclusion, insulin resistance seems to be associated with peripheral neuropathy, independent of blood glucose level, in Korean patients with type 2 diabetes mellitus, and diabetic neuropathy can be affected by previous insulin re-sistance in spite of regular glycaemic control. In addition, dyslipidaemia should be controlled in patients who have shown high insulin resistance in the past, because HDL cho-lesterol and triglyceride levels are strongly correlated with diabetic neuropathy. Physicians should consider regular fol-low-up electrophysiologic tests in patients with type 2 dia-betes mellitus who have no neuropathic symptoms, even if they are normal on NCS.
REFERENCES
1. Bruce KD, Hanson MA. The developmental origins, mechanisms, and implications of metabolic syndrome. J Nutr 2010;140:648-52. 2. Petersen KF, Shulman GI. Etiology of insulin resistance. Am J
Med 2006;119(5 Suppl 1):S10-6.
3. Kim DJ, Song KE, Park JW, Cho HK, Lee KW, Huh KB. Clinical characteristics of Korean type 2 diabetic patients in 2005. Diabetes Res Clin Pract 2007;77 Suppl 1:S252-7.
Nauck M, et al. Management of hyperglycaemia in type 2 diabetes: a patient-centered approach. Position statement of the American Diabetes Association (ADA) and the European Association for the Study of Diabetes (EASD). Diabetologia 2012;55:1577-96. 27. American Diabetes Association. Standards of medical care in
dia-betes--2012. Diabetes Care 2012;35 Suppl 1:S11-63.
28. El-Salem K, Ammari F, Khader Y, Dhaimat O. Elevated glycosyl-ated hemoglobin is associglycosyl-ated with subclinical neuropathy in neu-rologically asymptomatic diabetic patients: a prospective study. J Clin Neurophysiol 2009;26:50-3.
29. Smith AG. Impaired glucose tolerance and metabolic syndrome in idiopathic neuropathy. J Peripher Nerv Syst 2012;17 Suppl 2:15-21. 30. Aaberg ML, Burch DM, Hud ZR, Zacharias MP. Gender differ-ences in the onset of diabetic neuropathy. J Diabetes Complica-tions 2008;22:83-7.
31. Booya F, Bandarian F, Larijani B, Pajouhi M, Nooraei M, Lotfi J. Potential risk factors for diabetic neuropathy: a case control study. BMC Neurol 2005;5:24.
the role of oxLDL/LOX-1. Diabetes 2009;58:2376-85.
22. Vincent AM, Hinder LM, Pop-Busui R, Feldman EL. Hyperlipid-emia: a new therapeutic target for diabetic neuropathy. J Peripher Nerv Syst 2009;14:257-67.
23. Fruchart JC, Sacks F, Hermans MP, Assmann G, Brown WV, Ces-ka R, et al. The Residual Risk Reduction Initiative: a call to action to reduce residual vascular risk in patients with dyslipidemia. Am J Cardiol 2008;102(10 Suppl):1K-34K.
24. Woo V, Shestakova MV, Ørskov C, Ceriello A. Targets and tactics: the relative importance of HbA, fasting and postprandial plasma glucose levels to glycaemic control in type 2 diabetes. Int J Clin Pract 2008;62:1935-42.
25. Nathan DM, Buse JB, Davidson MB, Ferrannini E, Holman RR, Sherwin R, et al. Medical management of hyperglycemia in type 2 diabetes: a consensus algorithm for the initiation and adjustment of therapy: a consensus statement of the American Diabetes Asso-ciation and the European AssoAsso-ciation for the Study of Diabetes. Diabetes Care 2009;32:193-203.