© Associated Asia Research Foundation (AARF)
A Monthly Double-Blind Peer Reviewed Refereed Open Access International e-Journal - Included in the International Serial Directories. Page | 116
THE IMPACT OF JAPAN-INDONESIA EPA ON JAPAN’S DIRECT
INVESTMENT IN INDONESIA AND INDONESIA’S EXPORT IN
AUTOMOTIVE AND AUTOMOTIVE PARTS INDUSTRIES
Dr. Hendry Litou
Puratama Godo Kaisha, Japan
ABSTRACT
Ten years have passed since Japan and Indonesia signed the Japan-Indonesia Economic
Partnership Agreement (JIEPA). This paper reports the findings of a study examining the
impact of JIEPA on Japanese outward FDI position in Indonesia and Indonesia’s export
value in automotive and automotive parts industries. Data used in this study is limited to the
available statistical data from year 2005 to year 2016. The export values examined in this
paper are limited to the export values of HS 8703, HS 8704, HS 8708, HS 8711, and HS 8714.
Specific export target countries examined in this paper are limited to Japan, and the 5 major
ASEAN countries. The results show the significant impact of JIEPA on the Japanese
investment in Indonesia and Indonesia’s export in automotive and automotive parts
industries, but with some exceptions.
Keywords:EPA, FDI, international trade, automotive and automotive parts industries
1. Introduction
With more than 250 million people earning on average more than US$ 3,900 per year,
Indonesia is a huge market. Japan and Indonesia have signed economic partnership
agreement (EPA) in August 2007. The scope of Japan-Indonesia EPA (JIEPA) is very wide.
In the previous work, the author has analysed the Japan-Indonesia FTA coverage rate in year
International Research Journal of Management and Commerce
ISSN: (2348-9766) Impact Factor- 5.564, Volume 4, Issue 10, October 2017
Website- www.aarf.asia, Email : editor@aarf.asia , editoraarf@gmail.com
© Associated Asia Research Foundation (AARF)
A Monthly Double-Blind Peer Reviewed Refereed Open Access International e-Journal - Included in the International Serial Directories. Page | 117
2014, where the results show that in the case of bilateral trade matter, JIEPA benefits Japan
more than Indonesia [1].
On the other hand, JIEPA has provided room to smoothen Japanese direct investment
in Indonesia. In year 2016, Japan is Indonesia’s second biggest investor. As shown in Table 1,
at the end of year 2016, Japanese outward foreign direct investment (FDI) position in
Indonesia has reached more than ¥ 3.1 trillion, and Indonesia ranks 11th as Japan’s outward direct investment target countries.
FDI and export volume are highly correlated in developing Asia [2]. One of the
motives behind Japanese outward FDI in Asia is to set up an export base [3]. In other words,
[image:2.595.58.551.351.680.2]if JIEPA contributes to the increase of Japanese outward FDI in Indonesia, it will also contribute to the increase of Indonesia’s export value.
Table 1: Japan’s Outward Direct Investment Position
(Top 10 Target Countries+Indonesia, Year 2012-2016)
(in hundred million JPY)
Source: Bank of Japan (processed)
In this study, the author aims to examine the impact of the JIEPA on Japanese outward FDI position in Indonesia and Indonesia’s export in automotive and automotive parts
industries. Automotive and automotive parts industries are chosen in this study since Rank Target Countries 2012 2013 2014 2015 2016 (%)
2016
Change (%)
16-15
WORLD 898,128 1,177,265 1,389,780 1,480,664 1,536,091 100 3.7
1 United States of America
247,332 349,237 453,150 498,077 522,728 34.0 4.9
2 England 46,574 71,379 89,125 103,815 133,951 8.7 29.0
3 China 80,463 103,402 124,458 129,629 126,468 8.2 -2.4
4 Netherlands 81,524 101,631 112,401 120,276 111,710 7.3 -7.1
5 Australia 52,952 57,018 73,170 80,648 76,842 5.0 -4.7
6 Thailand 30,247 46,975 61,784 60,274 62,725 4.1 4.1
7 Singapore 31,130 38,512 53,753 58,993 46,433 3.0 -21.3
8 Republic of Korea 22,093 31,453 38,172 37,872 37,421 2.4 -1.2
9 Cayman Islands 51,607 50,948 15,201 18,508 34,994 2.3 89.1
10 Hongkong 15,868 20,884 26,820 28,809 32,237 2.1 11.9
© Associated Asia Research Foundation (AARF)
A Monthly Double-Blind Peer Reviewed Refereed Open Access International e-Journal - Included in the International Serial Directories. Page | 118
Japanese brands control more than 90% of car market in Indonesia. So it can be assumed that Indonesia’s export value in automotive and automotive parts industries may well be related to
Japanese manufacturers. To limit the scope of this study, the author uses available statistical
data from year 2005 to year 2016. Year 2005 is the year when Japan and Indonesia started
their EPA negotiation meeting. Specific export target countries examined in this paper are
limited to Japan, and the 5 major ASEAN countries, which are Malaysia, Philippines,
Singapore, Thailand, and Vietnam.
Previous work that examined the impact of Japan’s EPA on automotive industry’s
trade in Indonesia, Malaysia, and Thailand, only examined data from year 2000 to year 2008
[4]. However, though signed in August 2007, JIEPA came into effect in July 2008, so the
previous work was not able to see the impact of JIEPA on the automotive industry in
Indonesia.
The structure of this paper is as follows. Section 2 shows data of the Japanese outward
FDI position in Indonesia in all industries and in automotive and automotive parts industries, and data of Indonesia’s export value in automotive and automotive parts industries from year
2005 to year 2016. Section 3 analyzes the impact of JIEPA on Japanese outward FDI position in Indonesia and Indonesia’s export value in automotive and automotive parts
industries. Section 4 states the conclusions of this paper.
2. Japanese Outward FDI Position in Indonesia and Indonesia’s Export Value in
Automotive and Automotive Parts Industries
2.1 Japanese Outward FDI to Indonesia
Figure 1 shows the Japanese outward FDI position in Indonesia from the end of year
2005 to the end of year 2016. As shown in Figure 1, the Japanese outward FDI position in
Indonesia at the end of year 2008 showed a decline from the previous year. This is due to the
Lehman Shock in September 2008 [5]. However, since year 2009, the Japanese direct
investment in Indonesia has kept increasing. As shown in Table 2, Japanese outward FDI
position in all industries in Indonesia at the end of year 2016 has grown 246.5% from year
2005.
On the other hand, as also shown in Figure 1, transportation equipment industry has
become the top investment target since year 2006. Investment in the transportation equipment
© Associated Asia Research Foundation (AARF)
A Monthly Double-Blind Peer Reviewed Refereed Open Access International e-Journal - Included in the International Serial Directories. Page | 119
and automotive parts industries at the end of year 2016 shows a 309.1% rise from the end of
year 2005. It has reached more than ¥ 857 billion, or 27,4% of the total amount of the
Japanese outward FDI position in Indonesia at the end of year 2016.
[image:4.595.74.528.135.415.2]Source: Bank of Japan (processed)
Figure 1: Japanese Outward FDI Position in Indonesia
(End of Year 2005 to End of Year 2016)
[image:4.595.79.519.533.675.2](in hundred million JPY)
Table 2: Japan’s Outward FDI Position in Transportation Equipment Industry of Indonesia
Industry
Year 2005 (in
100 million
JPY)
Year 2015 (in
100 million
JPY)
Year 2016 (in
100 million
JPY)
Change
(2016-2005)
(%)
Change
(2016-2015)
(%)
All 9,023 29,419 31,264 246.5 6.3
Transportation
equipment 2,095 8,091 8,572 309.1 5.9
2.2 Indonesia’s Export Value in Automotive and Automotive Parts Industries
© Associated Asia Research Foundation (AARF)
A Monthly Double-Blind Peer Reviewed Refereed Open Access International e-Journal - Included in the International Serial Directories. Page | 120
rolling stock, and parts and accessories thereof) products from the top 10 exporters and
ASEAN countries to the world. Indonesia ranks 27th in the world with export value that has reached more than US$ 5.8 billion in year 2016, a 8.3% rise from the previous year. Since
year 2013, Indonesia ranks 2nd as the ASEAN’s largest exporters of HS 87 products.
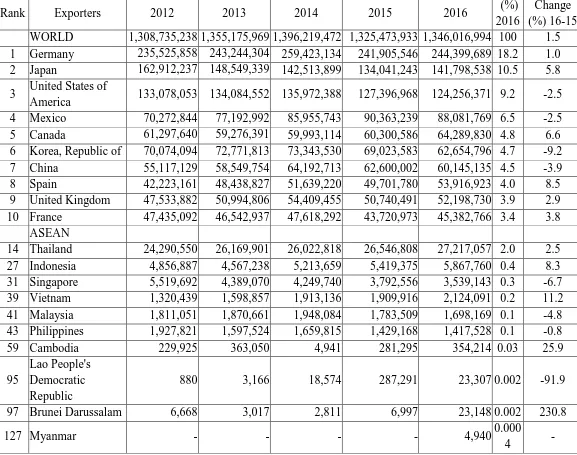
Table 3: Export Value of HS 87
(Top 10 Exporters + ASEAN Countries, Year 2012-2016)
(in thousand USD)
Source: International Trade Center (online)
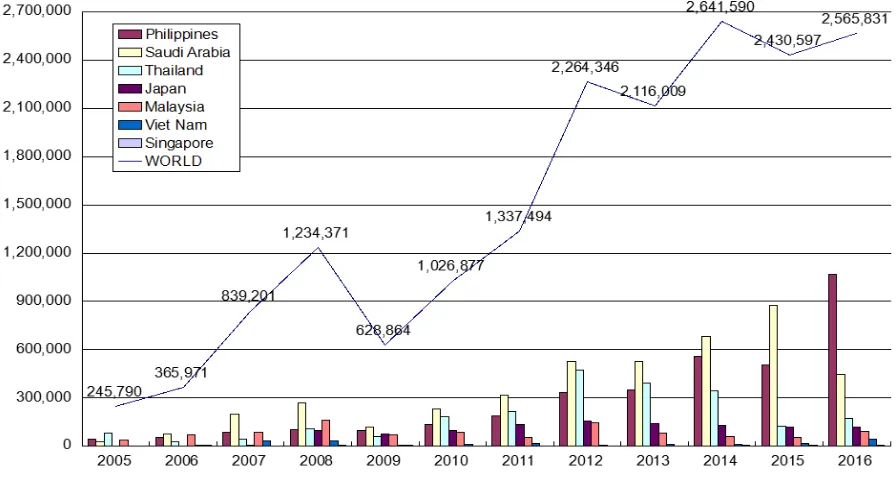
Figure 2 shows Indonesia’s export value of HS 87 products from year 2005 to year
2016. Export value of HS 87 products from Indonesia to the world in year 2016 is
US$ 5.86776 billion, a 352% rise from year 2005, and a 8.27% rise from the previous year. Rank Exporters 2012 2013 2014 2015 2016 (%)
2016
Change (%) 16-15 WORLD 1,308,735,238 1,355,175,969 1,396,219,472 1,325,473,933 1,346,016,994 100 1.5 1 Germany 235,525,858 243,244,304 259,423,134 241,905,546 244,399,689 18.2 1.0 2 Japan 162,912,237 148,549,339 142,513,899 134,041,243 141,798,538 10.5 5.8
3 United States of
America 133,078,053 134,084,552 135,972,388 127,396,968 124,256,371 9.2 -2.5 4 Mexico 70,272,844 77,192,992 85,955,743 90,363,239 88,081,769 6.5 -2.5 5 Canada 61,297,640 59,276,391 59,993,114 60,300,586 64,289,830 4.8 6.6 6 Korea, Republic of 70,074,094 72,771,813 73,343,530 69,023,583 62,654,796 4.7 -9.2 7 China 55,117,129 58,549,754 64,192,713 62,600,002 60,145,135 4.5 -3.9 8 Spain 42,223,161 48,438,827 51,639,220 49,701,780 53,916,923 4.0 8.5 9 United Kingdom 47,533,882 50,994,806 54,409,455 50,740,491 52,198,730 3.9 2.9 10 France 47,435,092 46,542,937 47,618,292 43,720,973 45,382,766 3.4 3.8
ASEAN
14 Thailand 24,290,550 26,169,901 26,022,818 26,546,808 27,217,057 2.0 2.5 27 Indonesia 4,856,887 4,567,238 5,213,659 5,419,375 5,867,760 0.4 8.3 31 Singapore 5,519,692 4,389,070 4,249,740 3,792,556 3,539,143 0.3 -6.7 39 Vietnam 1,320,439 1,598,857 1,913,136 1,909,916 2,124,091 0.2 11.2 41 Malaysia 1,811,051 1,870,661 1,948,084 1,783,509 1,698,169 0.1 -4.8 43 Philippines 1,927,821 1,597,524 1,659,815 1,429,168 1,417,528 0.1 -0.8 59 Cambodia 229,925 363,050 4,941 281,295 354,214 0.03 25.9
95
Lao People's Democratic Republic
880 3,166 18,574 287,291 23,307 0.002 -91.9
97 Brunei Darussalam 6,668 3,017 2,811 6,997 23,148 0.002 230.8
127 Myanmar - - - - 4,940 0.000
[image:5.595.10.587.199.654.2]© Associated Asia Research Foundation (AARF)
A Monthly Double-Blind Peer Reviewed Refereed Open Access International e-Journal - Included in the International Serial Directories. Page | 121
The total export value of the following 5 products accounts for more than 96% of the overall Indonesia’s export value of HS 87 products in year 2016: (1) HS 8703 (Motor cars
and other motor vehicles principally designed for the transport of persons, incl. station
wagons and racing cars (excluding motor vehicles of heading 8702), export value in year
2016: more than US$ 2.56 billion; (2) HS 8704 (Motor vehicles for the transport of goods,
incl. chassis with engine and cab), export value in year 2016: US$ 121,2 million; (3) HS 8708
(Parts and accessories for tractors, motor vehicles for the transport of ten or more persons,
motor cars and other motor vehicles principally designed for the transport of persons, motor
vehicles for the transport of goods and special purpose motor vehicles of heading 8701 to
8705, n.e.s.), export value in year 2016: more than US$ 1.98 billion; (4) HS 8711
(Motorcycles, incl. mopeds, and cycles fitted with an auxiliary motor, with or without
side-cars; side-cars), export value in year 2016: US$ 468 million; (5) HS 8714 (Parts and
accessories for motorcycles and bicycles and for carriages for disabled persons, n.e.s.), export value in year 2016: US$ 500.85 million. The Indonesia’s export values examined in this
study are limited to the export values of the above 5 HS-4 digit level products.
© Associated Asia Research Foundation (AARF)
A Monthly Double-Blind Peer Reviewed Refereed Open Access International e-Journal - Included in the International Serial Directories. Page | 122
Figure 2: Indonesia’s Export Value of HS 87 Products
(Year 2005 to Year 2016)
(in thousand USD)
Figure 3 shows the export values of HS 8703 products from Indonesia to the world,
the 5 main export target countries, and other major ASEAN countries from year 2005 to year
2016. As shown in Table 4, the export value of HS 8703 products from Indonesia to the
world in year 2016 is US$ 2.5658 billion, a 943.9% rise from year 2005, and a 5.6% rise
from the previous year. Japan ranks 4th as Indonesia’s main export target of HS 8703 products. The export value of HS 8703 products from Indonesia to Japan in year 2016 is
US$ 115,8 million, a 7,971.4% rise from year 2005, but a 0.9% decline from the previous
year.
[image:7.595.73.521.278.517.2]Source: International Trade Center (processed)
Figure 3: Indonesia’s Export Value of HS 8703 Products
© Associated Asia Research Foundation (AARF)
[image:8.595.82.531.59.380.2]A Monthly Double-Blind Peer Reviewed Refereed Open Access International e-Journal - Included in the International Serial Directories. Page | 123
Table 4: Export of HS 8703 Products from Indonesia
(in thousand USD)
Rank Exporters 2005 2015 2016 % in 2016
Change
(2016-2005) (%)
Change
(2016-2015) (%)
WORLD 245,790 2,430,597 2,565,831 100 943.9 5.6
1 Philippines 42,730 503,857 1,071,193 41.7 2,406.9 112.6
2 Saudi Arabia 29,220 873,467 447,870 17.5 1,432.8 -48.7
3 Thailand 79,308 122,745 174,255 6.8 119.7 42.0
4 Japan 1,435 116,934 115,824 4.5 7,971.4 -0.9
5 Malaysia 40,288 54,234 93,390 3.6 131.8 72.2
Other Major
ASEAN
Countries
9 Viet Nam 2,275 17,756 45,712 1.8 1,909.3 157.4
26 Singapore 2,106 4,432 5,889 0.2 179.6 32.9
Source: International Trade Center (processed)
As shown in Table 4, Philippines ranks 1st as Indonesia’s main export target of HS 8703 products in year 2016. The export value of HS 8703 products from Indonesia to
Philippines in year 2016 is US$ 1.07 billion, a 2,406.9% rise from year 2005, and a 112.6%
rise from the previous year. It covers 41.7% of the total export value of HS 8703 products
from Indonesia to the world in year 2016.
Figure 4 shows the export value of HS 8704 products from Indonesia to the world, the
5 main export target countries and other major ASEAN countries from year 2005 to year
2016. As shown in Table 5, the export value of HS 8704 from Indonesia to the world in year
2016 is US$ 121.21 million, a 1,240.1% rise from year 2005, but a 24.8% decline from the
previous year. Japan ranks 1st as Indonesia’s main export target of HS 8704 products. The export value of HS 8704 products from Indonesia to Japan in year 2016 is US$ 34.08 million,
a 7,260.9% rise from year 2005, and a 0.8% rise from the previous year. It covers 28.1% of
© Associated Asia Research Foundation (AARF)
A Monthly Double-Blind Peer Reviewed Refereed Open Access International e-Journal - Included in the International Serial Directories. Page | 124
Source: International Trade Center (processed)
Figure 4: Indonesia’s Export Value of HS 8704 Products
(Year 2005 to Year 2016)
(in thousand USD)
As shown in Table 5, the export value of HS 8704 products from Indonesia to
Philippines in year 2016 is US$ 20.6 million, a 87.1% rise from the previous year, and
accounts for 17% of the total export value of HS 8704 products from Indonesia to the world in year 2016. Philippines was not Indonesia’s HS 8704 products export target country in year
2005. The export value of HS 8704 products from Indonesia to Viet Nam in year 2016 is
US$ 19.8 million, a 3,587.6% rise from year 2005, and 71.2% rise from the previous year. It
[image:9.595.73.524.38.266.2]accounts for 16.3% of the total export value of HS 8704 products from Indonesia in year 2016. In year 2016, Thailand was not Indonesia’s HS 8704 products export target country
Table 5: Export of HS 8704 Products from Indonesia
(in thousand USD)
Rank Exporters 2005 2015 2016 % in 2016
Change
(2016-2005)
(%)
Change
(2016-2015)
(%)
WORLD 9,045 161,218 121,210 100 1,240.1 -24.8
1 Japan 463 33,797 34,081 28.1 7,260.9 0.8
© Associated Asia Research Foundation (AARF)
A Monthly Double-Blind Peer Reviewed Refereed Open Access International e-Journal - Included in the International Serial Directories. Page | 125
3 Viet Nam 537 11,567 19,803 16.3 3,587.7 71.2
4 United Arab
Emirates 0 20,680 15,953 13.2 - -22.9
5 Timor-Leste 168 7,766 7,654 6.3 4,456 -1.4
Other Major
ASEAN Countries
6 Malaysia 965 5,127 6,009 5 522.7 17.2
7 Singapore 2,162 21,052 4,056 3.3 87.6 -80.7
- Thailand 0 1,019 0 0 0 -100.0
[image:10.595.63.530.36.233.2]Source: International Trade Center (processed)
Figure 5 shows the export value of HS 8708 products from Indonesia to the world, the
5 main export target countries and other major ASEAN countries from year 2005 to year
2016. As shown in Table 6, the export value of HS 8708 products from Indonesia to the
world in year 2016 is US$ 1.98 billion, a 161.4% rise from year 2005, and a 8% rise from the
previous year. Japan ranks 3rd in year 2016. The export value of HS 8708 products from Indonesia to Japan in year 2016 is US$ 255.8 million, a 57.1% rise from year 2005, and a
2.1% rise from the previous year. It covers 12.9% of the total export value of HS 8708
products from Indonesia to the world in year 2016. Thailand ranks 1st in year 2016. The export value of HS 8708 products from Indonesia to Thailand in year 2016 is US$ 506,489
million, a 514.7% rise from year 2005, and a 15.7% rise from the previous year. The export
value to Thailand accounts for 25.6% of the total export value of HS 8708 products from
Indonesia to the world in year 2016. Malaysia ranks 2nd in year 2016, and the export value to Malaysia accounts for 14% of the total export value of HS 8708 products from Indonesia in
year 2016. The export value to Malaysia in year 2016 is US$ 277.9 million, a 61.1% rise
from year 2005, but a 4.8% decline from the previous year. The export value to Singapore in
year 2016 is US$ 7.28 million, a 35.2% decline from year 2005, and a 25.2% decline from
© Associated Asia Research Foundation (AARF)
A Monthly Double-Blind Peer Reviewed Refereed Open Access International e-Journal - Included in the International Serial Directories. Page | 126
[image:11.595.73.522.44.274.2]Source: International Trade Center (processed)
Figure 5: Indonesia’s Export Value of HS 8708 Products
(Year 2005 to Year 2016)
(in thousand USD)
Table 6: Export of HS 8708 Products from Indonesia
(in thousand USD)
Rank Exporters 2005 2015 2016 % in 2016
Change
(2016-2005)
(%)
Change
(2016-2015)
(%)
WORLD 757,862 1,834,442 1,981,046 100 161.4 8.0
1 Thailand 82,398 437,871 506,489 25.6 514.7 15.7
2 Malaysia 172,541 292,110 277,946 14 61.1 -4.8
3 Japan 162,815 250,674 255,848 12.9 57.1 2.1
4 Mexico 101 142,025 156,977 7.9 155,322.8 10.5
5 Brazil 1,063 143,683 114,036 5.8 10,627.8 -20.6
Other Major
ASEAN Countries
6 Philippines 40,715 87,824 101,256 5.1 148.7 15.3
8 Viet Nam 18,348 59,787 74,991 3.8 308.7 25.4
21 Singapore 11,245 9,729 7,282 0.4 -35.2 -25.2
© Associated Asia Research Foundation (AARF)
A Monthly Double-Blind Peer Reviewed Refereed Open Access International e-Journal - Included in the International Serial Directories. Page | 127
Figure 6 shows the export value of HS 8711 products from Indonesia to the world, the
5 main export target countries and other major ASEAN countries from year 2005 to year
2016. As shown in Table 7, the export value of HS 8711 products from Indonesia to the
world in year 2016 is US$ 468.06 million, a 1,540.9% rise from year 2005, and a 16.5% rise
from the previous year. Japan ranks 3rd as Indonesia’s export target of HS 8711 products. The export value of HS 8711 products from Indonesia to Japan in year 2016 is US$ 39.5 million,
a 3,592.6% rise from year 2005, but a 9% decline from the previous year.
[image:12.595.72.522.188.381.2]Source: International Trade Center (processed)
Figure 6: Indonesia’s Export Value of HS 8711 Products
(Year 2005 to Year 2016)
(in thousand USD)
Table 7: Export of HS 8711 Products from Indonesia
(in thousand USD)
Rank Exporters 2005 2015 2016 % in 2016 Change (2016-2005) (%)
Change
(2016-2015) (%)
WORLD 28,525 401,790 468,064 100 1,540.9 16.5
1 Philippines 7,443 82,438 176,319 37.7 2,268.9 113.9
2 Thailand 139 87,030 70,660 15.1 50,734.5 -18.8
3 Japan 1,071 43,443 39,548 8.4 3,592.6 -9.0
4 Viet Nam 1,555 12,114 30,169 6.4 1,840.1 149.0
5 Turkey 0 6,275 14,701 3.1 - 134.3
Other Major ASEAN
© Associated Asia Research Foundation (AARF)
A Monthly Double-Blind Peer Reviewed Refereed Open Access International e-Journal - Included in the International Serial Directories. Page | 128
19 Singapore 57 1,278 3,637 0.8 6,280.7 184.6
39 Malaysia 163 14,167 471 0.1 189.0 -96.7
Source: International Trade Center (processed)
As shown in Table 7, Philippines ranks 1st in year 2016. The export value of HS 8711 products from Indonesia to Philippines in year 2016 is US$ 176.3 million, a 2,268.9% rise
from year 2005, and a 113.9% rise from the previous year. It covers 37.7% of the total export
value of HS 8711 products from Indonesia to the world in year 2016. Thailand ranks 2nd in year 2016, and the export value to Thailand accounts for 15.1% of the total export value of
HS 8711 products from Indonesia to the world in year 2016. The export value of HS 8711
products from Indonesia to Thailand in year 2016 is US$ 70.66 million, a 50,374.5% rise
from year 2005, but a 18.8% decline from the previous year. The export value to Viet Nam in
year 2016 is US$ 30.169 million, a 1,840.1% rise from year 2005, and a 149% rise from the
previous year. The export value to Singapore in year 2016 is US$ 3.6 million, a 6,289.7% rise
from year 2005, and a 184.6% rise from the previous year. The export value to Malaysia in
year 2016 is US$ 0.47 million, a 189% rise from year 2005, but a 96.7% decline from the
previous year.
Figure 7 shows the export value of HS 8714 products from Indonesia to the world, the
5 main export target countries and other major ASEAN countries from year 2005 to year
2016. As shown in Table 8, the export value of HS 8714 products from Indonesia to the
world in year 2016 is US$ 500.85 million, a 147.5% rise from year 2005, and a 17.4% rise
from the previous year. Japan ranks 3rd in year 2016. The export value of HS 8714 products from Indonesia to Japan in year 2016 is US$ 40.5 million, a 27.6% rise from year 2005, and a
24.5% rise from the previous year. The export value to Japan accounts for 8.1% of the total
© Associated Asia Research Foundation (AARF)
A Monthly Double-Blind Peer Reviewed Refereed Open Access International e-Journal - Included in the International Serial Directories. Page | 129
[image:14.595.77.523.39.301.2]Source: International Trade Center (processed)
Figure 7: Indonesia’s Export Value of HS 8714 Products
(Year 2005 to Year 2016)
(in thousand USD)
As shown in Table 8, Singapore ranks 1st in year 2016, and the export value to Singapore accounts for 28.8% of the total export value of HS 8714 products from Indonesia
to the world in year 2016. The export value to Singapore in year 2016 is US$ 144 million, a
123.3% rise from year 2005, but 15.9% decline from the previous year. The export values of
HS 8714 products from Indonesia to Philippines, Malaysia, and Viet Nam in year 2016 show
a significant rise from year 2005, however export value from Indonesia to Thailand in year
2016 shows a 10.3% decline from year 2005.
Table 8: Export of HS 8714 Products from Indonesia
(in thousand USD)
Rank Exporters 2005 2015 2016 % in 2016
Change
(2016-2005) (%)
Change
(2016-2015) (%)
WORLD 202,341 426,587 500,852 100 147.5 17.4
1 Singapore 64,487 171,179 144,028 28.8 123.3 -15.9
2 Philippines 6,374 59,339 98,431 19.7 1,444.3 65.9
[image:14.595.78.528.565.757.2]© Associated Asia Research Foundation (AARF)
A Monthly Double-Blind Peer Reviewed Refereed Open Access International e-Journal - Included in the International Serial Directories. Page | 130
4 Japan 31,739 32,541 40,509 8.1 27.6 24.5
5 Thailand 41,155 29,210 36,935 7.4 -10.3 26.4
Other Major
ASEAN Country
6 Viet Nam 12,689 23,531 27,720 5.5 118.5 17.8
Source: International Trade Center (processed)
3. The Impact of JIEPA on Japanese Outward FDI Position in Indonesia and
Indonesia’s Export Value in Automotive and Automotive Parts Industries
3.1 The Analysis of the Impact of JIEPA on Japanese Outward FDI Position in All
Industries and the Automotive and Automotive Parts Industries in Indonesia
Table 9 shows the growth rates of the Japanese outward FDI position in Indonesia
from the end of year 2006 to the end of year 2016. When the JIEPA came into effect in year
2008, the growth rate of the Japanese outward FDI position in all industries in Indonesia at
the end of year 2008 shows a 18.1% decline from the end of the previous year, and the FDI
position in the transportation equipment industry shows a 14.5% decline from the previous
year. As mentioned in the section 2.1, it was due to the Lehman Shock. From the end of year
2009 to the end of year 2014, the growth rates of the Japanese outward FDI position in all
industries in Indonesia are above 10%. The growth rate for the transportation equipment
industry was only 5.6% in year 2010, but it reached 33.9% in year 2013. As shown in Table 2,
the Japanese outward FDI position in all industries in Indonesia at the end of year 2016
shows a 246.5% rise from the end of year 2005, and the Japanese outward FDI position in the
transportation equipment industry in Indonesia at the end of year 2016 shows a 309.1% rise
from the end of year 2005. So it is obvious that the impact of the JIEPA on the growth of the
Japanese outward FDI position in all industries and the automotive and automotive parts
industries in Indonesia is significant.
However, the growth rates of the Japanese outward FDI position in all industries and
the transportation equipment industry in Indonesia were lower than 10% since year 2015. So,
it also can be said that the impact of JIEPA on the Japanese outward FDI position in all
industries and the automotive and automotive parts industries in Indonesia has become
[image:15.595.84.531.36.142.2]© Associated Asia Research Foundation (AARF)
[image:16.595.80.530.82.277.2]A Monthly Double-Blind Peer Reviewed Refereed Open Access International e-Journal - Included in the International Serial Directories. Page | 131
Table 9: Growth Rates of the Japanese Outward FDI Position in Indonesia for All Industries
and the Transportation Equipment Industry
3.2 The Analysis of the Impact of JIEPA on the Indonesia’s Export Value in Automotive
and Automotive Parts Industries
As shown in Figure 2, the export value of HS 87 products from Indonesia to the world
in year 2016 shows a significant increase compared to the export value in year 2005. As
shown in Table 4 to Table 8, the export values of HS 8703, HS 8704, HS 8708, HS 8711, and
HS 8714 products from Indonesia to the world in year 2016 show a significant increase
compared to the export values in year 2005. As shown in Figure 5 and Figure 6, the export
values of HS 8708 and HS 8711 products are increasing in the recent 3 consecutive years. As
shown in Figure 3 and Figure 8, the export values of HS 8703 and HS 8714 products do not
increase steadily in the recent 5 years. On the other hand, as shown in Figure 4, the export
[image:16.595.77.531.82.276.2]values of HS 8704 products are declining in the recent 3 years.
Table 10 shows the growth rates of the export values of automotive parts and products
from Indonesia to Japan. The export values of HS 8703, HS 8704, and HS 8711 products
from Indonesia to Japan in year 2016 show a significant increase compared to the export
values in year 2005, while the export values of HS 8708 and HS 8714 products from
Indonesia to Japan in year 2016 do not show a significant increase compared to the export
values in year 2005. On the other hand, the export value of HS 8703 products from Indonesia
to Japan in year 2013 shows a 12.1% decline from the previous year, and the export value has
kept declining since then. The export value of HS 8704 products from Indonesia to Japan in
year 2014 shows a 9.4% decline from the previous year, and a 13.3% decline in year 2015
from the previous year. The export value of HS 8711 products from Indonesia to Japan in Industry
Chang
e
(2006-2005)
Chang
e
(2007-2006)
Chang
e
(2008-2007)
Chang
e
(2009-2008)
Chang
e
(2010-2009)
Chang
e
(2011-2010)
Chang
e
(2012-2011)
Chang
e
(2013-2012)
Chang
e
(2014-2013)
Chang
e
(2015-2014)
Chang
e
(2016-2015)
All -1.7% 6.1% -18.1% 13.6% 11.4% 26.0% 29.6% 31.1% 36.3% 3.5% 6.3%
Transpo
rtation
Equipm
© Associated Asia Research Foundation (AARF)
A Monthly Double-Blind Peer Reviewed Refereed Open Access International e-Journal - Included in the International Serial Directories. Page | 132
year 2014 shows a 752.1% rise from the previous year, and a 328.8% rise in year 2015 from
[image:17.595.41.566.109.281.2]the previous year. However, in year 2016, it shows a 9% decline from the previous year.
Table 10: Growth Rates of the Export Values from Indonesia to Japan
Table 11 shows the growth rates of the export values of automotive parts and products
from Indonesia to Malaysia. The export values of HS 8704, and HS 8714 products from
Indonesia to Malaysia in year 2016 show a significant increase compared to the export values
in year 2005, however, the export values are increasing and decreasing in the recent 10 years.
The export value of HS 8703 products in year 2016 shows a 72.2% rise from the previous
year, but for the previous 3 consecutive years, the export values decreased by 43.1%, 27.4%,
and 10.1% respectively. The export value of HS 8708 products in year 2016 does not show a
significant increase compared to the export value in year 2005. The export value of HS 8711
[image:17.595.33.576.524.697.2]in year 2016 shows a 96.7% decline from the previous year.
Table 11: Growth Rates of the Export Values from Indonesia to Malaysia
Table 12 shows the growth rates of the export values of automotive parts and products HS Change (2006-2005) Change (2007-2006) Change (2008-2007) Change (2009-2008) Change (2010-2009) Change (2011-2010) Change (2012-2011) Change (2013-2012) Change (2014-2013) Change (2015-2014) Change (2016-2015) Change (2016-2005)
8703 26.3% 114.3% 2448.6% -25.4% 30.3% 42.1% 14.8% -12.1% -7.0% -8.9% -0.9% 7971.4%
8704 54.9% 278.7% 848.0% -24.8% 45.9% 36.1% 7.0% 4.7% -9.4% -13.3% 0.8% 7260.9%
8708 24.9% 13.4% 0.0% -28.0% 45.3% 3.9% 14.4% -9.8% -3.6% 0.6% 2.1% 57.1%
8711 40.7% 61.8% -48.5% -4.0% -47.8% 10.8% 97.3% -13.7% 752.1% 328.8% -9.0% 3592.6%
8714 17.9% -15.3% -20.0% -84.7% 304.1% 55.0% 29.8% 0.4% 54.7% -33.7% 24.5% 27.6%
HS Change (2006-2005) Change (2007-2006) Change (2008-2007) Change (2009-2008) Change (2010-2009) Change (2011-2010) Change (2012-2011) Change (2013-2012) Change (2014-2013) Change (2015-2014) Change (2016-2015) Change (2016-2005)
8703 79.8% 16.6% 90.8% -56.3% 18.7% -33.2% 161.1% -43.1% -27.4% -10.1% 72.2% 131.8%
8704 -39.2% 24.5% -96.0% 9341.4% 57.6% 375.0% 31.1% -50.8% 2.2% -62.0% 17.2% 522.7%
8708 -44.2% -33.5% 106.0% -12.1% 30.2% -11.0% 11.4% 22.8% 12.5% 41.4% -4.8% 61.1%
8711 -21.5% 1717.2% -40.3% 17.9% 112.6% -7.0% 833.0% -63.1% -26.8% 73.8% -96.7% 189.0%
© Associated Asia Research Foundation (AARF)
A Monthly Double-Blind Peer Reviewed Refereed Open Access International e-Journal - Included in the International Serial Directories. Page | 133
from Indonesia to Philippines. The export values of HS 8703, HS 8704, HS 8711, and HS
8714 products from Indonesia to Philippines in year 2016 show a significant increase
compared to the export values in the previous year and the export value in year 2005. The
export value of HS 8708 products in year 2016 shows a 148.7% rise from the export value in
[image:18.595.73.525.170.470.2]year 2005, and a 15.3% rise from the previous year.
Table 12: Growth Rates of the Export Values from Indonesia to Philippines
Table 13 shows the growth rates of the export values of automotive parts and products
from Indonesia to Singapore. The export value of HS 8711 products in year 2016 show a
significant increase compared to the export value in the previous year and the export value in
year 2005. The export values of HS 8703 products are increasing steadily in the past 3
consecutive years. The export value of HS 8704 products in year 2010 shows a 659.9% rise
from the previous year, however the export value in year 2016 shows a 80.7% decline from
the previous year. The export value of HS 8708 products in year 2016 shows a 35.2% decline
from the export value in year 2005. For the past 2 consecutive years, the export values of HS
8714 products decreased by 15.4% and 15.9%, respectively. HS Chang e (2006-2005) Chang e (2007-2006) Chang e (2008-2007) Chang e (2009-2008) Chang e (2010-2009) Chang e (2011-2010) Chang e (2012-2011) Chang e (2013-2012) Chang e (2014-2013) Chang e (2015-2014) Chang e (2016-2015) Chang e (2016-2005)
8703 28.9% 54.2% 21.8% -5.1% 35.2% 43.8% 75.6% 4.3% 59.7% -9.8% 112.6 %
2406.9
%
8704 - - 12.5% -100% - - -100% - -6.1% 101.3
% 87.1% -
8708
-27.6% 25.4% 67.3% 1.0% 22.2% 7.4% 24.8% 2.1% -6.1%
-10.5% 15.3% 148.7
%
8711 59.1% 38.8% 212.3 %
-54.5% 26.0% 138.9
% 38.5%
-55.6% 9.9% 73.2% 113.9
%
2268.9
%
8714 100.6 %
-50.8% -9.1% -24.1% 1391.5 % -42.8% -49.7% 137.9
% 19.7% 12.1% 65.9%
1444.3
© Associated Asia Research Foundation (AARF)
[image:19.595.73.524.57.362.2]A Monthly Double-Blind Peer Reviewed Refereed Open Access International e-Journal - Included in the International Serial Directories. Page | 134
Table 13: Growth Rates of the Export Values from Indonesia to Singapore
Table 14 shows the growth rates of the export values of automotive parts and products
from Indonesia to Thailand. The export values of HS 8708, and HS 8711 products from
Indonesia to Thailand in year 2016 show a significant increase compared to the export values
in year 2005. The export value of HS 8703 products in year 2016 shows a 42% rise from the
previous year, but for the previous 3 consecutive years, the export values decreased by 17.7%,
12.1%, and 64.3% respectively. Indonesia does not export HS 8704 products to Thailand in
year 2016. The export value of HS 8714 products in year 2016 shows a 10.3% decline from
[image:19.595.72.526.581.756.2]the export value in year 2005.
Table 14: Growth Rates of the Export Values from Indonesia to Thailand HS Chang e (2006-2005) Chang e (2007-2006) Chang e (2008-2007) Chang e (2009-2008) Chang e (2010-2009) Chang e (2011-2010) Chang e (2012-2011) Chang e (2013-2012) Chang e (2014-2013) Chang e (2015-2014) Chang e (2016-2015) Chang e (2016-2005)
8703 46.4% -51.2% 288.1 % -44.2%
-73.4% -5.1% 256.0
%
-36.8% 80.2% 32.8% 32.9% 179.6
%
8704 89.8% 72.4% -27.7% -85.1% 656.9 % 168.2
% 87.6%
-49.4% 17.0% 22.1%
-80.7% 87.6%
8708 41.8% 39.0% -18.5%
-51.3% 6.4% 51.1% -1.8%
-26.6% 20.4% -20.7% -25.2% -35.2%
8711 -84.2%
655.6
% 91.2% 812.3 % -99.2% 10477. 8% 137.3
% 1.8%
-57.7% 31.5% 184.6
%
6280.7
%
8714 20.2% 29.3% 35.2%
-42.1% 65.5% 32.2% 25.9%
-22.1% 20.2% -15.4% -15.9% 123.3 % HS Chang e (2006-2005) Chang e (2007-2006) Chang e (2008-2007) Chang e (2009-2008) Chang e (2010-2009) Chang e (2011-2010) Chang e (2012-2011) Chang e (2013-2012) Chang e (2014-2013) Chang e (2015-2014) Chang e (2016-2015) Chang e (2016-2005)
8703
-64.3% 44.3% 163.1
%
-44.8% 204.9
% 19.4% 119.9 % -17.7% -12.1%
-64.3% 42.0% 119.7
%
8704 - - - 25500 %
559.0
%
-91.1% 32.0% 414.6
© Associated Asia Research Foundation (AARF)
[image:20.595.73.525.37.168.2]A Monthly Double-Blind Peer Reviewed Refereed Open Access International e-Journal - Included in the International Serial Directories. Page | 135
Table 14 shows the growth rates of the export values of automotive parts and products
from Indonesia to Viet Nam. The export values of HS 8703, HS 8704, HS 8708, and HS 8711
products from Indonesia to Viet Nam in year 2016 show a significant increase compared to
the export values in the previous year and year 2005. The export value of HS 8714 products
in year 2016 shows a 17.8% rise from the previous year, but for the previous 4 consecutive
years, the export values decreased by 12.9%, 19.9%, 21.4%, and 18.5% respectively.
Table 15: Growth Rates of the Export Values from Indonesia to Viet Nam
3.3. Findings
The results of the analysis of the impact of JIEPA on the Japanese outward FDI position in Indonesia and Indonesia’s export values in automotive and automotive parts
industries can be summarized as follows. 8708 58.6% 24.1% 41.5% -8.9% 39.1%
-26.3% 87.3%
-21.2% 11.9% 23.6% 15.7% 514.7
%
8711 433.8 %
-82.7% 68.8% -24.5% 138.7 % -14.1% 5946.7 % -21.4% -28.0% 661.0 % -18.8% 50734. 5%
8714 -4.1%
-60.9% 5.7%
-30.5% 170.1
% 6.8% 54.5% -2.4%
-51.3% 22.0% 26.4% -10.3% HS Chang e (2006-2005) Chang e (2007-2006) Chang e (2008-2007) Chang e (2009-2008) Chang e (2010-2009) Chang e (2011-2010) Chang e (2012-2011) Chang e (2013-2012) Chang e (2014-2013) Chang e (2015-2014) Chang e (2016-2015) Chang e (2016-2005)
8703 123.7 % 571.7 % -12.1% -83.7% 166.8
% 45.7%
-73.2% 70.2% -2.6% 109.7 % 157.4 % 1909.3 %
8704 885.3 %
-99.8% -100% - -
164.2
%
-25.1% 400.5
% 58.1% 144.5
% 71.2%
3587.7
%
8708 209.6 %
-51.9% 71.0%
-32.4% 7.5% -4.1%
-20.0% 65.4% 16.5% 18.8% 25.4% 308.7
%
8711
-70.4% 5.9%
-92.4%
-94.6% 5050
% 10.7% 265.8 % 2054.7 % 104.3 % -34.0% 149.0 % 1840.1 %
8714 -18.9%
-16.8% 0.8%
-26.9% 434.3
% 56.2% -12.9% -19.9% -21.4%
-18.5% 17.8% 118.5
[image:20.595.73.524.346.641.2]© Associated Asia Research Foundation (AARF)
A Monthly Double-Blind Peer Reviewed Refereed Open Access International e-Journal - Included in the International Serial Directories. Page | 136
(1) The Japanese outward FDI position in all industries and the automotive and automotive
parts industries in Indonesia at the end of year 2016 shows a significant rise compared to
the FDI position at the end of year 2005, so it is obvious that JIEPA has a significant
impact on the Japanese outward FDI position in all industries and the automotive and
automotive parts industries in Indonesia. However, since year 2015, the impact has
become weaker.
(2) In general, it can be said that JIEPA has a significant impact on Indonesia’s export to the
world in automotive and automotive parts industries. As shown in Figure 5 and Figure 6, the impact of JIEPA on Indonesia’s export of HS 8703 and HS 8714 products to the
world is still strong. As shown in Figure 3 and Figure 7, the impact of JIEPA still can be seen on Indonesia’s export of HS 8703 and HS 8714 products to the world. However, as shown in Figure 4, it can be said that the impact of JIEPA on Indonesia’s export of HS
8704 products to the world has become weak.
(3) In general, it can be said that JIEPA has a significant impact on Indonesia’s export to
Japan in automotive and automotive parts industries. As shown in Table 10, the impact of JIEPA on Indonesia’s export of HS 8703, HS 8704, and HS 8711 products to Japan is
significant, but has been weaker in the last few years. However, it can be said that the impact of JIEPA on Indonesia’s export of HS 8708 and HS 8714 products to Japan is not
so strong.
(4) In general, it can be said that JIEPA has a significant impact on Indonesia’s export to the
5 major ASEAN countries, which are Malaysia, Philippines, Singapore, Thailand, and
Vietnam, in the automotive and automotive parts industries. Exceptions are described
below.
- The impact of JIEPA on Indonesia’s export of HS 8708 products to Malaysia is not
significant.
- The impact of JIEPA on Indonesia’s export of HS 8704 and HS 8714 products to Singapore is temporal. Furthermore, JIEPA shows no impact on Indonesia’s export of
HS 8708 products to Singapore.
- The impact of JIEPA on Indonesia’s export of HS 8703 and HS 8704 products to Thailand is temporal. Furthermore, JIEPA shows no impact on Indonesia’s export of
HS 8714 products to Thailand.
© Associated Asia Research Foundation (AARF)
A Monthly Double-Blind Peer Reviewed Refereed Open Access International e-Journal - Included in the International Serial Directories. Page | 137
temporal.
3.4 Limitations and Further Studies
The scope of this paper is very limited. It is not intended to examine the impact of Japan’s direct investment on Indonesia’s export in automotive and automotive parts industries. This paper only examines the impact of JIEPA on Japan’s direct investment in Indonesia and Indonesia’s export to Japan and other major ASEAN countries in automotive
and automotive parts industries based on the available statistical data. Furthermore, this study
does not consider any other factors that may influence the increase and the decrease of Japan’s direct investment in Indonesia and Indonesia’s export values in automotive and
automotive parts industries
Several research efforts should take place in the future, as described below:
(5)The study on the utilization Japan’s EPA with ASEAN countries by the Japanese
manufacturers in automotive and automotive parts industries.
(6)The impact of JIEPA on Japan’s direct investment in various industries in Indonesia.
(7)The impact of Japan’s direct investment in various industries in Indonesia on human
resource development and employment in Indonesia.
4. Conclusion
Conclusions are summarized by the followings.
(1) This paper describes a study that examines the impact of JIEPA on Japanese outward FDI position in Indonesia and Indonesia’s export value in automotive and automotive parts
industries.
(2) By analyzing the Japanese outward FDI position in Indonesia from the end of year 2005
to the end of year 2016, it can be concluded that JIEPA has a significant impact on the
Japanese outward FDI position in all industries and in the automotive and automotive parts
industries. However, the impact has become weaker since year 2015.
(3) By analyzing Indonesia’s export values of HS 8703, HS 8704, HS 8708, HS 8711, and HS
8714 products to the world, Japan, and the 5 major ASEAN countries from year 2005 to year 2016, it can be concluded that in general, JIEPA has a significant impact on Indonesia’s
export in automotive and automotive parts industries. However, the results also show the
© Associated Asia Research Foundation (AARF)
A Monthly Double-Blind Peer Reviewed Refereed Open Access International e-Journal - Included in the International Serial Directories. Page | 138
- The impact of JIEPA on Indonesia’s export of HS 8704 products to the world has become
weak.
- The impact of JIEPA on Indonesia’s export of HS 8703, HS 8704, and HS 8711 products to
Japan has become weaker in the last few years.
- The impact of JIEPA on Indonesia’s export of HS 8708 products to Japan and Malaysia,
and HS 8714 products to Japan is not significant.
- The impact of JIEPA on Indonesia’s export of HS 8703 products to Thailand, HS 8704
products to Singapore and Thailand, and HS 8714 products to Singapore and Viet Nam is
temporal.
- JIEPA shows no impact on Indonesia’s export of HS 8708 to Singapore, and HS 8714
products to Thailand.
REFERENCES
[1] Hendry Litou, The Analysis of the Japan-Indonesia FTA Coverage Rates in Year 2014,
International Research Journal of Marketing and Economics, 2(10), 2015, 13-25
[2] Konstantin M. Wacker, Philipp Grosskurth, and Tabea Lakemann, Foreign Direct
Investment, Terms of Trade and Quality Upgrading: What is So Special about South Asia?,
Asian Development Review, 33(1), 2016, 28-55.
[3] Shujiro Urata, Japanese Foreign Direct Investment and Its Effect on Foreign Trade in
Asia, in T. Ito and A.O. Kruger (Ed.), Trade and Protectionism, NBER-EASE Vol.2
(University of Chicago Press, 1993) 273-304.
[4] Hanny Zurina Hamzah, The Impact of Japan’s EPA on Automotive Industry in Malaysia,
Thailand and Indonesia, JATI (Journal of Southeast Asian Studies, University of Malaya)
Vol.17, 2012, 23-42.
[5] Motoko Iwami, Japanese FDI: Recent Development and Outlook, JOI Bulletin (Japan