Citation:
Havenetidis, K and Paxinos, T and Kardaris, D and Bissas, A (2017) Prognostic
poten-tial of body composition indices in detecting risk of musculoskeletal injury in army
of-ficer cadet profiles.
Phys Sportsmed, 45 (2).
pp.
114-119.
ISSN 2326-3660 DOI:
https://doi.org/10.1080/00913847.2017.1298977
Link to Leeds Beckett Repository record:
http://eprints.leedsbeckett.ac.uk/4213/
Document Version:
Article
The aim of the Leeds Beckett Repository is to provide open access to our research, as required by
funder policies and permitted by publishers and copyright law.
The Leeds Beckett repository holds a wide range of publications, each of which has been
checked for copyright and the relevant embargo period has been applied by the Research Services
team.
We operate on a standard take-down policy.
If you are the author or publisher of an output
and you would like it removed from the repository, please
contact us
and we will investigate on a
case-by-case basis.
Prognostic potential of body composition indices in detecting risk of
musculoskeletal injury in Army Officer Cadet profiles
Konstantinos Havenetidisa, Thrasivoulos Paxinosa, Dionysios Kardarisa and Athanassios Bissasb
aHuman Performance-Rehabilitation Laboratory, Faculty of Physical & Cultural Education, Hellenic Army Academy, Vari, Attiki, Greece; bCarnegie School of Sport, Leeds Beckett University, Leeds, West Yorkshire, UK
[The Physician and Sportdmedicine – accepted version, Feb 2017]
Abstract
Objectives: High values in most of the body composition indices have been related to musculoskeletal injuries, but limited data exist on the accuracy of these diagnoses when detecting musculoskeletal injuries in military populations. Methods: The suitability of Body Fat Percentage, Body Mass Index, Fat Mass Index and Fat Free Mass Index to identify injury risk was examined in a group of Army Officer Recruits. All body composition diagnoses were measured in 268 male Army Officer Recruits prior to the commencement of Basic Combat Training. Musculoskeletal injury was identified using codes from the International Classification of Diseases. The area under the curve, in the Receiver Operating Characteristic curve, was used to quantify the overall ability to discriminate between those who were injured and those who were not. Results: The statistics indicated that all indices, apart from Body Mass Index, had a significant possibility to detect musculoskeletal injury potential (p<0.05; 61%-63%). The respective cut-off points used to classify individuals as injured were for Body Fat Percentage >22, for Fat Mass Index >6.5 and for Fat Free Mass Index <16.5. Conclusion: Body Mass Index values can not similarly detect the possibility of occurrence of musculoskeletal injuries in Army Officer Recruits, just as other body composition diagnoses related to fat mass or/and free fat mass. However, the cut off-points related to the overall diagnostic performance of each body composition index should be used with caution and in accordance with the aims of each experimental setting.
1. Introduction
Data from Military Academies and combat army units show that intense physical exercise, either during basic combat or advanced military training, is a key contributing factor to a range of musculoskeletal injuries. Numerous studies have reported that military trainees are exposed to an increased risk of injury ranging from 14%-42% for males and 27%-62%% for females compared to their civilian counterparts [1,2]. For instance, a recent study investigating injuries suffered by recruits during a 7-week Basic Combat Training (BCT) reported an injury rate of 28.3% for male recruits [3]. A different study conducted in Denmark [4] reported an injury incidence of 28% for a 12-week BCT whereas, another European study (United Kingdom) showed 16% of recruits (Marines) suffering a training related injury during a 32-week training course [5]. Low levels of muscular endurance [2] and neuromuscular coordination [6] are factors that likely tend to increase the risk of injury, and as the physical capabilities usually improve towards the end of the basic combat training, injury prevalence decreases too. It seems that the body needs a period of gradual adaptation to BCT conditions in order for the musculoskeletal system to develop the necessary protective mechanisms against the demanding training loading introduced abruptly by military training practices. However, such mechanisms and capabilities are not in place during the early stages of BCT, hence the high injury rates during that period experienced by military personnel [7].
An examination of the relevant literature [8] reveals that risk factors for training–related injuries in various military populations in the United States are either extrinsic or intrinsic or a combination of both. Extrinsic risk factors are those related to the surrounding training environment or to the characteristics of the actual activities, whereas intrinsic factors are directly related to the individual. In particular, extrinsic risk factors among others include length of running distance [9] and weather conditions [10, 11] whereas typical intrinsic risk factors include gender [1, 2, 12], age [2, 3, 13], levels of physical activity [14, 15], cigarette smoking [2, 16] flexibility [2, 14] and strength levels [17]. Most of the studies mentioned above, suggest that musculoskeletal injuries in military training populations result from multiple causes and are associated with a variety of risk factors acting together in a cumulative manner. Obviously these factors are not pertinent only to military populations but also to athletic populations [18, 19]. Therefore, any investigation of the origin and manipulation of such factors has also applications to non-military populations.
body composition indices based on anthropometric measures (body mass, height) and body fat percentage as intrinsic factors of the most common injuries occurring during military training. As a result, the purpose of the present study was to investigate the prognostic potential of these body composition indices in relation to musculoskeletal injuries as well the identification of the associated thresholds in a military population.
Therefore, the research hypothesis of the present study was that various body composition indices would provide a useful prognostic tool in detecting risk of musculoskeletal injury in military populations.
2. Materials and methods
2.1 Subjects
Two hundred and sixty eight (268) healthy male recruits volunteered to participate after signing an informed consent form. Their mean values ± SD for age, body mass and body height were 20.4±1.7 years, 79.3±9.8 kg and 177.7±6.1 cm respectively. They were monitored through an initial period of BCT which involved seven weeks of highly standardised physical conditioning program (n=132 hours), mandatory for all recruits. Each training day comprised two running (intense and low pace) and callisthenics (pull ups, sit ups, push ups leg hops) sessions and one marching-military activity session. Sprint-agility exercises and non-tactical hikes were also performed once a week. All exercises were performed in cadence and complete in the sequence mentioned.
2.2. Registration of injuries
Every injury for which a recruit had to consult a physician (unit medical officers and conscripted physicians) was registered, documented and classified based on the International Classification of Diseases-Ninth Revision (ICD-9) terminology [20]. Only musculoskeletal injuries (muscle, tendon, bone, joint, or ligament injury) were recorded and used to calculate injury prevalence. The severity of each injury was classified into four grades: Grade 1= attending BCT with pain possible or minor restrictions in activity, grade 2= absence from specific BCT activities, grade 3= absence from all BCT activities and grade 4 = hospital admission.
2.3. Body composition and anthropometric measurements
experienced investigators (more than 100 measures per year) using skinfold calipers (Harpenden, British Indicators, West Sussex, UK). All measurements were collected on the recruit’s right side using a rotation pattern through measurement sites in order to allow time for skin and underlying fat to regain normal thickness. Duplicate measurements were taken at each site and if the second measurement differed more than 5% from the first, a third was taken and the median was recorded as the final value. Additionally, 15 recruits took part in a series of reliability trials (which performed thrice within the same day by the same investigator) in order to assess the variability of body fat measurements. These demonstrated very good test-retest reliability over the duration of the study with intraclass correlation coefficients ranging from 0.90 to 0.94.
Body mass and height were measured to the nearest 0.1 kg and 0.5 cm respectively, using a balance beam scale equipped with a stadiometer (SECA 710, GmbH & Co, Hamburg, Germany). During each measurement the cadet was standing barefoot wearing minimal clothing. Body mass index (BMI) was calculated by dividing body mass by the square of height. Fat mass (expressed in kilograms) was calculated by multiplying body mass by BFP whilst fat-free mass was calculated by subtracting fat mass from the total body mass. Fat Mass Index (FMI) and Fat-Free Mass Index (FFMI) were calculated as follows: FMI = Fat mass / body height (expressed in meters)2 and FFMI = Fat-Free Mass / body height (expressed in meters)2 respectively.
All anthropometric data were obtained from the recruits’ physical examination (conducted upon entry into the Hellenic Army Academy’s reception station) a week prior to BCT (4th week of August). Injury registration procedure started with the commencement of the BCT period (1st week of September). All procedures were approved by the Hellenic Ministry of Defence Research Committee. Ethical approval was also obtained by the Hellenic Army Academy.
2.4. Data analysis
considered significant. All statistical analyses were conducted using MedCalc software, version 12.4.0, (MedCalc, Ostend, Belgium).
3. Results
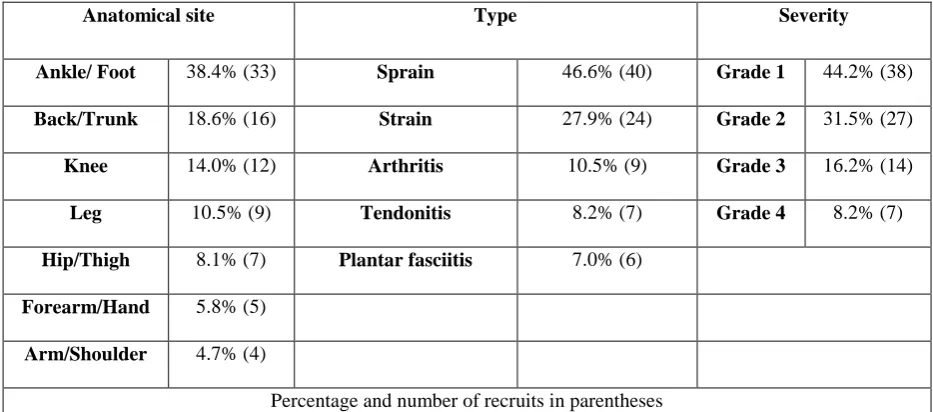
Out of 268 recruits, 86 (32%) suffered from musculoskeletal injuries. Their mean (±SD) age, body mass and body height were 20.4±1.5 years, 80.1±10.3 kg and 177.7±6.6 cm respectively. The rest of the recruits [182 (68%)] did not suffer any musculoskeletal injury. Their mean (±SD) age, body mass and body height were 20.4±1.8 years, 78.9±9.6 kg and 177.6±5.8 cm respectively. Statistical analysis (independent t-test) showed that no significant differences (p<0.05) existed among injured and non-injured recruits in terms of age (p=0.85), body mass (p=0.35) and body height (p=0.92). All injuries were recorded as unintentional, did not involve an interaction with motor vehicles and resulted from activities in the aforementioned BCT period (not any recreational activity). Most of the musculoskeletal injuries were located in the lower extremities (71%), concerned sprains and strains (75%) and involved grade 1-2 injuries (76%) (Table 1).
Table 1. placed here
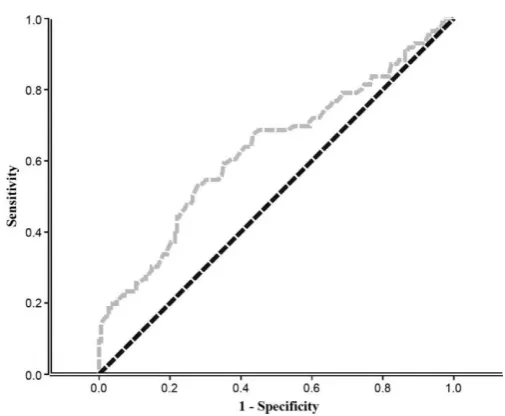
Mean ± SD values across all body composition measures for injured recruits were: BMI; 25.3 ± 2.7, BFP; 14.6 ± 6.0, FMI; 3.8 ± 1.9 and FFMI; 21.5 ± 1.4. Mean ± SD values across all body composition measures for non-injured recruits were: BMI; 25.0 ± 2.5, BFP; 11.9 ± 4.5, FMI; 3.1 ± 1.4 and FFMI; 21.9 ± 1.7. Figure 1. illustrates the ROC curve for BFP, which presented the highest AUC of 0.63.
Figure 1. placed here
The diagnostic accuracy of the cut-off points for identifying recruits at risk of injury by all measures, except BMI was higher than what would be expected by chance (AUC >0.5; Table 2).
When comparing the differences between AUC values, BMI showed significant differences compared to the rest of the indices (Table 3).
Table 3. placed here
Cut-off point values characterized by the highest sensitivity and specificity for BMI, BFP, FMI and FFMI were >22.24 (sensitivity 91.86; specificity 17.58), >13.70 (sensitivity 53.49; specificity 72.00), >3.53 (sensitivity 52.33; specificity 70.88) and ≤22.57 (sensitivity 83.72; specificity 39.01), respectively.
4. Discussion
The purpose of the present study was twofold: firstly, to examine whether various body composition measures could discriminate between healthy and injured status in young male recruits using ROC analysis; secondly, to identify the cut-off points for these body composition measures. Our overall research hypothesis was that various body composition indices would provide a useful prognostic tool in detecting risk of musculoskeletal injury in military populations. The need for the study was based on the fact that the incidence of musculoskeletal injuries during basic combat training across a range of military populations internationally remains high, something which has a number of functional implications for armed forces. Regarding the first objective, the present ROC analysis showed acceptable AUC and 95% confidence interval limits, suggesting the resultant thresholds were not due to chance (all AUC >0.5) and effectively distinguished between healthy and injured recruits based on BFP, FMI, FFM but not on BMI measures. We found no previous studies on military or civilian adults that reported sensitivity, specificity and predictive values for theses indices as measures of injury occurrence. Our findings provide military professionals with new knowledge on the utilisation of a range of body composition measures in order to identify army recruits who are at a higher risk of sustaining a musculoskeletal injury during basic combat training.
them during the most strenuous periods of training (e.g., marching with or carrying loads), thereby increases their risk of injury [27]. In contrast, in other settings such as in the Hellenic Army Academy, the BCT rarely includes tasks where loads need to be carried or lifted to a certain distance, but mainly involves high running volume and callisthenics. Nonetheless, the present data clearly show that BMI is not considered as an accurate diagnostic tool with regard to identification of military recruits who are at risk of musculoskeletal injury during the early stages of their BCT.
Regarding BFP measures, the present data are in accordance with the ones reported by Jones et al. [1] and Blacker et al. [27] who also showed significant prognostic ability for BFP measured using skinfolds as well as with others [3] using bioelectrical impedance and circumferences [29, 30]. In contrast, other investigators [23, 24] who measured BFP using Dual Energy X-ray Absorptiometry (DEXA) showed that this body composition measure was not a significant risk factor for injury occurrence. Therefore, the measurement method of BFP related indices could play an important role to the ability of identifying a prognostic value in the BFP measures. Interestingly, when repeated BFP measurements were performed in military populations, some researchers showed poor sensitivity of skinfolds for assessing BFP through time [31] whilst others, [32, 33] showed greater accuracy compared to other methods (single and multiple bioelectrical impedance) and a close agreement with DEXA measurements, which are considered the gold standard. It is noteworthy that BFP values reported from the present study measured via skinfolds were almost identical to those reported by investigators who used that method and similar military sample groups [27]. Future studies should assess the relationship between injuries and body fat levels using various methods of BFP determinations including bioelectrical impedance which is popular among military populations due to its simple measurement protocol.
guidelines for body mass and height which inevitably affect the range of BMI values and possibly limit their predictive ability.
Although we are reporting anthropometric predictors of the development of musculoskeletal injuries, several caveats should be considered when interpreting these results. First, there were very few consistent predictors identified in this study. Many of the predictors appeared to be specific to the outcome measure. Secondly, we identified those predictors that were statistically significant (p values from 0.001 to 0.03), but the magnitude of these predictors was often low. Considering that a perfect diagnostic test has an AUC 1.0 whereas a non useful test has an area 0.5 or less, the present AUC values despite reaching significance (AUC values from 0.60 to 0.63), represent a ‘‘sufficient’’ diagnostic accuracy [40]. This could likely be a function of the high statistical power that accompanies a large sample.
Regarding the second purpose, the present data indicated that the cut-off points found to classify individuals as injured were for BFP >22, for FMI >6.5 and for FFMI ≤16.5. These values are considered optimal based on injury prevalence; however they were substantially different from those characterized by the maximum values in sensitivity and specificity (>13.7, >3.5 and ≤22.6 respectively). It is worth mentioning that when comparing the performances of different diagnostic tests, one may be interested in only a small portion of the ROC curve and comparing the AUCs and the overall diagnostic performance may be misleading [41]. In our case, it is essential to detect the high-risk group (injured), in such a way as to provide good sensitivity. It has been reported [3] that undetected-unreported musculoskeletal injuries in military groups often lead to repeated injuries with continuation of the training program. Therefore, the cut off range should be also chosen according to the above aim, even if the false positive rate is high (the proportion of incorrectly classified as injured, persons who are not injured). The reason is that high rates of false negative test results (the proportion of incorrectly classified as non-injured, persons who are injured) may have serious consequences on military training such as significant disability and prolonged rehabilitation periods. Alternatively, if a recruit incorrectly is classified as injured (low specificity) his health status will not be affected, except his physical conditioning which will be reduced due to detraining. Thus, in a military setting, it is preferable to use the cut-off points related to a high sensitivity value (e.g. 80; in this study), which are for BFP >9 (26.2 specificity), for FMI >2.2 (28.6 specificity) and for FFMI ≤16.5 (40 specificity).
physical fitness data pre and post BCT in order to evaluate their relationship with injury incidence. However, the outcome of entry physical fitness testing was ‘‘pass or fail’’. Therefore, no data were registered during that procedure. Another shortcoming of this study was the narrow age range (19–22 years old), included within analyses which compromises the application of the thresholds to a wider age range in military. However, BMI and fat mass after the third and fourth decade of military service are significantly affected by a combination of advancing age and a reduction of occupational physical activity due to requirement of personnel to undertake sedentary managerial tasks [42]. Possibly, the use of a wider age range in the present study would have possibly compromised the relationships of body composition indices with injury occurrence. Therefore, there is value in applying the present thresholds to Military Academies due to the absence of cut-off points calculated specifically for active young military populations within the mentioned age range.
It is clear from the assembled data that single modality approaches are not likely to be effective in predicting musculoskeletal injuries. A recommendation from the present study is that musculoskeletal injury prognostic strategies based on body composition indices will likely have to be contextual in nature, such that effective prediction for a military may differ from one for a civilian population.
5. Conclusion
The present study suggests that the diagnostic ability of BMI towards musculoskeletal injury detection is poor, whilst high BFP, BFI and FFMI values are more sensitive indicators in military populations although their predictive power based on our data is restricted. The major strength of this study is the potential utility of the cut-off points for use in field settings by military instructors. As body composition measurements are simple and low cost methods of assessing predisposition to injury, their use is highly recommended for populations consisting of military recruits, while using the present body composition thresholds can allow risk stratification and effective identification of individuals in need of medical treatment and rehabilitation. The use of the ROC generated cut-off points (preferably those characterized by high sensitivity) in practice by military professionals (medical officers, exercise physiologists) may ensure that recruits can be referred onto intervention services effectively using these simple, low cost body composition assessments periodically, throughout military training.
Funding
Declaration of interest
The authors have no relevant affiliations or financial involvement with any organization or entity with a financial interest in or financial conflict with the subject matter or materials discussed in the manuscript. This includes employment, consultancies, honoraria, stock ownership or options, expert testimony, grants or patents received or pending, or royalties.
References
[1] Jones BH, Bovee MW, Harris JM, Cowan DN. Intrinsic risk factors for exercise-related injuries among male and female Army trainees. Am J Sports Med. 1993;21:705-710.
[2] Jones BH, Cowan DN, Tomlison JP, Robinson JR, Polly DW, Frykman PN. Epidemiology of injuries associated with physical training among young men in the Army. Med Sci Sports Exerc. 1993;25:197-203.
[3] HavenetidisK, PaxinosT. Risk factors for musculoskeletal injuries among Greek Army officer recruits undergoing Basic Combat Training. Mil Med. 2011;176(10):1111-1116.
[4] Rosendal L, Langberg H, Skov-Jensen A, Kjaer M. Incidence of injury and physical performance adaptations during military training. Clin J Sport Med. 2003;13(3):157-163.
[5] Munnoch K, Bridger RS. Smoking and injury in Royal Marines' training. Occup Med. 2007;57:214-216. [6] Hootman JM, Macera CA, Ainsworth BE, Addy CL, Martin M, Blair SN. Epidemiology of
musculoskeletal injuries among sedentary and physically active adults. Med Sci Sports Exerc. 2002;34(5):838-844.
[7] Havenetidis, K., Kardaris, D., Paxinos, T. Profiles of musculoskeletal injuries among Greek Army officer recruits during Basic Combat Training. Mil Med. 2011;176(3):297-303.
[8] Jones BH, Knapik JJ. Physical training and exercise related injuries: Surveillance, research and injury prevention in military populations. Sports Med. 1999;27:111-125.
[9] Jones BH, Cowan DN, Knapik JJ. Exercise, training and injuries. Sports Med. 1994;18:202-214. [10] Gagge AP, Conzalez RR. Mechanisms of heat exchange: biophysics and physiology. In: Fregly MJ,
Blatteis CM. Eds. Handbook of Physiology, Section 4, Environmental Physiology, New York, Oxford Press, 1996; 45-84.
Physiol. 1963;18:51-56.
[12] Finestone A, Milgrom C, Evans R, Yanovich R, Constantini N, Moran DS. Overuse injuries in female infantry recruits during low-intensity basic training. Med Sci Sports Exerc. 2008;40(11):S630-635. [13] Heir T, Eide G. Age, body composition, aerobic fitness and health condition as risk factors for
musculoskeletal injuries in conscripts. Scand J Med Sci Sports. 1996;6(4):222-227.
[14] Reynolds KL, Heckel HA, Witt CE, et al. Cigarette smoking, physical fitness, and injuries in infantry soldiers. Am J Prev Med. 1994;10:145-150.
[15] Jones BH, Bovee MW, Knapik JJ. Associations among body composition, physical fitness and injury in men and women Army trainees. In: Marriot BM. Ed. Body Composition and Physical Performance. Washington DC, National Academy Press, 1992; 141-73.
[16] Conway TL, Cronan TA. Smoking, exercise, and physical fitness. Prev Med 1992; 21: 723-34. [17] Knapik JJ, Canham-Chervak M, Hauret K, Laurin MJ, Hoedebecke E, Craig S, Montain SJ. Seasonal
variations in injury rates during US Army Basic Combat Training. Ann Occup Hyg. 2002;46(1):15-23. [18] D F Murphy, D A J Connolly, B D Beynnon Risk factors for lower extremity injury: a review of the
Literature Br J Sports Med 2003;37:13–29
[19] Taanila H, Suni JH, Kannus P, Pihlajamäki H, Ruohola JP, Viskari J, Parkkari J. Risk factors of acute and overuse musculoskeletal injuries among young conscripts: a population-based cohort study.BMC
Musculoskelet Disord. 2015;1;16:104.
[20] World Health Organization (WHO). International Classification of Disease Clinical Handbook. 9th Revision. Washington D.C: United States Department of Health and Human Services, Public Health Service, Health Care Financing Administration 1989.
[21] Durnin JVGA, Womersley J. Body fat assessed from total body density and its estimation from skinfold thickness: measurements on 481 men and women aged from 16 to 72 years. Br J Nutr. 1974;32:77-97. [22] Heyward V. Assessing body composition. In: Advanced Fitness Assessment and Exercise Prescription,
4th edition, Chapter 8, Human Kinetics; 2002. p. 145–170.
[24] Knapik JJ, Sharp MA, Canham-Chervak M, Hauret K, Patton JF, Jones BH. Risk factors for training-related injuries among men and women in Basic Combat Training. Med Sci Sports
Exerc. 2001;33:946-954.
[25] Knapik JJ, Sharp MA, Canham M, et al. Injury incidence and injury risk factors among U.S. Army basic trainees (including fitness training unit personnel, discharges and newstarts) Ft Jackson, SC, p. 1–70, 1999 (Epidemiological consultation report No. 29HE-8370-98).
[26] Knapik JJ, Cuthie J, Canham M, et al. Injury incidence, injury risk factors and physical fitness of U.S. Army basic trainees Ft Jackson, SC, p. 1–49, 1998 (Epidemiological consultation report No. 29-HE7513-98).
[27] Blacker SD, Wilkinson DM, Bilzon JL, Rayson MP. Risk factors for training injuries among British Army recruits. Mil Med. 2008;173:278-286.
[28] Ross J, Woodward A. Risk factors for injury during basic military training. Is there a social element to injury pathogenesis? J Occup Med. 1994;36(10):1120–1126.
[29] Cowan DN, Bedno SA, Urban N, Yi B, Niebuhr DW. Musculoskeletal injuries among overweight army trainees: incidence and healthcare utilization. Occup Med. 2011;61(4):247–252.
[30] Peake J, Gargett S, Waller M, McLaughlin R, Cosgrove T, Wittert G, Nasveld P, Warfe P. The health and cost implications of high body mass index in Australian defence force personnel. BMC Public Health. 2012 June 19; [cited 2013 April 23]; 12: 451. Available from: http://www.biomedcentral.com/1471-2458/12/451
[31] Friedl KE,Westphal KA, Marchitelli LJ, Patton JF, ChumleaWC, Guo SS: Evaluation of anthropometric equations to assess body-composition changes in young women. Am J Clin Nutr. 2001;73(2):268–275. [32] Lintsi M, Kaarma H, Kull I: Comparison of hand-to-hand bioimpedance and anthropometry equations
versus dual-energy X-ray absorptiometry for the assessment of body fat percentage in 17-18-year-old conscripts. Clin Physiol Funct Imaging. 2004;24(2):85–90.
[33] Aandstad, A; Holtberget, K; Hageberg R.; Holme, I; Anderssen, SA. Validity and Reliability of Bioelectrical Impedance Analysis and Skinfold Thickness in Predicting Body Fat in Military Personnel.
Mil Med. 2014;179(2):208-217.
[35] Schutz Y, Kyle UUG, Pichard C. Fat-free mass index and fat mass index percentiles in Caucasians aged 18 – 98 y. Int J Obes. 2002;26:953–960.
[36] Bahadori B, Uitz E, Tonninger-Bahadori K, Pestemer-Lach I, Trummer M, Thonhofer R, Brath H, Schaflinger E. Body composition: the fat-free mass index (FFMI) and the body fat mass index (BFMI) distribution among the adult Austrian population – results of a cross-sectional pilot study. Int J Body
Comp Res. 2006;4(3):123–128.
[37] Napredit P, Pantaewan P, Nimit-arnun N, Souvannakitti D, Rangsin R. Prevalence of overweight and obesity in Royal Thai Army Personnel. J Med Assoc Thai. 2005;90:335–340.
[38] McLaughlin R, Wittert G. 2009. The obesity epidemic: implications for recruitment and retention of defence force personnel. Obes Rev. 10:693–699.
[39] Prentice AM, Jebb SA. Beyond body mass index. Obes Rev. 2001;2:141–147.
[40] Šimundić AM. Diagnostic Accuracy. Part 1 Basic Concepts: Sensitivity and Specificity, ROC Analysis, STARD Statement, POC. 2012;11(1):6-8.
[41] Park SH, Goo JM, Jo CH. Receiver Operating Characteristic (ROC) Curve: Practical Review for Radiologists. Korean J Radiol. 2004;5(1):11-18.
[42] Sanderson, PW, Clemes, SA, Biddle, SJH. Prevalence and socio-demographic correlates of obesity in
Tables/Figures
Table 1. Injury characteristics by proportion of incidence.
Anatomical site Type Severity
Ankle/ Foot 38.4% (33) Sprain 46.6% (40) Grade 1 44.2% (38)
Back/Trunk 18.6% (16) Strain 27.9% (24) Grade 2 31.5% (27)
Knee 14.0% (12) Arthritis 10.5% (9) Grade 3 16.2% (14)
Leg 10.5% (9) Tendonitis 8.2% (7) Grade 4 8.2% (7)
Hip/Thigh 8.1% (7) Plantar fasciitis 7.0% (6)
Forearm/Hand 5.8% (5)
Arm/Shoulder 4.7% (4)
[image:15.595.61.537.449.568.2]Percentage and number of recruits in parentheses
Table 2. Areas under curve (AUC) and respective cutoff points across all body composition measures.
Index AUC 95% CI p-Value Cutoff point Sensitivity Specificity
BMI 0.522 0.460–0.583 0.5566 >30.1 5.81 99.45
BFP 0.632*** 0.571–0.690 0.0006 >22.0 15.12 98.90
FMI 0.613** 0.552–0.672 0.0031 >6.5 11.63 100.00
FFMI 0.608* 0.547– 0.667 0.020 ≤16.5 0.00 100.00
CI: confidence interval; BMI: body mass index; BFP: body fat percentage; FMI: fat mass index; FFMI: fat-free mass index.
Table 3. Differences between areas under curve of various body composition measures.
Pair-wise
comparison
Difference between
areas
95% CI p-Value
BMI–BFP 0.110*** 0.0554 to 0.165 0.0001
BMI–FFMI 0.0858 −0.0489 to 0.220 0.2120
BMI–FMI 0.0913*** 0.0450 to 0.138 0.0001
BFP–FMI 0.0187*** 0.00823 to 0.0292 0.0005
BFP–FFMI 0.0242 −0.0905 to 0.139 0.6792
FFMI–FMI 0.00549 −0.114 to 0.125 0.9281
CI: confidence interval; BMI: body mass index; BFP: body fat percentage; FMI: fat mass index; FFMI: fat-free mass index.
*** indicates significant differences at p < 0.001.
Figure 1. Receiver operating characteristics curve for body fat percentage.