Citation:
Dobbin, N and Hunwicks, R and Jones, B and Till, KA and Highton, J and Twist, C (2018) Criterion and Construct Validity of an Isometric Mid-Thigh Pull Dynamometer for Assessing Whole Body Strength in Professional Rugby League Players. International Journal of Sports Physiology and Performance, 13 (2). pp. 235-239. ISSN 1555-0273 DOI: https://doi.org/10.1123/ijspp.2017-0166 Link to Leeds Beckett Repository record:
http://eprints.leedsbeckett.ac.uk/3825/
Document Version: Article
The aim of the Leeds Beckett Repository is to provide open access to our research, as required by funder policies and permitted by publishers and copyright law.
The Leeds Beckett repository holds a wide range of publications, each of which has been checked for copyright and the relevant embargo period has been applied by the Research Services team.
We operate on a standard take-down policy. If you are the author or publisher of an output and you would like it removed from the repository, please contact us and we will investigate on a case-by-case basis.
1
Title: Criterion and construct validity of an isometric mid-1
thigh pull dynamometer for assessing whole body strength 2
in professional rugby league players 3
4
Short Title: Validity of an isometric mid-thigh pull 5
dynamometer 6
7
Nick Dobbin1 2, Richard Hunwicks2, Ben Jones2 3,Kevin Till3, 8
Jamie Highton1, Craig Twist1, 9
10
1 Department of Sport and Exercise Sciences, University of 11
Chester, Chester, UK 12
2 Rugby Football League, Red Hall, Red Hall Lane, Leeds, UK 13
3 Institute for Sport, Physical Activity and Leisure, Leeds 14
Beckett University, Leeds, West Yorkshire, UK 15
16
Corresponding Author: Craig Twist, Department of Sport and 17
Exercise Science, University of Chester, Chester, CH1 4BJ 18
Phone: (044-11) 01244513441 19
Email: [email protected]
20 21
Abstract Word Count: 216 22
Manuscript Word Count: 2463 23
Figures: 2 24
2 ABSTRACT
26
Purpose: The purpose of this study was to examine the 27
criterion and construct validity of an isometric mid-thigh pull 28
dynamometer to assess whole body strength in professional 29
rugby league players. 30
Methods: Fifty-six male rugby league players, (33 senior and 31
23 youth professional players) performed four isometric mid-32
thigh pull efforts (i.e. two on the dynamometer and two on the 33
force platform) in a randomised and counterbalanced order. 34
Results: Isometric peak force was underestimated (P<0.05) 35
using the dynamometer compared to the force platform (95% 36
LoA: -213.5 ± 342.6 N). Linear regression showed that peak 37
force derived from the dynamometer explained 85% (adjusted 38
R2 = 0.85, SEE = 173 N) of the variance in the dependent 39
variable, with the following prediction equation derived: 40
predicted peak force = [1.046 * dynamometer peak force] + 41
117.594. Cross-validation revealed a non-significant bias 42
(P>0.05) between the predicted and peak force from the force 43
platform, and an adjusted R2 (79.6%), that represented 44
shrinkage of 0.4% relative to the cross-validation model (80%). 45
Peak force was greater for the senior compared to youth 46
professionals using the dynamometer (2261.2 ± 222 cf. 1725.1 47
± 298.0 N, respectively; P<0.05). 48
Conclusion: The isometric mid-thigh pull assessed using a 49
3
of distinguishing muscle function characteristics between 51
professional rugby league players of different standards. 52
53 54
Keywords: Peak force, measurement error, talent 55
4 INTRODUCTION
57
Maximum muscle strength is an important physical quality for 58
rugby league that is related to fundamental performance 59
characteristics (e.g. sprint performance, tackling ability)1,2,3 and 60
is associated with a lower risk of injury.4 Maximal strength is 61
also known to differentiate between playing standard,5-7 62
meaning it has importance as part of talent identification. 63
Practitioners must therefore be able to accurately assess a rugby 64
league player’s whole body maximal strength. 65
66
The assessment of maximal strength using isoinertial measures 67
(e.g. 1RM squat) is traditionally used in rugby league,1,6,8,9 but 68
can be influenced by individual technique and experience.10 69
Isointerial dynamometry is also associated with an increased 70
risk of injury,11 while testing with large squads can be time 71
consuming. Taken together, the shortcomings of isoinertial 72
dynamometry suggest that practitioners must think carefully 73
about the selection of a valid, safe and time-efficient measure 74
of maximal strength. 75
76
The use of the isometric mid-thigh pull offers a method of 77
maximal strength assessment that meets the aforementioned 78
criteria.12-14 The mid-thigh pull requires participants to stand on 79
a force platform with an immovable bar positioned to 80
5
crease of the hip.15 Participants are then instructed to pull as 82
fast and hard as possible, enabling various kinetic measures to 83
be quantified from ground reaction forces.16,17 With good 84
reliability15,18,19 and strong relationships with dynamic actions 85
such as sprinting and jumping,3,17 the isometric mid-thigh pull 86
presents a useful method for assessing whole-body maximum 87
strength. However, the utility of the method is likely to be 88
limited by the availability of a force platform.17 89
90
The development of a custom-built isometric mid-thigh pull 91
dynamometer offers a more cost effective method for the safe 92
and time-efficient measure of maximal strength. However, for 93
practitioners it is important to understand the validity of any 94
new device against the criterion method,20 whilst it must be 95
capable of differentiating between those of different training 96
status (i.e. construct validity).21 In a recent study by James et 97
al.,19 isometric mid-thigh pull performance measured using a 98
strain gauge had good reliability (coefficient of variation = 99
3.1%) but poor criterion validity when compared against the 100
same exercise conducted on a force platform. In this study, 101
validity was assessed using a relatively small sample size of 102
recreationally active participants (n = 15) and no attempt was 103
made to understand the ability of the simplified apparatus to 104
differentiate peak force capabilities between athletes of 105
6
the purpose of this study was twofold: 1) to compare the peak 107
forces obtained in a group of professional rugby league players 108
during the isometric mid-thigh pull between a custom built 109
dynamometer and a force platform (i.e. criterion validity); and 110
2) to establish the utility of the isometric mid-thigh pull to 111
differentiate muscle strength characteristics between rugby 112
league players of different standards (i.e. construct validity). 113
114
METHODS 115
Participants and design 116
With institutional ethics approval and participant consent, 56 117
male rugby league players were recruited from two professional 118
clubs and classified as senior professional (n = 33, age 25.3 ± 119
3.4 years, stature 183.9 ± 6.8 cm, body mass 97.9 ± 9.5 kg) and 120
youth professional (n = 23, age 18.3 ± 1.4 years, stature 179.2 ± 121
5.2 cm, body mass 86.2 ± 8.2 kg) players. Senior players had 122
completed at least one season training for, and competing in, 123
the Super League competition. Youth consisted of players who 124
were currently playing at Academy level or who had in the last 125
three months graduated to the first team. Data were collected in 126
the pre-season period with all players having at least two years 127
of systematic resistance training experience that involved lower 128
body maximum lifts. After habituation, each player completed 129
two isometric mid-thigh pull strength assessments on the 130
7
design with a five-minute passive recovery between each effort. 132
All testing was carried out indoors on a hard, non-slip surface. 133
134
Methods 135
All participants completed a standardised warm up before the 136
mid-thigh pull that comprised of five minutes of dynamic 137
stretching along with two isometric efforts at 50% and 75% of 138
maximal effort.22 For both measurements, participants were 139
positioned similar to the second pull phase of the power clean, 140
with the bar located mid-way between the knees and hips, 141
knees flexed at ~140 degrees and shoulders over the bar.23 142
Based on previous literature, participants were given a 3 second 143
countdown and instructed to pull as fast and hard as possible 144
for 5 seconds, placing emphasis on the rate of force 145
development, which is reported to aid maximal force 146
development.24 147
148
Dynamometer: A custom-built isometric mid-thigh pull 149
dynamometer was designed and built to include a T.K.K.5402 150
dynamometer (Takei Scientific Instruments Co. Ltd, Niigata, 151
Japan) sampling at 122 Hz. Briefly, this consisted of a wooden 152
platform (80 x 50 cm) with rubber foot grips (31 x 20 cm), 153
placed shoulder width apart and chain (51 cm) from the 154
dynamometer to a latissimus pulldown bar (120 cm; Decathlon, 155
8
to allow participants to achieve the position described above. 157
Before pulling, participants applied minimal pre-tension to the 158
chain to avoid any jerking action on initiating the lift. The 159
highest peak force (kgf) from the two attempts was then 160
multiplied by 9.81 (to represent the value in Newtons) and 161
subsequently used for analysis. 162
163
Force Platform: The isometric mid-thigh pull was performed 164
using a commercially available portable force platform (HUR 165
Labs, FP4, Tampere, Finland) with a sampling rate of 1200 Hz. 166
The force plate was seated in a customized fixed rack, which 167
enabled adjustments in bar height by 3 cm increments (Figure 168
1a). Where necessary, smaller adjustments in bar height were 169
made by placing 1 cm wooden boards on the force platform. In 170
such instances the force platform was then re-calibrated before 171
any measurement was performed. Each participant’s best trial 172
from two attempts, as determined by the highest peak force 173
(PF) in Newtons (N), was used for analysis.22 174
175
*** INSERT FIGURE 1 HERE*** 176
177
Statistical Analyses 178
Data were initially checked for normality via the Shapiro-Wilk 179
statistic (P>0.05) before using Pearson product-moment 180
9
assess the relationship between methods. Paired sample t-tests 182
were used to calculate differences (biases) between means of 183
measurement methods (criterion validity) and followed up 184
using 95% limits of agreement (95% LoA)25 to quantify the 185
within-subject variation (random error). Effect sizes (ES) and 186
90% confidence intervals [lower bound – upper bound] were 187
also used to quantify the magnitude of the effect between 188
methods and groups using the following criteria: 0.2, 0.6 and 189
1.2 for small, moderate and large effects, respectively.26 Linear 190
regression analysis was used to determine a prediction equation 191
for peak force along with the typical regression statistics (R2 192
and SEE). Using an 80/20% split of the sample,27 we cross-193
validated the prediction equation and sought to establish that 194
there was minimal shrinkage in the R2 value relative to the 195
model. This being the case, the full predictive model can be 196
presented. To determine the sensitivity of the IMTP against an 197
analytical goal, an independent t-test was used to assess 198
between-group differences in peak force (construct validity) 199
and normalised peak force using ratio (PF/BM) and allometric 200
(PF/BMb) scaling, where PF represents peak force, BM is body 201
mass in kilograms and b is a power exponent.28 Within-session 202
reliability was determined using coefficient of variation (CV) 203
and intraclass correlation coefficient (ICC). Data are reported 204
10
Windows (Version 23.0, 2015) and a predesigned 206
spreadsheet.29 207
208
RESULTS 209
Within-session reliability revealed CVs of 8.3% and 9.2%, and 210
ICCs of 0.913 and 0.912 for the dynamometer and force 211
platform, respectively. 212
Isometric peak force was significantly underestimated 213
(P<0.001, ES = -0.53 [-0.85 - -0.21] using the dynamometer 214
compared to the force platform, with 95% of the differences 215
ranging between -556.1 and 130.1 N. However, there was a 216
strong, significant relationship for peak force between the 217
dynamometer and force platform (r = 0.92, P<0.001) (Table 1, 218
Figure 2). 219
***INSERT TABLE 1 HERE*** 220
*** INSERT FIGURE 2 HERE*** 221
The regression analysis based upon the cross-validation sample 222
(Table 2) revealed that peak force derived from the 223
dynamometer explained 80% (adjusted R2 = 0.80) of the 224
variance in the dependent variable, yielding the equation: 225
predicted peak force = (1.046 * dynamometer peak force) + 226
117.594. Cross-validation analysis revealed no significant 227
difference (P=0.724, ES = 0.05 [-0.26 - 0.36] between the 228
11
an adjusted R2 (79.6%) that represented a shrinkage of 0.4% 230
relative to the cross-validation model (80%, Table 3). 231
Therefore, the predictive power of the model was not 232
substantially changed when applied to a different sample. 233
***INSERT TABLE 2 HERE*** 234
***INSERT TABLE 3 HERE*** 235
The overall regression model (Table 4) revealed that peak force 236
measured on the dynamometer explained 84.2% of the variance 237
in the dependent variable (SEE = 173 N). The equation was: 238
peak force (N) = (1.089*dynamometer peak force) + 31.95. 239
***INSERT TABLE 4 HERE*** 240
Peak force was greater for the senior compared to youth 241
professionals using both the force plate (2532.7 ± 242.5 cf. 242
1855.3 ± 325.1 N, respectively; t = 8.93, P<0.001, ES = 2.36 243
[1.96 - 2.76] and the modified dynamometer (2261.2 ± 222.0 244
cf. 1725.1 ± 298.0 N, respectively; t = 7.66, P<0.001, ES = 245
2.04 [1.66 - 2.42]. Due to the large difference in body mass (ES 246
1.32 [0.98 – 1.66], peak for+0.34ce data were scaled to account 247
for this difference. Senior players generated significantly 248
greater force compared to youth with both ratio (26.07 ± 3.08 249
cf. 21.58 ± 3.71 N/kg, t = 4.936, P<0.001, ES = 1.32 [0.98 – 250
1.66] and allometric scaling (23.44 ± 2.63 cf. 19.46 ± 3.35 251
N/kg1.02, t = 4.828, P<0.001, ES = 1.32 [0.98 – 1.66] applied. 252
Similarly, peak force was greater for the senior players 253
12
cf. 20.04 ± 3.25 N/kg, t = 4.069, P<0.001, ES = 1.09 [0.76 – 255
1.42] and allometrically (21.88 ± 2.50 cf. 18.89 ± 3.07 N/kg1.01, 256
t = 4.01, P<0.001, ES = 1.07 [0.74 – 1.40] scaled values. 257
258
DISCUSSION 259
This study sought to compare the peak force obtained during 260
the isometric mid-thigh pull performed on a customised 261
dynamometer and a force platform in a group of professional 262
rugby league players (i.e. criterion validity). Additionally, 263
comparisons between two playing standards (senior and junior 264
professionals) were made to determine the construct validity of 265
the isometric mid-thigh pull for use with rugby league players. 266
The principle finding of this study was that the isometric mid-267
thigh pull performed on a custom-built dynamometer 268
underestimated peak force from a force platform as evidenced 269
by the significant difference and small effect size. However, 270
there was a strong relative agreement between both 271
measurement methods. As such, a regression equation was 272
developed that could correct this ‘average’ underestimation. 273
Finally, the modified dynamometer was able to differentiate 274
peak force between playing standards suggesting it possesses 275
appropriate construct validity in the measurement of muscle 276
function characteristics of senior and youth professional rugby 277
league players. 278
13
There was poor agreement between peak force measurements 280
during an isometric mid-thigh pull on the modified 281
dynamometer and the force platform. The mean difference in 282
peak force achieved between the two methods indicated that the 283
modified dynamometer was, on average, -213.5 N lower 284
compared to the force platform. This is consistent with the 285
systematic bias (-229.1 N) between similar apparatus reported 286
by James et al.19 When the 95% LoA were considered, a player 287
with a peak force of 2000 N measured during an isometric mid-288
thigh pull using a force platform could, in the worst-case 289
scenario, achieve a value between 1444 and 2129 N using the 290
modified dynamometer. To provide context, this potential error 291
(~685 N) is larger than improvements in peak force derived 292
from an isometric mid-thigh pull after a nine-week maximal 293
strength or power training programme (431-608 N 30). This 294
means it would be difficult to detect meaningful changes in 295
mid-thigh pull performance when using the modified 296
dynamometer and, therefore, when small-to-moderate changes 297
are expected, practitioners might consider using a regression 298
equation or force platform. 299
300
The underestimation in peak force observed in the present 301
study might be explained by the more open-chain design of the 302
modified dynamometer compared to that of the force platform. 303
14
measured through the feet in contact with the force platform 305
and force applied vertically in a single plane. In contrast, the 306
modified dynamometer required participants to ‘pull’ vertically 307
on a bar anchored centrally, which due to its design had a large 308
degree of anterior-posterior and medio-lateral movement. It is 309
possible that this movement allowed participants lean back into 310
the pull, resulting in force being applied outside of the vertical 311
axis.19 It is also possible that the superior sampling frequency 312
of the force platform compared to the modified dynamometer 313
(1200 cf. 122 Hz, respectively) influenced the precision of the 314
peak force measurements.15 315
316
To correct for the underestimation of peak force using the 317
modified dynamometer, we have developed a regression 318
equation that reduces the difference from the force platform to 319
within mean values of ~4.6 N. Therefore, when a comparison 320
between methods is necessary, this equation can be applied to 321
data collected from the modified dynamometer when using a 322
similar sample to that used in this study. However, practitioners 323
should note that there might be some error in this estimate of 324
~173 N in individual cases, owing to some of the variance in 325
force platform performance not being explained by 326
performance using the modified dynamometer. 327
328
15
be stronger from more extensive resistance training exposure,6 330
performed better on the isometric mid-thigh pull using both 331
methods. More specifically, peak force measured on the
332
modified dynamometer for senior professional rugby league
333
players was 31% higher than that of youth professionals, 334
similar to the difference of ~36% according to the force 335
platform. Furthermore, our results indicated that this large 336
difference in peak force was irrespective of differences in body 337
mass. After applying both ratio and allometric scaling, the 338
results indicated that senior players outperformed youth players 339
regardless of body mass, suggesting training history is an 340
important factor when assessing peak force. As such, the 341
modified dynamometer mid-thigh pull is sufficiently sensitive 342
to be used to classify the strength capabilities of professional 343
rugby league players of different standards and training
344
histories.
345
Practical Applications 346
A criterion measure of peak force during an isometric mid-347
thigh pull cannot be measured from a modified dynamometer. 348
This notwithstanding, the dynamometer is capable of 349
distinguishing differences in muscle function between more 350
and less experienced rugby league players. For those 351
practitioners who require more accurate measures of peak force 352
from isometric-mid thigh pull, they might choose to use the 353
16
prediction equation for peak force is specific to rugby league 355
players and caution should be taken when applying this to other 356
populations. Strength and conditioning coaches who wish to 357
measure maximal strength when profiling rugby players might 358
adopt this safe, cost-effective and valid apparatus. 359
360
Conclusion
361
The current study investigated the criterion and construct
362
validity of a modified dynamometer for the assessment of
363
isometric mid-thigh pull strength. Where practitioners are
364
required to profile players (i.e. talent identification), the use of
365
a modified dynamometer can be used to differentiate between
366
academy and first-grade professional rugby league players.
367
Additionally, the regression equation provided can allow
368
practitioners to detect training-induced changes in whole-body
369
strength, albeit they should be cognisant that small changes are
370
likely to go undetected, and in such cases, a force platform
371
should be used.
17 References
373 374
1. Comfort P, Haigh A, Matthews MJ. Are changes in 375
maximal squat strength during preseason training 376
reflected in changes in sprint performance in rugby 377
league players? J Strength Cond Res. 2012;26(3):772-378
776. 379
2. Speranza MJ, Gabbett TJ, Johnston RD, Sheppard JM. 380
Muscular strength and power correlates of tackling 381
ability in semiprofessional rugby league players. J 382
Strength Cond Res. 2015;29(8):2071-2078. 383
3. Suchomel TJ, Nimphius S, Stone MH. The importance 384
of muscular strength in athletic performance. Sports 385
Med. 2016;46(10):1419-1449. 386
4. Gabbett TJ, Ullah S, Finch CF. Identifying risk factors 387
for contact injury in professional rugby league players--388
application of a frailty model for recurrent injury. J Sci 389
Med Sport. 2012;15(6):496-504. 390
5. Baker DG Newton RU. Comparison of lower body 391
strength, power, acceleration, speed, agility, and sprint 392
momentum to describe and compare playing rank 393
among professional rugby league players. J Strength 394
Cond Res. 2008;22(1):153-158. 395
6. Till K, Jones B, Geeson-Brown T. Do physical qualities 396
influence the attainment of professional status within 397
elite 16-19 year old rugby league players? J Sci Med 398
Sport. 2016;19(7):585-589. 399
7. Darrall-Jones JD, Jones B, Till K. Anthropometric and 400
physical profiles of english academy rugby union 401
players. J Strength Cond Res. 2015;29(8):2086-2096. 402
8. Baker DG, Newton RU. Comparison of lower body 403
strength, power, acceleration, speed, agility, and sprint 404
momentum to describe and compare playing rank 405
among professional rugby league players. J Strength 406
Cond Res. 2008;22(1):153-158. 407
9. Meylan CM, Cronin JB, Oliver JL, Hughes MM, 408
Jidovtseff B, Pinder S. The reliability of isoinertial 409
force-velocity-power profiling and maximal strength 410
assessment in youth. Sports Biomech. 2015;14(1):68-411
80. 412
10. Abernethy P, Wilson G, Logan P. Strength and power 413
assessment. Issues, controversies and challenges. Sports 414
Med. 1995;19(6):401-417. 415
11. Myer GD, Quatman CE, Khoury J, Wall EJ, Hewett TE. 416
Youth versus adult "weightlifting" injuries presenting to 417
united states emergency rooms: Accidental versus 418
nonaccidental injury mechanisms. J Strength Cond Res. 419
18
12. McGuigan MR, Winchester JB. The relationship 421
between isometric and dynamic strength in college 422
football players. J Sports Sci Med. 2008;7(1):101-105. 423
13. McGuigan MR, Newton MJ, Winchester JB, Nelson 424
AG. Relationship between isometric and dynamic 425
strength in recreationally trained men. J Strength Cond 426
Res. 2010;24(9):2570-2573. 427
14. Crewther BT, Kilduff LP, Cook CJ, Cunningham DJ, 428
Bunce P, Bracken RM, Gaviglio CM. Relationships 429
between salivary free testosterone and the expression of 430
force and power in elite athletes. J Sports Med Phys 431
Fitness. 2012;52(2):221-227. 432
15. Dos'Santos T, Jones PA, Kelly J, McMahon JJ, Comfort 433
P, Thomas C. Effect of sampling frequency on isometric 434
midthigh-pull kinetics. Int J Sports Physiol and 435
Perform. 2016;11(2):255-260. 436
16. West DJ, Owen NJ, Jones MR, Bracken RM, Cook CJ, 437
Cunningham DJ, Shearer DA, Finn CV, Newton RU, 438
Crewther BT, Kilduff LP. Relationships between force-439
time characteristics of the isometric midthigh pull and 440
dynamic performance in professional rugby league 441
players. J Strength Cond Res. 2011;25(11):3070-3075. 442
17. McMaster DT, Gill N, Cronin J, McGuigan M. A brief 443
review of strength and ballistic assessment 444
methodologies in sport. Sports Med. 2014;44(5):603-445
623. 446
18. De Witt JK, English KL, Crowell JB, Kalogera KL, 447
Guilliams ME, Nieschwitz BE, Hanson AM, Ploutz-448
Snyder LL. Isometric mid-thigh pull reliability and 449
relationship to deadlift 1RM. J Strength Cond Res. 450
2016. 451
19. James LP, Roberst LA, Haff GG, Kelly VG, Beckman 452
EM. The validity and reliability of a portable isometric 453
mid-thigh clean pull. J Strength Cond Res. 2015; 31(5): 454
1378-1386. 455
20. Haugen T, Buchheit M. Sprint running performance 456
monitoring: Methodological and practical 457
considerations. Sports Med. 2016;46(5):641-656. 458
21. Baumgarter TA Jackson AS. Measurment for 459
evaluation in physical education and exercise science. 460
Dubuque, US: Wm C Brown Company Publishers; 461
1987. 462
22. Dos'Santos T, Thomas C, Comfort P, McMahon JJ, 463
Jones PA, Oakley NP, Young AL. Between-session 464
reliability of isometric mid-thigh pull kinetics and 465
maximal power clean performance in male youth soccer 466
players. J Strength Cond Res. 2017. 467
23. Thomas C, Jones PA, Rothwell J, Chiang CY, Comfort 468
P. An investigation into the relationship between 469
19
performance. J Strength Cond Res. 2015;29(8):2176-471
2185. 472
24. Beckham G, Mizuguchi S, Carter C, Sato K, Ramsey 473
M, Lamont H, Hornsby G, Haff G, Stone M. 474
Relationships of isometric mid-thigh pull variables to 475
weightlifting performance. J Sports Med Phys Fitness. 476
2013;53(5):573-581. 477
25. Bland MJ, Altman DG. Statistic methods for measuring 478
agreement of clinical measurement. The Lancet 479
1986;327(8476):307-310. 480
26. Hopkins WG, Marshall SW, Batterham AM, Hanin J. 481
Progressive statistics for studies in sports medicine and 482
exercise science. Med Sci Sport Exerc. 2009;41(1):3-12. 483
27. Field A. Discovering statistics using ibm spss statistics: 484
And sex and drugs and rock 'n' roll. 4th ed. London, 485
UK: Sage Publications; 2013. 486
28. Crewther BT, Gill N, Weatherby RP, Lowe T. A 487
comparison of ratio and allometric scaling methods for 488
normalizing power and strength in elite rugby union 489
players. J Sport Sci. 2009;27(14):1575-1580. 490
29. Hopkins WG. Spreadsheets for analysis of controlled 491
trials with adjustment for a subject characteristic. 492
Sportscience. 2006;10:46-50. 493
30. Harris GR, Stone MH, O'Bryant HS, Proulx CM, 494
Johnson RL. Short-term performance effects on high 495
power, high force, or combined weight-training 496
methods. J Strength Cond Res. 2000;14(1):14-20. 497
Table 1. Concurrent validity of the dynamometer against the force platform for measuring peak force. 1
Dynamometer peak force (N)
Force platform peak force (N) 95% LoA CV% Pearson’s r value
Peak force (N) 2041.0 ± 367.5* 2254.5 ± 435.5 -213.5 ± 342.6 19.3 0.92
Note: * = significantly lower (P<0.05) than peak force derived from force platform. LoA = limits of agreement. CV% = coefficient of variation. 2
2
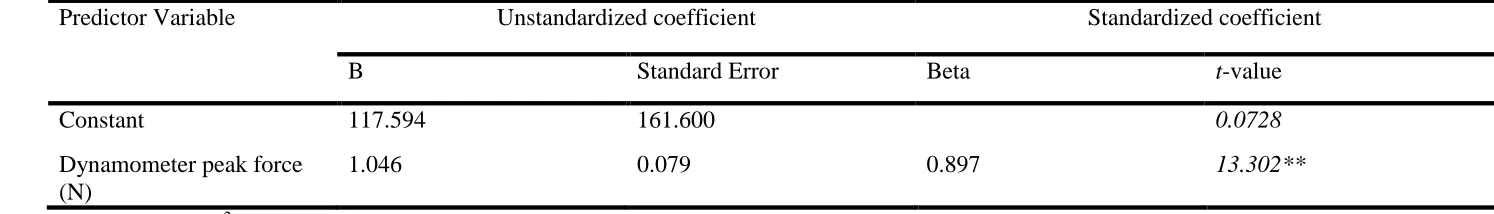
Table 2. Overall parameters of the cross-validation prediction model using the dynamometer to estimate peak force (N) derived from the force 1
platform (n = 45). 2
Predictor Variable Unstandardized coefficient Standardized coefficient
B Standard Error Beta t-value
Constant 117.594 161.600 0.0728
Dynamometer peak force (N)
1.046 0.079 0.897 13.302**
Note: Adjusted R2 = 0.800; ** = P<0.001. 3
3
Table 3. Cross-validation of predicted and observed force platform peak force (n = 11) 1
Predicted Peak Force Force platform peak force (N) 95% LoA CV% Adjusted R2
Peak force (N) 2344.3 ± 319.6 2362.8 ± 388.0 -4.60 ± 352.56 14.73 0.796
Note: predicted force platform peak force = (1.046 * Dynamometer peak force) + 117.594. 2
4
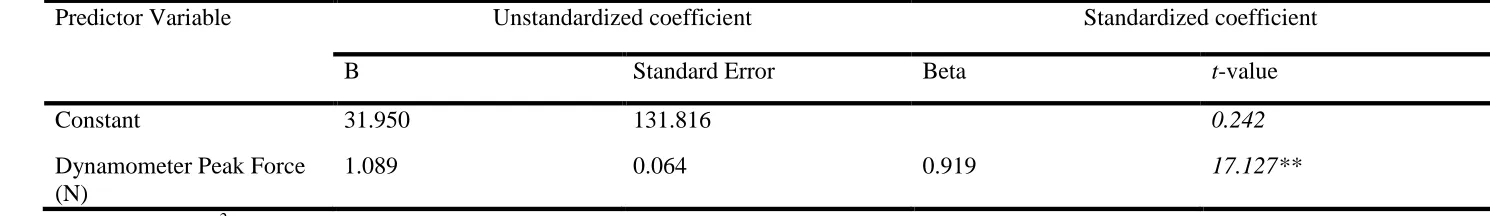
Table 4. Overall parameters for the prediction model using peak force derived from the dynamometer (N) to estimate force platform peak force 1
(N) (n = 56). 2
Predictor Variable Unstandardized coefficient Standardized coefficient
B Standard Error Beta t-value
Constant 31.950 131.816 0.242
Dynamometer Peak Force (N)
1.089 0.064 0.919 17.127**
Note: Adjusted R2 = 0.842; ** = P<0.001. 3
Figure 1. Isometric mid-thigh pull performed on the force platform (A) and modified 1
dynamometer (B). 2
3
Figure 2. Relationship between the dynamometer and force platform for measuring peak 4