Nobles, JD and Griffiths, C and Pringle, A and Gately, P (2017) Why Consistent Completion Criterion are Required in Childhood Weight Management Programmes. Public Health Journal. DOI: https://doi.org/10.1016/j.puhe.2017.07.025
Link to Leeds Beckett Repository record: http://eprints.leedsbeckett.ac.uk/3954/
Document Version: Article
Creative Commons: Attribution-Noncommercial-No Derivative Works 4.0
The aim of the Leeds Beckett Repository is to provide open access to our research, as required by funder policies and permitted by publishers and copyright law.
The Leeds Beckett repository holds a wide range of publications, each of which has been checked for copyright and the relevant embargo period has been applied by the Research Services team.
We operate on a standard take-down policy. If you are the author or publisher of an output and you would like it removed from the repository, please contact us and we will investigate on a case-by-case basis.
1
Title Page
2
Abstract
Objectives: Current research in the field of childhood weight management (WM) effectiveness is hampered by inconsistent terminology and criterion for WM programme completion, alongside other engagement-related concepts (e.g. adherence, dropout, and attrition). Evidence reviews are not able to determine conclusive intervention effectiveness because of this issue. This study aims to quantify how various completion criterion impact upon on: 1) the percentage of WM completers; 2) the standardised Body Mass Index (BMI SDS) reduction; and 3) the predictors of WM completion.
Study Design: A methodological, sensitivity analysis to examine how differential completion criteria affect programme outcomes and predictors.
Methods: Secondary data of 2948 children were used. All children attended a MoreLife WM programme between 2009 and 2014. The completion criterion was incrementally adjusted by 10% (i.e. completer attends 10%, 20%, 30%... of sessions) for research aims 1-2, with the percentage of completers and change in BMI SDS calculated at each increment. For aim 3, the stability (strength, direction, and significance) of the predictors were examined when using the completion criterion of four alternative studies against our previous study (completion ≥70% attendance).
Results: The volume of programme completers decreased in a linear manner as the completion criterion became more stringent (i.e. 70-100% attendance). The change in BMI SDS conversely became incrementally greater. The strength, direction, and significance of the predictors was highly dependent on the completion criterion; the odds ratio varied by 24.2% across a single predictor variable (delivery period). The degree of change is evidenced in the paper.
Conclusions: Inconsistent completion criterion greatly limits the synthesis of programme
effectiveness, and explains some of the inconsistency in the predictors of engagement. Standardised criterion for engagement-related terminology are called for.
3
Introduction
Weight management (WM) programmes have been implemented globally to tackle the obesity epidemic. These programmes are often multifaceted interventions which aim to improve the dietary- and physical activity- behaviours of the participant over a period of time1. Participants, particularly in the United Kingdom, attend WM programmes weekly or bi-weekly and programmes can be either group-based or one-to-one1. This approach is adopted for the treatment of both overweight and obesity. As obesity becomes more severe and co-morbidities start to present (e.g. hypertension, sleep apnoea, or impaired glucose tolerance), multi-disciplinary teams of experts are used; including psychologists, physicians, dieticians, physiotherapists, and physical activity
specialists1. Whilst guidance – such as that of the National Institute for Health and Care Excellence (NICE) – has provided WM programmes with recommendations around design components1, programmes remain diverse in terms of treatment intensity, frequency, duration, and type. Whilst this approach is consistent in adult and childhood populations, this paper will centre around childhood WM programmes.
The effectiveness of childhood WM programmes is not conclusive. A reduction in age and gender standardised Body Mass Index (BMI SDS) and the proportion of participants completing a WM programme are frequently used as primary outcome measures, especially by programme commissioners (i.e. those purchasing the programmes)1-3. With that in mind, researchers have conducted systematic reviews to identify effective WM strategies and programme design components4-6. However, the results of such syntheses are often constrained due to inconsistent terminology and criteria used to define participant engagement; that is, the synonymous use of terms (e.g. dropout, non-completion and attrition) and the non-standardised criteria used to classify participants accordingly (i.e. criterion used to classify completion). For example, it is not possible to compare the outcomes of completers if completion is defined as >50% attendance in programme A and being present in the final session of programme B. This issue is also apparent in other health-related disciplines: anxiety and depression management7, type 2 diabetes management8, and substance abuse treatment9.
In the context of WM, Miller and Brennan10 identified 27 studies that defined attrition, ten of which additionally defined programme completion. These studies included both adult and childhood populations. The results indicate that no consistent criteria and definition for attrition or completion was adopted amongst the studies10. Dhaliwal and colleagues11conducted an integrated review aiming to synthesise the predictors and reasons for participant attrition in childhood WM. In the review of 23 studies, the definitions for attrition varied greatly and the predictors of dropout were inconsistent. This inconsistency was mainly attributed to the inconsistent definitions of attrition and dropout11. These papers highlight the difficulty in synthesising information from multiple sources, and both papers call for standardised definitions and criteria for engagement-related terminology10, 11. In a previous study, we used the term engagement to describe a family’s level of participation in a programme; this term was used to overarch related terminology (e.g. completion, dropout,
retention)12. Consistent definitions and criteria for engagement-related terminology across health improvement interventions would improve the external validity of individual studies, and in addition, enable researchers and commissioners to draw robust conclusions about effective interventions and intervention components10, 11, 13. In doing so, intervention staff could refine current intervention practices, thus improve programme outcomes and cost-effectiveness. In the UK, several government-endorsed documents provide guidance for evaluating WM
4 how to classify a participant as a completer; the Department of Health suggest 60% attendance14, whilst the Public Health England Obesity Knowledge and Intelligence Team (formerly the National Obesity Observatory) recommend a threshold of 75% attendance3. Moreover, both cut points are arbitrary and are not based on academic rigour or empirical evidence. NICE note the importance of monitoring attendance and completion rates, but offer no guidance on how to classify completion1. The reason for such inconsistencies may easily be explained: 1) the completion criteria may be defined by the programmes or programme commissioners themselves; 2) completion and attendance metrics are overshadowed by weight-related outcomes; or 3) programmes differ so vastly in design that a consistent criterion is not feasible.
Notwithstanding these arguments, the impact of various criterion for programme completion has not yet been examined, and past arguments are grounded in logic-based speculation rather than empirical evidence. As such, this paper has three aims: to investigate the impact of an incrementally stringent completion criterion on the percentage of participants completing a childhood WM programme (Aim 1), the mean change in BMI SDS amongst completers (Aim 2), and moreover, to document how four alternative completion criterion may affect the predictors of programme completion (Aim 3). We anticipate that these aims, and the respective findings, will transcend into other health-related disciplines.
Methods
Data
Secondary data of 2948 MoreLife participants were used. The process of data collection, collation and cleansing have been reported previously12. In brief, participants were mainly female (54.6%), aged 10.44±2.80 years, with a BMI of 25.99±5.79kg/m2 (BMI SDS: 2.48±0.87 units), and
predominantly of white ethnicity (70.52%). Ethical approval was provided by Leeds Beckett
University Faculty Research Ethics Committee (ref: 4869) and all participants assented/consented for their data to be used.
MoreLife
MoreLife delivers WM programmes to families in the UK. Families must have a child (aged 4-17 years) with overweight or obesity (BMI SDS >91st centile15) to enrol onto a programme. Programmes last 10-12 weeks, with families attending one, 2-hour session per week. Parents and children attend together but participate in separate, concurrent sessions. Programmes were delivered in 14 Local Authorities across the UK and all programmes followed a similar protocol. Programmatic details have been reported elsewhere using the Template for Intervention Description and Replication (TIDieR)12, 16.
Participant Attendance
Session-by-session participant attendance was determined through the presence of a weekly child weight recording. The MoreLife protocol stipulates that weight (kg) is collected weekly if the child is present in the programme session. The percentage of attendance was calculated as:
5
Completion Criterion
Programme completion was classified at MoreLife as attending ≥70% of sessions – this criterion was chosen as it falls between the Department of Health14 and the Public Health England Obesity
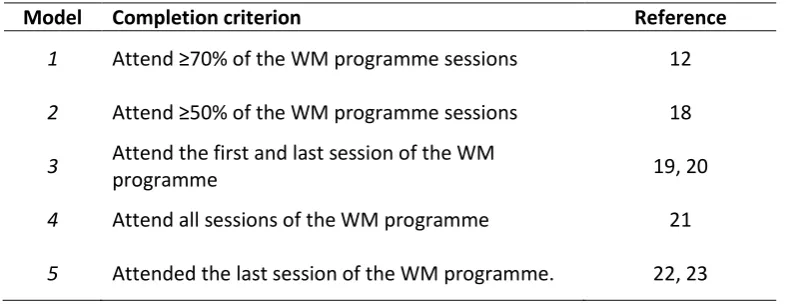
Knowledge and Intelligence Team3 cut points. In addressing aims 1 & 2, the completion criterion was incrementally adjusted by 10% from 0% to 100%. All analyses were re-run at each 10% increment to determine the percentage of completers (i.e. participants whose attendance surpasses the criterion) and the mean change in BMI SDS for completers (i.e. difference between the first measurement and the last measurement). For aim 3, the completion criterion of the original study12 was altered to mirror those used in other studies which have explored the predictors of non-completion and dropout17-23. In short, the third aim assesses the difference in the strength and magnitude of the predictors when adopting a range of alternative completion criteria. Table I displays the four alternative criterion in addition to that used at MoreLife (Model 1).
[INSERT TABLE I]
BMI SDS
BMI was calculated as height (m)/weight (kg)2. BMI was subsequently standardised to account for age and gender using UK-specific growth reference data15. One change in BMI SDS was recorded per participant so long as they attended two or more sessions. This change value reflects the difference between the BMI SDS at the first observation and the BMI SDS at the last observation. One may expect that as the completion criterion increases – and a larger proportion of programme
attendance is required to complete – the mean change in BMI SDS amongst completers will increase. This paper will demonstrate the extent to which this occurs.
Statistical Analysis
The analyses in this study were two-fold, whereby a different analytical method was applied for aims 1-2, and for aim 3. For aim 1, frequency statistics were used to calculate the percentage of
participants completing the programme when completion was defined as ≥10%, ≥20%, ≥30%...≥90% attendance. Similarly, aim 2 utilised descriptive statistics to evidence the mean change in BMI SDS amongst completers at each 10% criterion increment. The outcomes of these analyses (percentage of completers and mean change in BMI SDS) at each criterion increment were plotted on a scatter graph. It is important to note that all participants were recoded as a completer or non-completer at each increment dependent upon their percentage of attendance.
For the third aim, a multivariable logistic regression model (see Nobles et al.12) - which investigated the predictors of completion - was re-run using each of the four alternative completion criterion (Table I). Thus, the independent variables in the four alternative models were consistent with the original model12.The dependent variable differed in the four alternative models, whereby all
participants were recoded as a completer or non-completer to align with the respective criterion. Six independent variables were entered into the models using a forced-entry method (rationale for variable selection previously reported12): Ethnicity (white/white British or non-white/non-white British), Indices of Multiple Deprivation score (proxy for socioeconomic status), baseline BMI SDS, programme year (2009 to 2014 [categorical]), group size (Small [<20 participants] or Large [≥20 participants]), and delivery period (January-, April-, or September- intake). The six variables included in the regression models were only utilised to exemplify the degree to which the magnitude,
6
Results
Percentage of Completers
Programme completion was defined as ≥70% attendance, in which MoreLife achieved a 47.1% completion rate12. At any given criterion, the subset of participants includes all those in the most stringent criterions, and therefore a monotonic increasing relationship is to be expected - as observed in Figure 1. When the criterion for completion becomes more stringent (i.e. completion classified as ≥80% or ≥90% attendance), fewer participants complete the programme. For example, when completion is classified as ≥20% attendance, 85.9% of participants complete the WM
programme, whilst 34.4% complete when the criterion is set at ≥80% attendance. These results illustrate the percentage of participants that could be anticipated to complete a programme using any given criterion. The relationship between data points is somewhat linear (Figure 1).
Change in BMI SDS
Using the MoreLife completion criterion, the mean reduction amongst completers was 0.15 units. As anticipated, when participants are required to attend a greater proportion of the WM programme to be classified as a completer (and subsequently the percentage of participants completing the
programme reduces), the mean change in BMI SDS for completers increases (Figure 2). More
stringent criterion resulted in a greater mean reduction in BMI SDS. Figure 2 can be used to estimate the mean change in BMI SDS when adopting a specific completion criterion. These outcomes
represent the mean change in BMI SDS amongst all participants with an attendance greater than the given criterion.
The change in BMI SDS (± SD) and the number of participants completing the programme for each incremental completion criterion are available in online supplement I.
[INSERT FIGURE 1 and FIGURE 2]
Predictors of Completion
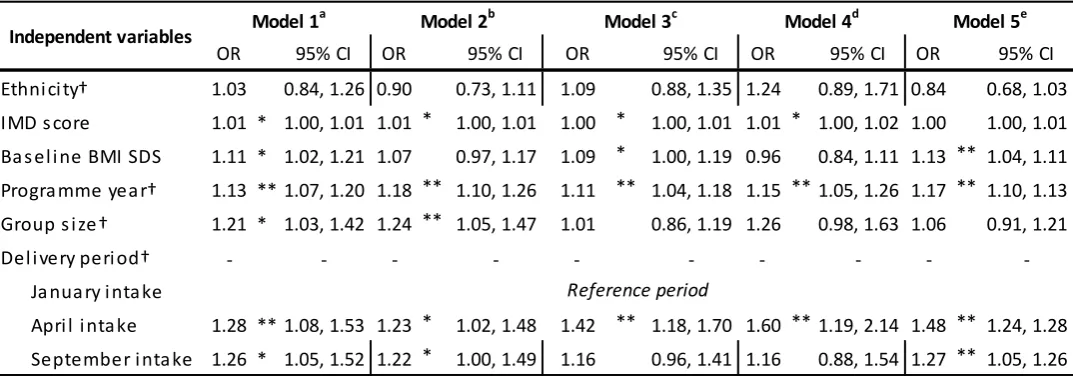
Ethnicity, Indices of Multiple Deprivation score, baseline BMI SDS, programme year, group size, and delivery period were entered into the five regression models as independent variables. The ORs for the original model and the four alternative models are presented in Table II. An OR of greater than one indicates that the odds of an event (e.g. completion) occurring increase as the predictor increases, with values below one signifying reduced odds of the event occurring as the predictor increases.
7 OR for baseline BMI SDS, and the magnitude of the OR for group size, also varied substantially between models (Table II).
The significance (p-value) of the predictors was further impacted by the completion criterion, and variables classified as significant (p ≤0.05) were inconsistent between models (Table II). For example, group size was a significant predictor in the original model (model 1: completers attend ≥70% WM sessions) which then became a non-significant predictor in model’s 3, 4, and 5. The OR of
programme year and the significance of delivery period (April intake) remained somewhat stable across the five models. However, the results of this analysis suggest that the magnitude, direction, and significance of predictive variables are greatly affected by the completion criterion.
To determine if differences among the models were due to selection bias, the baseline
demographics of completers were examined for each alternative criterion (online supplement II). The results indicate minimal heterogeneity between baseline demographics – thus, the sub-samples of completers are representative of the total sample. One exception prevailed, that the percentage white participants completing the programme was higher using the fourth criterion. Results relating to this variable and model should be interpreted with slight caution.
[INSERT TABLE II]
Discussion
Garfield (1989) stated that “the use of varying definitions and criteria of dropouts or premature terminators makes it difficult to compare studies and to secure meaningful generalizations..., the extreme variability among these operational definitions leads to chaos”24, 25. Since then, others have also argued the pertinence of this hypothesis11, 13, 26. This study not only confirms this hypothesis, but it exemplifies the extent to which outcomes [amongst completers] change in light of various
completion criterion. The inconsistent criteria for engagement-related terms could explain why the magnitude, direction and significance of the predictors are inconsistent. The predictors of
completion varied when applying one of the five various criterion in this study. These findings evoke a cross-discipline call to action: standardised definitions and criteria are urgently required to ensure that studies have strong external validity, and can collectively be synthesised appropriately – doing so will help advance our knowledge of intervention effectiveness.
A reduction in BMI SDS is frequently used as the primary outcome measure for a WM programme, with the level of engagement or number of programme completers viewed as secondary 1-3. Given the importance of these measures – and the degree to which reported outcomes affect the likelihood of service commissioning – differential completion criterion could be used to either compensate “poor” results or overstate “positive” results. For example, an undemanding completion criterion (e.g. ≥40% attendance) would result in a high proportion of programme completers – 73.3% in this instance. Albeit that these results change in the anticipated direction, this study demonstrates the degree to which WM outcomes can either be masked or magnified by various completion
criterion.
Previous research has grappled with inconsistent terminology and criteria when looking to
8 dropout (i.e. a participants’ decision, voluntary or involuntary, to withdraw29), and attrition (i.e. the progressive reduction of a cohort/group30), yet they are frequently used synonymously in the literature and included together in systematic reviews10, 11, 26. Compounding the issue, studies have indicated that different variables predict different engagement trajectories (e.g. completion, sporadic attendance, and dropout)12, 25, and so the predictors of non-completion could be very different to those of dropout. That said, research aiming to predict engagement trajectories is of fundamental importance, and future work needs to identify variables which underlie and explain participant engagement (e.g. participant expectations, social support, and relationships with staff members).
Future directions and application of findings
For practitioners, specifically programme commissioners, this research identified the percentage of participants that are likely to complete a programme using any given completion criterion, and furthermore, what change in BMI SDS may be realistically achievable for completers attending a similar up scaled, community-based childhood WM programme.
For others working in the field of engagement, or intervention design and evaluation more broadly, this paper offers a starting point for standardising programme completion. It was possible to conduct these analyses due to weekly attendance data (through proxy recording of weekly weight measurements) being collected. The upkeep and prioritisation of attendance records is a key, and fundamental first step, to progressing in this field. Session-by-session attendance data will enable researchers to effectively analyse programme outcomes and in addition, heighten the external validity of such findings. We anticipate that this approach would be feasible and suitable to wide-ranging interventions, irrespective of the health-related focus.
It is hoped that this study brings stakeholders (i.e. commissioners, providers, and programme participants etc…) and researchers together to discuss the standardisation of engagement-related terminology. It is imperative that both groups work collaboratively to develop a set of accessible and adoptable definitions and criteria. Without such collaboration, any proposed definitions and criteria may not be suitable for their intended application. This study has augmented the rationale for moving in such a direction and offered a feasible first step - the collection of session-by-session attendance data.
Limitations
The findings of this study originate from a large and representative, UK-wide data set – with
MoreLife being one of the UK’s largest providers of childhood WM programmes. That said, this limits the application of these findings to other settings (e.g. clinically-based WM, adult WM, health improvement interventions). It would therefore be beneficial to extrapolate the current analysis methodology to other settings, data sets, and engagement-related terms. It is hypothesised that the findings of our study would transcend across disciplines and terms, and heighten the rationale for standardising the approach to collecting and reporting engagement-related data. The use of consistent criterion for engagement-terms would facilitate the synthesis of predictive variables and intervention effectiveness.
9 consensus is possible, will be a significant future challenge to overcome. To progress, we
recommend capturing session-by-session attendance data as an important first step. A second step is to bring together a range of researchers and stakeholders to define a range of engagement-related terminology. The use of sessional attendance data should be used as a foundation for these
definitions and criteria; it provides a sensitive measure of engagement, and enables a range of criteria to be developed.
Conclusion
10
References
1. National Institute for Health and Care Excellence. Managing Overweight and Obesity among Children and Young People: Lifestyle Weight Management Services. London: National Institute for Health and Care Excellence, 2013. 1-117.
2. National Institute for Health and Care Excellence. Obesity: identification, assessment and management of overweight and obesity in children, young people and adults. London: National Institute of Health and Care Excellence, 2014. 1-65.
3. Roberts K, Cavill N, Rutter H. Standard Evaluation Framework for Weight Management Interventions. London: National Obesity Observatory, 2009,1-59.
4. Michie S, Ashford S, Sniehotta FF, Dombrowski SU, Bishop A, French DP. A refined taxonomy of behaviour change techniques to help people change their physical activity and healthy eating behaviours: The CALO-RE taxonomy. Psychol Health 2011; 26:1479-98.
5. Doak CM, Visscher TLS, Renders CM, Seidell JC. The prevention of overweight and obesity in children and adolescents: a review of interventions and programmes. Obes Rev 2006; 7 :111-36.
6. Whitlock EP, O'Connor EA, Williams SB, Beil TL, Lutz KW. Effectiveness of weight management interventions in children: a targeted systematic review for the USPSTF. Pediatrics 2010; 125:e396-418.
7. Christensen H, Griffiths MK, Farrer L. Adherence in Internet Interventions for Anxiety and Depression: Systematic Review. J Med Internet Res 2009; 11:1-16.
8. Gucciardi E. A Systematic Review of Attrition from Diabetes Education Services: Strategies to Improve Attrition and Retention Research. Can J Diabetes 2008; 32:53-65.
9. Stark MJ. Dropping out of substance abuse treatment: A clinically oriented review. Clin Psychol Rev 1992; 12:93-116.
10. Miller B, Brennan L. Measuring and Reporting Attrition from Obesity Treatment Programmes: A Call to Action. Obes Res Clin Pract 2015; 9:16.
11. Dhaliwal J, Nosworthy N, Holt NL, Zwaigenbaum L, Avis J, Rasquinha A, et al. Attrition and the Management of Pediatric Obesity: An Integrative Review. Child Obes 2014; 10:1-13. 12. Nobles J, Griffiths C, Pringle A, Gately P. Design Programmes to Maximise Participant
Engagement: A Predictive Study of Programme and Participant Characteristics Associated with Engagement in Paediatric Weight Management. Int J Behav Nutr Phys Act 2016; 13 :1-10.
13. Moroshko I, Brennan L, O'Brien P. Predictors of dropout in weight loss interventions: a systematic review of the literature. Obes Rev 2011; 12:912-34.
14. Department of Health. Developing a Specification for Lifestyle Weight Management Services: Best Practice Guidance for Tier 2 Services. London: Department of Health, 2013. 1-42. 15. Cole TJ, Freeman JV, Preece MA. Body mass index reference curves for the UK, 1990. Arch
Dis Child 1995; 73:25-9.
16. Hoffmann TC, Glasziou PP, Boutron I, Milne R, Perera R, Moher D, et al. Better reporting of interventions: template for intervention description and replication (TIDieR) checklist and guide. BMJ 2014; 348:g1687.
17. Watson PM, Dugdill L, Pickering K, Owen S, Hargreaves J, Staniford LJ, et al. Service
evaluation of the GOALS family-based childhood obesity treatment intervention during the first 3 years of implementation. BMJ Open 2015; 5.
18. Epstein LH, Paluch RA, Wrotniak BH, Daniel TO, Kilanowski C, Wilfley D, et al. Cost-effectiveness of family-based group treatment for child and parental obesity. Child Obes 2014; 10:114-21.
11 20. Foster GD, Sundal D, McDermott C, Jelalian E, Lent MR, Vojta D. Feasibility and preliminary
outcomes of a scalable, community-based treatment of childhood obesity. Pediatrics 2012;
130:652-9.
21. Herbert L, Gillespie C, Monaghan M, Holmes C, Streisand R. Factors Associated with Recruitment and Retention in Randomized Controlled Trials of Behavioral Interventions for Patients with Pediatric Type 1 Diabetes. J Clin Psychol Med Settings 2015:1-14.
22. Jelalian E, Hart CN, Mehlenbeck RS, Lloyd-Richardson EE, Kaplan JD, Flynn-O'Brien KT, et al. Predictors of attrition and weight loss in an adolescent weight control program. Obesity 2008; 16:1318-23.
23. Zeller M, Kirk S, Claytor R, Khoury P, Grieme J, Santangelo M, et al. Predictors of attrition from a pediatric weight management program. J Pediatr. 2004; 144:466-70.
24. Garfield SL. Giving up on child psychotherapy: who drops out? Comment on Weisz, Weiss, and Langmeyer. J. Consult Clin Psychol 1989; 57:168-9.
25. de Niet J, Timman R, Jongejan M, Passchier J, van den Akker E. Predictors of participant dropout at various stages of a pediatric lifestyle program. Pediatrics 2011; 127:e164-70. 26. Skelton JA, Beech BM. Attrition in paediatric weight management: a review of the literature
and new directions. Obesity Rev 2010; 12:e273-81.
27. Hardy LL, Mihrshahi S, Gale J, Nguyen B, Baur LA, O'Hara BJ. Translational research: are community-based child obesity treatment programs scalable? BMC Pub Health 2015; 15:1-8. 28. Braet C, Jeannin R, Mels S, Moens E, Van Winckel M. Ending prematurely a weight loss
programme: the impact of child and family characteristics. Clin Psychol Psychother 2010;
17:406-17.
29. Oxford Dictionaries. Drop-out. 2016 [accessed 27/06/2016].
http://www.oxforddictionaries.com/definition/english/drop-out?q=drop+out 30. Oxford Dictionaries. Attrition. 2016 [accessed 27/06/2016].
12
Figure Legends
Figure 1: Percentage of Participants Completing by Alternative Completion Criterion
Red line represents the completion criterion used by MoreLife (≥70% attendance) All participants recoded as a completer or non-completer at each criterion increment
Figure 2: Change in BMI by Alternative Completion Criterion
13
Table I: Alternative Completion Criterion
Model Completion criterion Reference
1 Attend ≥70% of the WM programme sessions 12 2 Attend ≥50% of the WM programme sessions 18 3 Attend the first and last session of the WM
programme 19, 20
14
Table II: Predictors of Completion using Alternative Criteria
Independent variables are consistent in all models and the dependent variable differs. All participants (n = 2948) were used in each model, with the number of completers varying dependent on the completion criteria.
a Completion defined as ≥ 70% attendance (n = 1387 completers [47.1% completion rate, mean change in BMI SDS = -0.15 units]). Original model
used previously [12].
b Completion defined as ≥ 50% attendance (n = 1984 completers [67.3% completion rate, mean change in BMI SDS = -0.13 units])
c Completion defined as attendance at the first and last session (n = 1142 completers [38.7% completion rate, mean change in BMI SDS = -0.15 units]) d Completion defined as attendance at all sessions (n = 328 completers [11.1% completion rate, mean change in BMI SDS = -0.20 units])
e Completion defined as attending last session (n = 1488 completers [50.5% completion rate, mean change in BMI SDS = -0.14 units])
Note: To calculate the percentage change between the OR of the original model (ORo) and model X (ORx) = (ORx – ORo) / ORo
†Categorical variable *p ≤0.05, ** p ≤0.01
OR 95% CI OR 95% CI OR 95% CI OR 95% CI OR 95% CI
Ethni ci ty† 1.03 0.84, 1.26 0.90 0.73, 1.11 1.09 0.88, 1.35 1.24 0.89, 1.71 0.84 0.68, 1.03
IMD s core 1.01 * 1.00, 1.01 1.01 * 1.00, 1.01 1.00 * 1.00, 1.01 1.01 * 1.00, 1.02 1.00 1.00, 1.01
Ba s el i ne BMI SDS 1.11 * 1.02, 1.21 1.07 0.97, 1.17 1.09 * 1.00, 1.19 0.96 0.84, 1.11 1.13 ** 1.04, 1.11
Progra mme yea r† 1.13 ** 1.07, 1.20 1.18 ** 1.10, 1.26 1.11 ** 1.04, 1.18 1.15 ** 1.05, 1.26 1.17 ** 1.10, 1.13
Group s i ze† 1.21 * 1.03, 1.42 1.24 ** 1.05, 1.47 1.01 0.86, 1.19 1.26 0.98, 1.63 1.06 0.91, 1.21
Del i very peri od† - - -
-Ja nua ry i nta ke
Apri l i nta ke 1.28 ** 1.08, 1.53 1.23 * 1.02, 1.48 1.42 ** 1.18, 1.70 1.60 ** 1.19, 2.14 1.48 ** 1.24, 1.28
September i nta ke 1.26 * 1.05, 1.52 1.22 * 1.00, 1.49 1.16 0.96, 1.41 1.16 0.88, 1.54 1.27 ** 1.05, 1.26 Independent variables Model 1
a
Reference period