Analysis of the Third National Health and
Nutrition Examination Survey (NHANES III)
Using Expert Ratings of Job Categories
Jennifer C. D’Souza,PhD,1Robert A. Werner,MD,1W. Monroe Keyserling,PhD,2
Brenda Gillespie,PhD,3Randall Rabourn,MS,2,4Sheryl Ulin,PhD,2,4
and Alfred Franzblau,MD1
Background Few epidemiologic studies have addressed the exposure–response relation-ships between work activities and symptomatic knee osteoarthritis (OA). This analysis used data from a national survey and ergonomists’ ratings to address this issue.
Methods Interview and knee X-ray data were obtained from the Third National Health and Nutrition Examination Survey. Occupational ratings were obtained using ergonomists. A weighted logistic regression was used.
Results Among men, a significant exposure–response relationship was found between symptomatic knee OA and kneeling. In both genders, there was a significant trend in heavy lifting and severe symptomatic knee OA. Approximately 20.7% of knee OA can be attributed to kneeling>14% of the workday among men.
Conclusions The significant exposure –response relationships suggest that modest reductions in certain occupational activities can reduce the burden of knee OA. The study was limited by unvalidated expert ratings. Research is needed to identify hazardous characteristics of work activities and to clarify exposure–response relationships. Am. J. Ind. Med. 51:37–46, 2008.ß2007 Wiley-Liss, Inc.
KEY WORDS: knee osteoarthritis; lower extremity; occupational epidemiology; NHANES III
INTRODUCTION
The associations between knee osteoarthritis (OA) and certain occupations (e.g., construction, floorlayers) and work activities (e.g., kneeling, heavy lifting) are supported by many epidemiologic studies [Vingard et al., 1991; Cooper
et al., 1994a; Coggon et al., 2000; Jensen et al., 2000; Sandmark et al., 2000; Holmberg et al., 2004]. However, these studies were limited by the method of exposure assessment. Weaknesses in the exposure assessment in the epidemiologic literature of work-related lower extremity musculoskeletal disorders have been described [D’Souza et al., 2005].
A limitation of the exposures assessment used in previous epidemiologic studies is the use of dichotomous exposure categories. This makes it difficult to assess possible exposure–response relationships and/or identify thresholds of hazardous exposure levels. Improving exposure assess-ment will further the understanding of the relationship between occupation and knee OA, and help suggest changes to workplaces that could reduce overall burden of knee OA. Obtaining valid, reliable, quantitative, and individual-level data on workplace exposure to knee OA risk factors remains a challenge for occupational epidemiologists.
2007 Wiley-Liss, Inc. 1
Department of Environmental Health Sciences, The University of Michigan School of Public Health, Ann Arbor, Michigan
2
Department of Industrial and Operations Engineering,The University of Michigan College of Engineering, Ann Arbor, Michigan
3
Department of Biostatistics, The University of Michigan School of Public Health, Ann Arbor, Michigan
4
Center for Ergonomics,The University of Michigan, Ann Arbor, Michigan
*Correspondence to: Alfred Franzblau, M6023 SPH II, 109 South Observatory, Ann Arbor,
MI 48109-2029. E-mail: afranz@umich.edu
Accepted 12 July 2007
Recently, Jensen [2005] examined the exposure– response relationship between knee-straining work and self-reported knee symptoms and radiographic knee OA, among floor layers, carpenters, and compositors (i.e., primarily office workers). By videotaping workers, the study quantified the amount of knee-straining work associated with the most frequent work tasks in each of the job groups. The study’s results showed exposure–response relationships between amount of knee-straining work and knee symptoms (significant), and radiographic knee OA (non-significant).
The present paper addresses the exposure–response relationship between work activities and knee OA by analyzing the Third National Health and Nutrition Examina-tion Survey (NHANES III), and using expert ratings for exposure assessment. Using ergonomists’ knowledge and experiences to evaluate levels of work activities may be suitable for epidemiologic studies because it avoids the bias possible in self-reported exposures yet is relatively quick and feasible when compared to objective, quantitative measure-ments. This method was previously examined by inviting expert ergonomists to rate the 40 job categories used in the NHANES III [D’Souza, 2006].
The main objective of this analysis was to examine exposure–response relationships between occupational physical activities and symptomatic knee OA by analyzing expert ratings in combination with knee radiograph data from NHANES III.
METHODS
Description of NHANES III Data Used
The NHANES III was a national cross-sectional survey of the civilian, non-institutionalized, United States popula-tion. A large portion of the data is publicly available. Subjects received a household interview and a portion of the subjects were invited for a physical examination.
The analysis reported here used the subset of subjects who received knee X-rays (N¼2,589). All subjects who were aged 60 years and older and who received a physical exam were invited to have their knees X-rayed while in the supine position. These X-rays were read and scored for a variety of radiographic features, including sclerosis and chondrocalcinosis, and were given a Kellgren Lawrence (KL) score. The KL Score accounts for the presence and severity of osteophytes and sclerosis in the knee and ranges from 0 (normal) to 4 (large osteophytes, severe sclerosis) [Kellgren and Lawrence, 1957]. The KL Scores as well as ratings of other radiographic features of the knee X-ray were obtained from the knee osteoarthritis X-ray data file [US-DHHS, 2001]. Since the knee radiographs were non-weight bearing, the KL Score in the NHANES III data did not account for joint space narrowing, which is usually included in the score. Joint space narrowing gives an indication of the
degree of cartilage degeneration. Thus excluding this feature may lead to some knees being assigned a lower KL score despite severe cartilage degeneration.
Symptomatic knee OAwas defined as: KL Score2 in at least one knee and self-reported knee symptom(s) in the corresponding knee; or knee replacement surgery. Severe symptomatic knee OA was defined as: KL Score 3 in at least one knee and self-reported knee symptom(s) in the corresponding knee; or knee replacement surgery.
Data from the physical exam data file was used to obtain subjects’ current height, weight, body mass index (BMI) and presence of Heberden’s nodes [US-DHHS, 1996]. Heber-den’s nodes were of interest because it is sometimes considered a marker of general susceptibility to osteo-arthritis.
Subjects’ identification numbers were also linked to the Household Adult Data File, which contains data from the household interview. From this data file, the following variables were obtained (all self-reported): current job, longest held job (including years in longest held job), knee symptoms (stiffness, pain, swelling), current sports activities, rheumatoid arthritis, and smoking history (i.e., ever smoke100 cigarettes and pack-years), weight at age 25 years and weight 10 years ago.
This analysis was restricted to subjects who were in their longest held job for at least 5 years, did not report physician-diagnosed rheumatoid arthritis and had a KL score in at least one knee, or knee replacement surgery. Only exposures from the subjects’ longest held job were considered in this analysis. Using exposures from subject’s current job may not be valid since subjects’ current job may be influenced by subjects’ present health status. For instance, subjects who have knee OA may have switched to a less physically demanding occupation, and thus assessing exposures from their current job would not correctly reflect the exposures prior to their development of knee OA. In addition, only 21% (n¼500) of the subjects reported having a current job, which was expected given that all subjects were age 60 years or older. An analysis using subjects’ current occupational exposures would substantially reduce the sample size and may result in a biased sample.
NHANES III interviewers obtained subjects’ longest held job by asking them the question ‘‘What kind of work were you doing the longest?’’ Subjects’ answers were coded using the 3-digit 1980 Census Job Codes (n¼ 900). In order to protect participants’ identities, the individual, 3-digit job codes were collapsed into 40 job categories that are in the publicly available NHANES III data.
included: jogging/running, bicycling, swimming, aerobic dancing, dancing, calisthenics, garden/yard work or lifting weights.
Exposure Ratings
Occupational physical exposures were assessed using expert consensus ratings. Five ergonomic ‘‘experts’’ were invited to rate the NHANES III job categories with regards to what percent of the work day is spent in six activities. The ergonomic experts were selected based upon their extensive experience in rating jobs. Three out of the five experts were based in academic settings. One expert was an ergonomic consultant and one expert was an ergonomics researcher at a government agency. The experts’ years of professional experience in the field of ergonomics/occupational health (including job analysis) ranged from approximately 11 years to over 25 years, with an approximate mean of 19 years of experience. All were Certified Professional Ergonomists.
Job activities
The following six categories of job activities were chosen as risk factors based upon the support of previous epidemiologic literature for an association with knee osteoarthritis: (1) sitting, (2) standing, (3) walking/running, (4) carrying/lifting a heavy load (>10 kg) (abbreviated as ‘‘heavy lifting’’), (5) kneeling, squatting, stooping, and crawling (abbreviated as ‘‘kneeling’’), and (6) working in a cramped space. The previous evidence was strongest for knee bending activities (i.e., kneeling and squatting) and heavy lifting [Anderson and Felson, 1988; Felson et al., 1991; Cooper et al., 1994a; Cooper et al., 1994b; Coggon et al., 2000; Lau et al., 2000]. Positive associations, though not always significant, have been observed between knee OA and standing and walking/running [Coggon et al., 2000; Sand-mark et al., 2000; Yoshimura et al., 2004]. No studies have examined the association between working in a cramped position and the risk of knee OA. However ‘‘working in a cramped position’’ may also entail knee bending and thus was also considered in the analyses presented below. Refer to D’Souza [2006] for further detail.
The experts rated these activities on an 11-point scale ranging from 0 to 100, with 10 unit intervals. Each unit represented 10% of the work day.
Assessment of misclassification
Ideally the expert consensus ratings would be based upon subjects’ specific job titles, rather than the broad job categories. At the time the expert consensus ratings were being performed, the subjects’ job titles were unavailable and it was uncertain whether these data could be made available. However, after the expert consensus ratings were developed
using the job categories, the job titles were made available. These job titles were used to roughly assess the degree of misclassification. Two ergonomic experts rated the job titles using a reduced rating scale (5-point scale) that could be cross-walked to the 11-point scale. The analysis showed relatively small amounts of misclassification using the job category ratings [D’Souza, 2006]. Although the job title ratings would be less prone to misclassification, the expanded rating scale of the job category ratings was felt to be a greater strength and thus only the results using the job category ratings are presented.
Statistical Methods
A weighted (sampling weights provided by NHANES III), multiple logistic regression approach was used to estimate odds ratios and 95% confidence intervals (CI), while adjusting for covariates. The primary outcome used in this analysis was symptomatic knee OA. All analyses were adjusted for age, gender, smoking history, current BMI, and BMI at age 25 years.
Since, age, gender, and weight are highly associated with symptomatic knee OA a more detailed analysis was performed in order to correctly model the relationship between symptomatic knee OA and these covariates. For age, transformations of age (e.g., log(age)) and squared terms were tested and evaluated in gender-specific models. Various combinations and transformations of weight and height were also tested in gender-specific models. These models were evaluated based upon: (1) the generalized R-square, (2) graphical methods (categorizing the variable into deciles/ quartiles, then plotting the percent symptomatic knee OA in each category), (3) a model or a term’s significance (Wald Chi-square and difference between 2 Log-like-lihoods) (4) and its effect on the OR estimates of the occupational activities (10% change). It was found that the linear term for age and BMI (weight/height2) were adequate [D’Souza, 2006].
Heberden’s nodes were highly prevalent in this popu-lation (57.9% Heberden’s nodes in one or both hands) and were not associated with knee outcomes and thus were not adjusted for in the analysis. Other potential confounders were identified and evaluated based upon previous literature, a backwards/forward model selection, and if inclusion in the model altered the odds ratios of the occupational activities by more than 10%.
variable. Then odds ratios were compared using dummy categorical variables. It was observed that the estimates using the linear term did not always agree with the dummy variables. As a result, the dummy variables are used to report associations. Influence plots were also examined to detect outlying observations (e.g., Pearson Residual, Deviance Residual). Each job activity was analyzed separately.
Analyses were performed using SAS version 9.1.3 using ‘‘proc survey’’ procedures, and SAS-callable SUDAAN v. 9.0.
Population attributable risk (PAR)
Since the NHANES III was a complex sample survey of the general population, it was possible to calculate a PAR. This was carried out using the following equation by Rothman and Greenland [1998] (p. 296, Eqs. 16–24):
PAR¼ Number Exposed Cases
Total Number of Cases
OR
adjusted estimate1
ORadjusted estimate
Results
Descriptive Statistics
The knee X-ray data file contained 2,589 subjects. Subjects who had knee replacement surgery performed in one (n¼33) or both knees (n¼11) were assigned a KL Score of 4. Some subjects (n¼163) were not able to have their knees X-rayed. After excluding subjects who reported having spent less than 5 years in their longest held job and/or also reported rheumatoid arthritis, 1,970 subjects were available for analysis.
The mean age was 70.6 years and ranged between 60 and 90 years old. The mean BMI was 27.1 and ranged between 11.7 and 60 kg/m2. Fifty-six percent of the subjects reported that they had smoked more than 100 cigarettes. Heberden’s nodes were found in 57.4% of the subjects (Table I).
Three hundred fourteen subjects had a KL score greater than or equal to 2 and self-reported symptoms in the corresponding knee, in at least one knee, including those with knee replacement (the definition of symptomatic knee OA used in this analysis). These were compared to 966 subjects who had a KL score less than 2 and no self-reported knee symptoms in both knees.
Subjects’ exposure ratings are displayed in Figure 1 using box plots. Sitting encompassed a much greater range of values than did the other activities. Kneeling, heavy lifting and working in a cramped space (‘‘cramped’’) had much smaller range then the other activities. Categories were formed based upon exposure quartiles and dummy variables were used in the model. Fewer women were in the highest exposure quartiles than men.
Unadjusted Analyses
In the unadjusted analyses, age, gender, current BMI, BMI at age 25, and BMI 10 years ago were significantly associated with symptomatic knee OA (Table II). Age, gender, ever smoke greater than 100 cigarettes (‘‘smoking history’’), current BMI and BMI at age 25 years were included in the final base model (Table II). When BMI 10 years ago was included in the model, the generalized R2 increased by less than 0.01 and did not significantly improve the model. Furthermore, the models including BMI 10 years ago did not show a significant difference in the estimates of association. For these reasons, BMI 10 years ago was not included in the final model.
Current sports participation was associated with a non-significant decrease in odds of symptomatic knee OA, among men (OR¼0.88, 95% CI: 0.53, 1.46). But among women there was a slight increase in odds of symptomatic knee OA associated with current sports participation, but this was not significant (OR¼1.03; 95% CI: 0.70, 1.51). When current sports participation was included in the model, the associations between occupational activities and sympto-matic knee OA changed slightly (<10%) and in no clear direction. As a result, it was excluded from the final model.
Symptomatic and Severe Symptomatic
Knee OA (Kellgren Lawrence Score
2
and Knee Symptom(s))
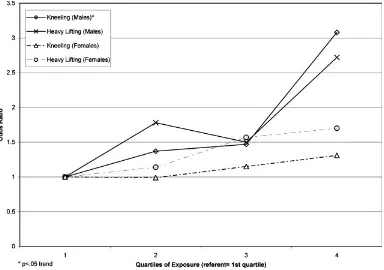
[image:4.592.305.544.114.274.2]Among women, standing was the only activity that showed a significant association (3rd quartile vs. 1st quartile, OR¼2.28; 95% CI: 1.09, 4.77). For men, significant associations were seen for kneeling (4th quartile vs. 1st quartile, OR¼3.08; 95% CI: 1.31, 7.21) and heavy lifting (4th quartile vs. 1st quartile; OR¼2.72; 95% CI: 1.14, 6.50) (Table III). Also, among men, a significant trend was observed between kneeling and symptomatic knee OA TABLE I. Description of Eligible Subjects (n¼1,970)
Variables
Weighted mean
or % (n) Range
Gender
Male 47.7% (1,054)
Female 52.3% (916)
Age (years) 70.6 60, 90
Current BMI (kg/m2) 27.1 11.7, 60
BMI10 years ago 25.8 16, 60.9
BMI at age 25 years 22.4 12.6, 55.1
Smoked100 cigarettes 56.2% (1,092)
Mean pack-years 5.22 0, 150
Years in longest held job 26.2 5, 75
(Fig. 2). In both men and women, an increasing trend in odds ratios was observed in kneeling and walking, but the trend was not significant and the confidence intervals were wide.
Examination of the residuals did not indicate a noticeable shape to the exposure–response relationships.
[image:5.592.140.463.86.325.2]Diagnostics showed two to three observations that the models clearly did not explain very well. When these observations were excluded from the analysis, the odds ratios appeared to slightly strengthen, but the significance did not change for any of the occupational activities.
TABLE II. Unadjusted Analyses: Covariates and Mean Occupational Ratings
Risk factor
Subjects without
symptomatic OA% or mean Symptomatic knee OA% or mean Odds ratio (95%CI)
a: Covariates
Age (per year) 69.6 years 72.4 years 1.06 (1.03, 1.08)
Gender (referent group¼male) 48.9% female 60.9% female 1.63 (1.02, 2.62)
Current BMI (per kg/m2) 25.8 kg/m2 30.1kg/m2 1.19 (1.13, 1.25)
BMI10 years ago (per kg/m2) 24.8 kg/m2 27.9 kg/m2 1.15 (1.10, 1.19)
BMI at age 25 years (per kg/m2) 21.9 kg/m2 23.4 kg/m2 1.11 (1.06, 1.16)
Ever smoke100 cigarettes (referent¼no) 60.1% 51.8% 0.71 (.46, 1.11)
Per pack-year 133.5 pack-years 69.07 pack-years 0.99 (0.99, 1.00)
Heberden’s nodes (referent¼none) 57.7% yes 52.6% yes 0.81 (0.55, 1.22)
Current sports/activities participation (referent¼no) 52.6% yes 50.5% yes 0.91 (0.66, 1.27) Occupational activities (% of work day) Subjects without
symptomatic OA
Symptomatic knee OA Odds ratio associated with10% increase (95%CI) b: Mean occupational ratings
Sitting 46.5 38.4 0.83 (0.75, 0.92)
Standing 27.3 31.0 1.34 (1.10, 1.63)
Walking 20.2 22.9 1.43 (1.15, 1.77)
Kneeling 7.4 8.9 1.29 (1.10, 1.51)
Heavy lifting 8.9 10.8 1.25 (1.12, 1.39)
[image:5.592.53.546.480.730.2]Working in a cramped space 4.6 5.5 1.21 (.99, 1.48)
TA B L E II I. A d ju st ed Od d s of K nee O A Associated W it h Occu pat iona lA ct ivit y (Ex pos ur e Quar tiles ) a Sy mp to mat ic k n e e OA ,O R (95% C I) S e ve re sym pt o mat ic kn e e OA ,O R (95% C I) Job ac ti vi ty (c at e g o ri ze d b y qu ar ti le s ,% o f w o rk day ) Fe ma le (3 95 he al th y ; 17 3 k ne e OA) (R 2 (bas e) ¼ 0. 18 7 ) Mal e (5 7 1 h e a lt hy ; 1 4 1 k n e e OA) (R 2 (bas e) ¼ 0. 11 2) Al l (R 2 (bas e) ¼ 0 .1 63) F e ma le (9 3 s e ve re k n e e OA ) (R 2 (bas e) ¼ 0. 16 5 ) Mal e (55 s e ve re k n e e OA) (R 2 (bas e) ¼ 0. 08 4) All (R 2 (bas e) ¼ Sitting < 2 2 1. 0 1. 0 1. 0 1. 0 1. 0 1. 0 22 to 3 2 1. 10 (0 .4 6, 2 .5 9) 0 .4 2 (0. 18 ,0 .9 6 ) 0 .6 8 (0 .3 9, 1. 18 ) 1. 2 4 (0. 6 7, 2 .3 2) 0. 2 5 (0 .0 8 ,0. 7 2 ) 0 .6 9 (0. 3 32 < to 5 4 1. 11 (0 .4 0, 3 .0 4 ) 0 .5 0 (0. 16 ,1 .5 4) 0. 74 (0 .3 4 ,1 .6 0) 1. 13 (0. 3 6 ,3 .5 2) 0. 41 (0 .0 9, 2 .5 3 ) 0 .7 5 (0. 2 5 54 < 0. 6 0 (0. 19 ,1 .9 3 ) 0 .4 6 (0 .1 7, 1. 2 2) 0. 5 0 (0. 2 0, 1. 2 5 ) 0 .5 2 (0. 17 ,1 .5 9) 0 .5 6 (0. 19 ,1 .6 4 ) 0 .5 1 (0. 17 p fo r tr en d 0 .2 4 0 .1 5 0 .1 5 0 .1 7 0 .6 8 0 .3 R 2 0. 19 4 0 .1 2 4 0. 16 6 0 .1 7 3 0. 0 9 5 0 .1 3 Standing < 2 6 1. 0 1. 0 1. 0 1. 0 1. 0 1. 0 26 to 3 0 1. 7 8 (0. 9 9, 3 .1 9) 1. 15 (0. 4 9 ,2 .7 1) 1. 4 2 (0. 8 8 ,2 .31 ) 2 .8 4 (1 .3 5 ,5 .9 5) 0 .9 5 (0. 3 0, 3 .01 ) 1. 6 8 (0 .8 1, 30 < to 36 2.28 (1 .0 9 ,4 .77) 1. 53 (0 .6 6 ,3 .55 ) 1. 9 2 (1 .0 6 ,3 .4 6 ) 3 .33 (1 .5 1, 7. 36 ) 1. 0 1 (0 .35 ,2 .9 1) 2. 0 8 (0 .9 4 36 < 1. 4 4 (0 .6 6 ,3 .1 4 ) 1. 3 7 (0 .68 ,2 .77) 1. 36 (0 .7 3 ,2.5 4 ) 1. 4 4 (0 .52, 3 .8 8) 0 .4 3 (0 .09 ,1 .9 6 ) 0 .89 (0 .3 1, p for tr en d 0 .29 0 .34 0 .22 0 .50 0 .36 0 .9 R 2 0 .1 9 7 0 .1 15 0 .1 6 6 0 .1 8 3 0 .0 8 7 0 .1 4 W al
king <16
When severe symptomatic knee OA was used as the outcome, the positive associations between knee OA and heavy lifting and with working in a cramped space grew stronger. The associations with kneeling remained relatively stable for both genders. For women, the associations with standing grew stronger and became statistically significant for the 2nd and 3rd exposure quartiles. The strengthening of the ORs also occurred in walking, but none of the ORs became statistically significant. For both men and women, a significant trend was observed between heavy lifting and severe symptomatic knee OA.
In women, a significant trend was observed between working in a cramped spaced and severe symptomatic knee OA. However such a trend between symptomatic knee OA and working in a cramped space was not previously evident. This appeared to be the result of two subjects who had relatively high sampling weights, had symptomatic knee OA and were in the lowest quartile of exposure. When they were excluded from the analysis, a clearer trend in the odds ratios was observed, but the trend was not significant.
For both symptomatic and severe symptomatic knee OA, a few occupational activities showed a slight decrease in odds in the highest quartile of exposure (e.g., standing; heavy lifting among women).
Population Attributable Risk
Using the adjusted OR from the NHANES III data and expert consensus ratings, approximately 20.7% of sympto-matic knee OA cases among males can be attributed to jobs requiring kneeling for>14% of the work day (e.g., Farm and nursery workers; Construction trades; Laborers, except construction). Among males who were in their longest held job for at least 5 years and had not reported rheumatoid arthritis, 30.7% of them were exposed to jobs that required kneeling for 14% of more of the work day. Therefore, occupational kneeling has a significant impact upon symptomatic knee OA in the United States male population. Among women this level of exposure was not very prevalent (5.43% of women), and thus ‘‘accounted’’ for a small proportion of symptomatic knee OA (1.2%). However, when standing was used as the exposure, approximately 19% of symptomatic knee OA among women can be attributed to standing for >30% of the work day (e.g., Miscellaneous administrative support occupations; Textile, apparel, and furnishings machine operators; Sales workers, retail, and personal services). This exposure level was much more prevalent among women (34.5%).
DISCUSSION
This analysis of the NHANES III knee radiograph and symptom data showed a significant exposure–response relationship between symptomatic knee OA and kneeling
among men. Among men and women, there was a significant trend between heavy lifting and severe symptomatic knee OA. Additionally, there appeared to be differential effects of occupational exposure by sex.
Exposure–Response Relationships
For many of the occupational activities there was no statistically significant trend. However, the results suggest that for some of the occupational activities that increasing exposure was associated with increased odds of symptomatic knee OA. For instance in women, standing and walking showed fairly increasing odds ratios with each quartile of exposure, which appeared to strengthen when severe symptomatic knee OA was the outcome. However, the wide confidence intervals made it difficult to confirm the presence and precise shape of the exposure–response relationships. As a result, this analysis could not show a definite exposure– response relationship for many occupational activities.
The lack of a significant trend for some activities may be a result of how activities were rated. For instance, kneeling for 30 min and kneeling for 3–10 min intervals may have different implications for knee OA risk. This may have also contributed to the inability to clearly determine exposure– response relationships.
Additionally, for some occupational activities there was an observed decrease in the odds associated with the highest quartile (e.g., standing, heavy lifting among women). These
estimates may be unstable due in part to the small numbers, or may represent different exposures than the lower end of the rating scale used by experts.
Ultimately, additional research is required in order to better describe the exposure–response relationships. As previously stated, this analysis showed a significant trend in ORs between kneeling and symptomatic knee OA among men and significant trend in ORs between heavy lifting and severe symptomatic knee OA among both men and women. These findings suggest that reductions of heavy lifting and kneeling can impact the overall prevalence of knee OA.
Gender Differences
This analysis also showed gender differences in the effects of occupational activities. For women, standing and walking were more strongly associated with symptomatic knee OA than kneeling and heavy lifting.
[image:8.592.109.493.86.356.2]Previous studies have found gender differences in the effect of occupational activities [Coggon et al., 2000; Lau et al., 2000; Manninen et al., 2002]. These gender differences can be due to a range of reasons. In this study population, women had a different exposure ‘‘profile’’ than men. Women’s exposures to kneeling and heavy lifting were strongly skewed towards the lower ratings while men had a greater range of exposures. This could, in part, explain the lack of significant associations of kneeling and heavy lifting among women. In addition, this analysis could not adjust for
a history of knee injury which could explain the observed gender differences.
Also of note, the generalized R-squares were larger for women (R2¼ 0.18) than for men (R2¼ 0.12). The contribution of occupational activities was fairly small in models for men and women. In both genders, symptomatic knee OA prevalence was far better explained by current BMI then occupational activities, which may be in part due to the fact that current BMI is influenced by knee OA status. This finding also shows the extremely strong impact of BMI. Overall, further study of these gender differences is needed.
Strengths
The analysis of NHANES III data has many advantages. Unlike some previous studies, the study population was not obtained from orthopedic clinics (representing severe cases of knee OA and/or referral biases). Thus the risk estimates obtained are less subject to potential bias. Furthermore, since the NHANES III study population was sampled in order to represent the United States population, these results can be generalized to this population.
Additionally, this analysis attempted to examine the exposure–response relationship between exposure to occu-pational activities and knee OA. Although the expert ratings were not without limitations, they provided more specific details regarding exposure levels when compared to some previous studies.
Limitations
This analysis had some major limitations: (1) the unvalidated exposure assessment, (2) the lack of adjustment for a history of knee injury, (3) the lack of adjustment for sports or other avocational activities, and (4) not accounting for jobs other than the longest held job. These limitations can potentially affect the PAR that was estimated.
The exposure assessment in this analysis was performed using expert ratings of subjects’ longest held job. This method of exposure assessment was developed and used due to the inability to contact subjects regarding their occupa-tional exposures, and in order to provide a method of exposure assessment for studies where higher quality exposure assessment is infeasible. Although the fact that our results were similar to results obtained using an independent source (US Department of Labor ratings), it is not a validation of the expert ratings [D’Souza, 2006]. Therefore, the magnitude and direction of potential bias of risk estimates is unknown.
Another major limitation in this analysis was the lack of adjustment for a history of knee injury. Previous studies have found a very strong association between a positive history of knee injury and subsequent knee OA. If occupations that require kneeling and heavy lifting are also associated with
increased risk of knee injury, then the risk estimates obtained in this analysis are overestimates. On the other hand, if the knee injuries are incurred through sports activities and subject’s longest held job is not physically demanding, these subjects will cause the risk estimate to be biased, most likely towards the null.
The NHANES III had only current activity/sport participation, which may be influenced by knee OA status. When it was examined, it did not alter the associations between knee OA and occupational activities. However, it is past sport/activity participation that is most relevant to this analysis. It is possible that these activities may have contributed to knee OA. Therefore not accounting for pre-vious sports participation may have also biased these results. This analysis used exposures from the subjects’ longest held job. However, this method did not take into account previous jobs, which may have had very different physical exposures. For instance, subjects who initially worked in a physically demanding job may have switched occupations due to work-related knee symptoms, and continued in the new job for the remainder of his/her working career. Therefore, the exposures of the longest held job may not be relevant to the subsequent development of knee OA. Also, this analysis did not include the effects of housework. Housework can involve a lot of kneeling and heavy lifting, and not accounting for it may have resulted in biased estimates if those in sedentary jobs were exposed to high amounts of housework (e.g., women).
A primary objective of the NHANES III was to describe the health of the United States population based upon a complex sampling scheme. Therefore, using the sampling weights provided by NHANES III, the proportion of knee OA cases attributed to kneeling can be estimated. However, these interpretations assume that there were no biases present [Rothman and Greenland, 1998]. As previously mentioned the comparison of the exposure ratings used in this analysis with the Department of Labor ratings is not a validation, and the misclassification could bias the PAR. Furthermore, in this study population work activities were correlated with one another (e.g., kneeling and heavy lifting) thus overestimating the PAR. Additionally, this analysis did not adjust for a history of knee injury which may have also affected OR estimates and thus the PAR. Overall, these results are further evidence of the strong association between occupational kneeling and symptomatic knee OA. Thus, occupational kneeling may be responsible for a large portion of symptomatic knee OA cases, but the PAR estimate must be interpreted with caution.
CONCLUSIONS
in both men and women. In this analysis, occupational activities had differential effects on men and women, suggesting that not just kneeling and heavy lifting need to be targeted to reduce prevalence of knee OA. However, the small numbers and resulting wide confidence intervals prevented further examination of exposure–response rela-tionships.
In conclusion, our results indicate that modifications to work methods are needed to reduce occupational risk of knee OA. Previous studies have shown an association with knee OA and kneeling, for as little as 30 min per day [Cooper et al., 1994a]. According to the NHANES III data and the expert exposure ratings, approximately 30% of the United States population age 60 years and older had a longest held job that required about 35 min or more of kneeling in a typical work day. These job categories included: private household occupations, farm and nursery workers, construction laborers, and other mechanics and repairers. In addition to reducing the prevalence of obesity, this analysis and the results of previous studies, underscore the importance of decreasing the amount of occupational kneeling, and perhaps other activities, in order to reduce the overall burden of knee OA. Additional studies are required in order to identify the specific hazardous characteristics of kneeling and heavy lifting. Furthermore, more studies are needed to clarify exposure–response relationships.
REFERENCES
Anderson JJ, Felson DT. 1988. Factors associated with osteoarthritis of the knee in the first national Health and Nutrition Examination Survey (HANES I). Evidence for an association with overweight, race, and physical demands of work. Am J Epidemiol 128:179–189.
Coggon D, Croft P, Kellingray S, Barrett D, McLaren M, Cooper C. 2000. Occupational physical activities and osteoarthritis of the knee. Arthritis Rheum 43:1443–1449.
Cooper C, McAlindon T, Coggon D, Egger P, Dieppe P. 1994. Occupational activity and osteoarthritis of the knee. Ann Rheum Dis 53:90–93.
Cooper C, McAlindon T, Snow S, Vines K, Young P, Kirwan J, Dieppe P. 1994. Mechanical and constitutional risk factors for symptomatic knee osteoarthritis: Differences between medial tibiofemoral and patellofe-moral disease. J Rheumatol 21:307–313.
D’Souza JC. 2006. Occupational activities and knee osteoarthritis: An analysis of the Third National Health and Nutrition Examination Survey (NHANES III) and Expert Ratings: The University of Michigan School of Public Health (http://wwwlib.umi.com/dissertations/fullcit/ 3224858).
D’Souza JC, Franzblau A, Werner RA. 2005. Review of epidemiologic studies on occupational factors and lower extremity musculoskeletal and vascular disorders and symptoms. J Occup Rehabil 15:129– 165.
Felson DT, Hannan MT, Naimark A, Berkeley J, Gordon G, Wilson PW, Anderson J. 1991. Occupational physical demands, knee bending, and knee osteoarthritis: Results from the Framingham Study. J Rheumatol 18:1587–1592.
Holmberg S, Thelin A, Thelin N. 2004. Is there an increased risk of knee osteoarthritis among farmers? A population-based case-control study. Int Arch Occup Environ Health 77:345–350.
Jensen LK. 2005. Knee-straining work activities, self-reported knee disorders and radiographically determined knee osteoarthritis. Scand J Work Environ Health 31(Suppl 2):68–74.
Jensen LK, Mikkelsen S, Loft IP, Eenberg W, Bergmann I, Logager V. 2000. Radiographic knee osteoarthritis in floorlayers and carpenters. Scand J Work Environ Health 26:257–262.
Kellgren JH, Lawrence JS. 1957. Radiological assessment of osteo-arthrosis. Ann Rheum Dis 16:494–502.
Lau EC, Cooper C, Lam D, Chan VN, Tsang KK, Sham A. 2000. Factors associated with osteoarthritis of the hip and knee in Hong Kong Chinese: Obesity, joint injury, and occupational activities. Am J Epidemiol 152: 855–862.
Manninen P, Heliovaara M, Riihimaki H, Suoma-Iainen O. 2002. Physical workload and the risk of severe knee osteoarthritis. Scand J Work Environ Health 28:25–32.
Rothman KJ, Greenland S. 1998. Modern epidemiology 2nd edition. Philadelphia: Lippincott-Raven.
Sandmark H, Hogstedt C, Vingard E. 2000. Primary osteoarthrosis of the knee in men and women as a result of lifelong physical load from work. Scand J Work Environ Health 26:20–25.
US-DHHS. 1996. U.S. Department of Health and Human Services (DHHS). National Center for Health Statistics. Third National Health and Nutrition Examination Survey, 1988–1994, NHANES III Exami-nation and Adult Interview Data Files (CD-ROM). Public Use Data File Documentation Number 76200. Hyattsville, MD.: Centers for Disease Control and Prevention, 1996. Available from National Tech-nical Information Service (NTIS), Springfield, VA. Acrobat .PDF format; includes access software: Adobe Systems, Inc. Acrobat Reader 2.1.
US-DHHS. 2001. U.S. Department of Health and Human Services (DHHS). National Center for Health Statistics. Third National Health and Nutrition Examination Survey, 1988–1994, NHANES III Knee osteoarthritis X-ray data file (Series 11, No. 11A). Hyattsville, MD: Centers for Disease Control and Prevention.
Vingard E, Alfredsson L, Goldie I, Hogstedt C. 1991. Occupation and osteoarthrosis of the hip and knee: A register-based cohort study. Int J Epidemiol 20:1025–1031.