14th International Conference on Wireless Communications, Networking and Mobile Computing (WiCOM 2018) ISBN: 978-1-60595-578-0
Quality of Experience-Driven Resource Allocation Optimized for
360-degree Video transmission over LTE Uplink
Junchao Yang1, Jiangtao Luo1 and Fuxing Yang1
ABSTRACT
As VR (Virtaul Reality) video become popular on User-Generated Content (UGC) platform, ever-increasing VR video need to be transmitted through the cellular network , However the VR video transmission imposes significant challenges since the radio resource limitation, especially for the uplink. Furthermore, transmission the overall VR video at same quality causes bandwidth waste since the VR video is partially viewed at the client side. This work proposed a practical way of VR video transmission through LTE based on the target of optimizing the whole Quality of Experience (QoE) of viewers. Since the viewports are distributed among the viewers and the accurate viewer viewport can hardly be predicted, in this paper the effect of video saliency and encoding distortion on the QoE is studied, we formulate the QoE as the summation of logarithmic function of encoding video tile rate, where the encoding video tile rate is constrained by the uplink rate of LTE, so the problem turns into allocate the resource for the each specific tile of each VR video under the limited bandwidth and which is formulated as a convex optimization problem. The proposed scheme strategically consider both saliency and encoding distortion caused by Equi-Rectangular Projection (ERP) of the encoding tile, and the final problem is solved by the optimization toolbox as relaxing part of the constraints. The simulation results show that our proposed scheme boost the QoE by at least 17% compared with the traditional schemes.
1. INTRODUCTION
In recent years, VR technology has been rapidly commercialized, a $120 billion market will be formed by 2020 as predicted in [1]. Thanks to the development of the VR display devices, Now users could experience the VR capabilities on the professional head-mounted displays (HMDs) such as HTC VIVE and Oculus Rift, and also could on their mobile devices by using the affordable VR devices (Samsung Gear and Google Cardboard). In the VR ecosystem, VR videos, also known as 360-degree or spherical videos play a critical role, which enable users to get the immersive video experience. Video content captured from multiple cameras is pre-stitched to a single 360-degree layout (i.e. spherical video), however the current video encoders operate on the two-dimensional rectangular image, a key step of the encoding chain is to project the spherical video onto the planar surface, and traditionally the Equi-Rectangular Projection (ERP) is chosen as the projection scheme (similar to the process of flattening the globe of Earth onto a two-dimensional map). After the projection, the Equi-Rectangular video is compressed by using standard encoders, such as H.264 and High Efficiency Video Coding (HEVC).
1
VR video content is currently served by the professional content providers such as NBC, news outlets (e.g., CNN) and User-Generated Content (UGC) platforms such as Facebook and YouTube. The development of the mobile device capable of recording high quality of VR video has resulted in increased amount of user generated VR video, the VR live broadcast on the UGC platforms become increasingly popular, with the help of the portable 360-degree camera (GoPro OMNI and the Samsung Gear 360, etc.) the common user can capture the 360-degree scene to upload the VR video through the wire/wireless network to UGC platforms, This content can be alive as well as on-demand for the viewers. Compared with conventional videos, the VR videos are extremely bandwidth intensive, since they require more data to cover all the spatial directions. For example, the recommended resolution in YouTube VR is 4K (3840×2160) pixels, which is four times as 1080p ratio of 1920×1080 [3]. while the increase in resolution certainly contributes to the growth of the video traffic, even the improved video coding (i.e. HEVC) could achieve 50% reduction in bit rate compared to the last generation codec, the current networks also need very carefully to deal with video delivery, especially for wireless networks such as cellular and WiFi, they may have trouble to meet the growing traffic demand, However the natural advantage of wireless network such as mobility and collaboration which makes it a more rational choice for VR video streaming, and it is predicted that as the mass deployment of the 5G networks [2], the VR services will be fully mobile and follow the user. As the progressive improvement of video codec and wireless transmission capacity, it is predicted that delivery this UGC type of VR videos through the wireless network is an inevitable trend. While for VR application, it is important to deliver high quality video to achieve a reasonable level of viewer QoE, For the downlink of VR video streaming [3], the concept of “tile” is introduced for the compressed and decompressed individually, each tile is transcoded to multiple quality, so the server could transmit different combination of the tiles according to the user channel quality and the perspective user viewport. Few work focus on the uplink of VR video streaming over wireless network, compare to the downlink VR video streaming, it is more challenging to deal with the uplink VR video streaming, first the user views cannot be obtained in advance, second, as the live demand, encode the video tiles into the multiple qualities is impractical, As far as we know, for uplink VR video streaming, there are few works focus on finding a practical and acceptable way to optimize the total user QoE under the limited bandwidth consumption. In this paper, we focus on the VR video streaming over the LTE uplink, for the first time, we try to maximize the quality for each VR video tile by dynamically optimize the resource allocation according to the channel quality, the probability of being viewed and the distortion caused by the compression, by encoding the tiles with high probability of viewed and high distortion happens at the high quality, which correspondingly aiming to optimize the total viewers QoE. The proposed scheme is formulated as a convex optimization problem and can be solved by convex optimization toolbox such as CVX [4].
2. RELATED WORKS
The improved mobile device computing capacity and the increased cellular network bandwidth which enable the mobile video streaming to be one of the most popular application in recent years, but transmitting the big volume of video data over the wireless network is still a challenge problem, especially the increasing demand of user trend to request higher video quality to satisfy the QoE. Many works focused on the video streaming over 4G network, [5] Presented a LTE Uplink scheduling scheme for the heterogeneous QoS (Quality of Service) requirements of multimedia traffics, Since the scheduling is performed over the frequency domain and the QoS is provided in the time domain (packet delay, jitter), they formulated it as a Joint Time and Frequency Domain Packet Scheduling problem, they proposed three algorithms to solve the problem, The first one is an approximation algorithm for the FDPS (Frequency Domain Packet Scheduling) problem without the maximum number of users constraint. The second routine selects users that will be scheduled on the next TTI and performs a first allocation. The last routine improves this allocation based on the potential zone concept.
[6] presented a systematic resource allocation and transmission optimization approach for the simultaneous streaming of user-generated video content, the centralized multi-user resource allocation problem and the distributed optimization of the video content at the mobile terminal was distinguished in the paper. Distributed QoE-based optimization is performed by each video producer in the terminal to decide on which video layers to transmit and their respective rates. While a greedy resource allocation algorithm was introduced to determine the resource share ratio of each user at each schedule round that maximizes the overall QoE. In [7] surveillance video uplink streaming over wireless network was investigated, the long-term bit-rate assignment for video encoding and the real-time packet scheduling in each OFDMA frame under the real-time constrain was separately studied to solve the global video uplink streaming problem. While for the 360-degree video streaming, most recent works focus on the downlink streaming [8-10], Qian [8] proposed a cellular-friendly streaming scheme, which only deliver the visible portion of the 360-degree video, they claimed that could reduce the bandwidth consumption by up to 80%, however, their scheme require the head movement prediction, which increase the complexity and only suitable for the unicast situation.
algorithm is presented to solve the problem which enable each SBS to autonomously decide the uplink and downlink resource allocation. They considered the processing delay and transmission delay in their solution, but failed to consider the character of VR video contend.
3. THE EFFECT OF SALIENCY AND ENCODING DISTORTION ON QAULITY OF 360–DEGREE VIDEO
A. Saliency of 360-Degree Video
In the last decades, many saliency models have been proposed for traditional 2D images, many study has shown that the saliency can be predicted using models of visual features (such as color, intensity and object). [11] have shown that when distortions happens in a more salient region, the subjective quality score of perceived video is much lower than the distortions happens in non-salient region, which means, the users are eager more clear details (i.e. higher data rate)on the salient region. Additionally, [12] studied the fixation prediction in the head-mounted virtual reality, their work has shown that the viewer fixation in 360-degree video can be predicted with saliency map, motion map and the viewer orientation, their work also shown that the salient regions are easier to attract the viewer fixation.
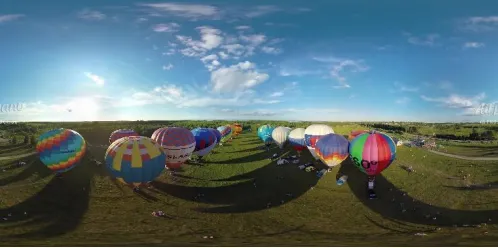
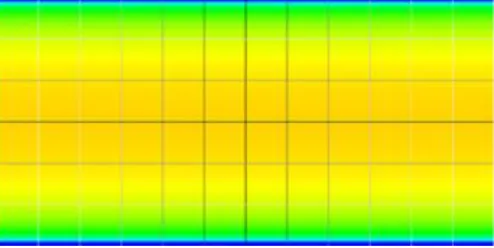
[image:4.612.173.422.557.681.2]According to the research [13], because of the limited bandwidths and the high video compression, video content is highly prone to visual distortions through bit errors and packet loss during transmission, the video quality is reduced sharply where the distortion happens in a more salient region. In our work, since each of the 360-degree video tile is encoded in different bitrate according to the resource allocation results from the eNodeB, the saliency of each tile region differ, by applying the saliency predictor [13], as shown in the Fig.1 and Fig.2, the region has more texture which is predicted as the more saliency part. After the prediction, the saliency score of the each tile region in the Equi-Rectangular frame is obtained. Our motivation is attempt to encode the high saliency tile at high bitrate during the encoding process, so that the eNodeB try to allocate more resource on those high saliency tiles, which result higher bitrate, finally when those encoded tiles transmitted through the network to the client side (i.e. HMD), the viewer can get better video quality on those high saliency region which eventually to achieve the purpose of improvement on the client side’s QoE.
Figure 2. Predicted saliency map.
B. The Encoding Caused Distortion of 360-Degree Video
In this paper, the ERP is chosen as the projection scheme, which is widely used in the 360-degree video encoding process, and the ERP has the advantages of being both rectangular and straightforward to visualize. It’s also relatively easy to manipulate using existing video encoder, however, when used for video transmission, it has serious problems. First, the poles get a lot of pixels, and the equator gets relatively few, A saturation map of ERP is shown as the Figure 3, it indicates a color-coded ratio of video pixel to display pixel density. The color coding goes from red to orange, yellow, green and finally blue. Green indicates an optimal pixel density ratio that’s near 1:1. Red, orange and yellow indicate insufficient density (too few video pixels for the available display pixels), and blue indicates wasted resources (too many video pixels for the available display pixels), the poles get a lot of pixels, and the equator gets relatively few. This is challenging, because spherical videos usually have their important content distributed around the equatorial regions (the middle), which is the viewer’s horizon. In addition, the spherical video after be projected to 2D plane, then is compressed by the existing video encoder (HEVC), the codec caused information loss is much higher around the equatorial regions than the polar regions. In order to have less information loss at the equatorial region, Similar as the strategy used in the saliency part, we introduced the equatorial weight of each tile according to their vertical position in the 2D plane attempt to encode those tile around the equatorial regions higher bitrate, which guarantee less information loss caused by the codec.
[image:5.612.165.412.551.675.2]4. SYSTEM MODEL AND PROPOSED RESOURCE ALLOCTION SCHEME
A. System Model and Scenario
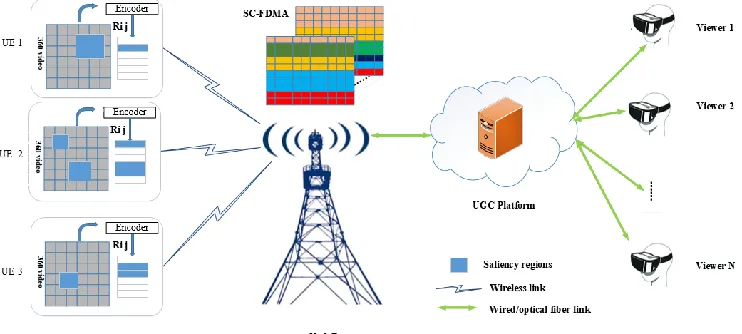
Without loss of generality, we consider a single cell LTE mobile system consisting of a single eNodeB and I UEs, those UEs produce the 360-degree video simultaneously which need to transmit to the sever/cloud through the LTE network, the system structure is shown as Fig.4. The physical layer of LTE uplink is based on the SC-FDMA technology, and the basic unit of the resource in the LTE system is a physical Resource Block (RB), The UL system bandwidth can be divided into N RBs, which is described by adjacent subcarriers and SC-FDMA symbols, where equal to 6 or 7 depends on whether an extended or normal the Cyclic Prefix (CP) is utilised. We assume a normal CP (i.e. equal to 7). Considering the allocated bandwidth B = 20 MHz, we obtain N = 100 available RBs to allocate to users at each TTI (Transmission Time Interval). In this work, we consider an infinitely backlogged model, all UEs continuously generate the video data, and there is always video data available to transmit through the eNodeB. Thus every time slot (TTI) the base station should schedule all the N RBs. And each UE have the ability to stitch the multiple cameras to a single 360-degree layout (the Equirectangle layout), and encode the Equirectangle layout in format of tiles at a target bitrate according to the allocation resource for each
tile. The Tilei,j is represent the specific tile j in i th 360-degree video, and the Ri,j is the
[image:6.612.113.484.362.529.2]target encoding rate of the Tilei,j.
Figure 4. The system structure.
B. Proposed Resource Allocation
according to the saliency value and vertical position of each tile. In this paper, we have the assumption that the UGC platform streaming the encoded 360-degree video tiles to the users without any packets lose and delay, so the QoE of users is mainly determined by the data rate of the received tiles. For the QoE driven purpose, We hope that all the tiles could encode to higher bitrate, but when transmitted the encoded tiles through the bandwidth limited LTE uplink, it’s obvious that the lower bitrate those tiles encoded, the system is more efficient which could serve more UE. Hence there is a tradeoff between the encoding rate of the tiles and the system efficiency. One way to accomplish both efficiency and fairness is to use utility functions that are both increasing and marginally decreasing. As a result, the slope of the utility curve decreases with an increase in the data rate. Choosing a marginally decreasing utility function also guarantees its strictly concavity which ensures the global optimality as well as uniqueness of the optimal solution. A logarithmic utility function [15] is both increasing and marginally decreasing.
ln
U R R
In our case, we suppose that there are I UE in the system, which means there are I 360-degree video need to be transmitted simultaneously through the LTE network, each 360-degree video is encoded as the format of tiles, each tile could encode and decode independently, the target bitrate for the total tiles are constraint by the total uplink bandwidth, the LTE uplink is divided by RBs, each has 180 KHz bandwidth with 12 subcarriers and 7 symbols in the frequency domain, and has a duration of 1ms in the time domain, also known as 1 TTI (Transmission Time Interval). The capacity of one RB is determined by the chosen MCS (Modulation and Coding Scheme), which can be expressed as bellow:
RB UL sc sybm
[image:7.612.142.452.418.710.2]CN N eff MCS
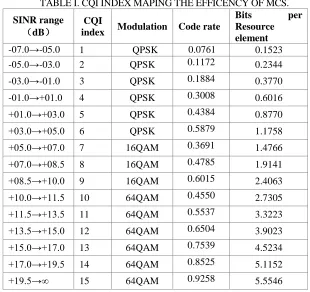
TABLE I. CQI INDEX MAPING THE EFFICENCY OF MCS.
SINR range (dB)
CQI
index Modulation Code rate
Bits per
Resource element
-07.0→-05.0 1 QPSK 0.0761 0.1523
-05.0→-03.0 2 QPSK 0.1172 0.2344
-03.0→-01.0 3 QPSK 0.1884 0.3770
-01.0→+01.0 4 QPSK 0.3008 0.6016
+01.0→+03.0 5 QPSK 0.4384 0.8770
+03.0→+05.0 6 QPSK 0.5879 1.1758
+05.0→+07.0 7 16QAM 0.3691 1.4766
+07.0→+08.5 8 16QAM 0.4785 1.9141
+08.5→+10.0 9 16QAM 0.6015 2.4063
+10.0→+11.5 10 64QAM 0.4550 2.7305
+11.5→+13.5 11 64QAM 0.5537 3.3223
+13.5→+15.0 12 64QAM 0.6504 3.9023
+15.0→+17.0 13 64QAM 0.7539 4.5234
+17.0→+19.5 14 64QAM 0.8525 5.1152
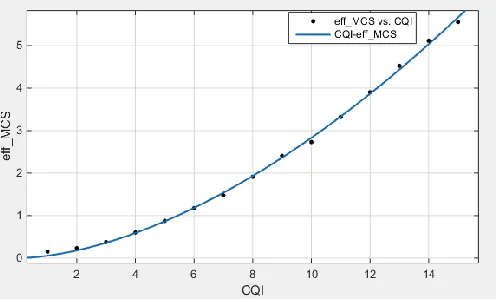
The efficiency of MCS various according to the channel quality indication (CQI) [16], and the mapping relation is shown in the Table 1. while the efficiency can be seen as a function of CQI, we adopt the following model to fit the efficiency with the respect to the CQI, Where a and b are two model parameters, equal to 0.05519 and 1.71 respectively, the root-mean-square-error (RMSE) of the curve fitting in Fig.5 is 6.612%:
b
f x a x
In this paper, we assume that the UE channel quality is not fluctuated too much in one second (i.e. 1000 TTI), hence the target bitrate for each tile could be formulated as the function of the number of RBs allocated by the LTE eNodeB in one second.
, ,
RB UL i j i j sc sybm
[image:8.612.182.430.221.372.2]R N N N eff MCS
Figure 5. Curve fitting of efficiency of MCS respect to CQI.
For each tile, the utility which contribute to the client side user QoE can be defined
as Ui,j(Ri,j), since the encoded Tile is immediately transmitted to the viewer through
network, without any video transcoding, the viewer received the whole 360-degree video tiles from the UGC platform without breaking the sense of presence. The objective is maximize the total utilities, so the original problem can be formulated as follow:
, , , , , , . . I Ji j i j i j i j i j
I J
i j r
i j
Maximize U R N C s t
N N
And Ni,j is the number of RBs allocate to the Tilei,j, Ci,j is the capacity of RBs
assigned to the Tilei,j, suppose that the each Tile is independent during the resource
allocation, the original problem is equal to the follow:
, , , , , , ,
, ,
, , , , ,
( ( ))
. .
{0,1}, , ,
, , ,
I J
RB UL
i j i j n sc sybm i j n i j n i j n N
i j n r
i j n i k n i n
Maximize U x N N eff MCS CQI
s t
x i I j J n N
CQI CQI CQI i I j k J
The xi,j,n is binary indicator, which indicate the nth RB is assigned to the Tilei,j or
function of the CQIi,j,n according to the Table 1 shown in part A. Since the Tiles in
the same UE surf the same channel quality at each schedule iteration, CQIi,j,n is
which equal to the CQI of UE I over the n th RB CQIi,n .
The problem turns to be a nonlinear integer programming problem, the objective
is to find the optimal assignment indicator xi,j,n, which maximize the total utility,
note that the xi,j,n is a three dimensional array. Until now the allocation scheme only
consider the channel quality of the UE, however for the respect to the video Tiles in the same UE, as we discussed in the section III, the saliency and the vertical position of the tile (i.e. equator bias) which at some extend will affect the viewer QoE, hence we take these two parameters as the combined weights of utility during the resource allocation, the goal is not only take the channel quality into consideration during the RB assignment, the saliency and vertical position are also needed at the same time. The final problem can be formulated as follow, and the solution is presented in next part. , , , , , , , , , , , , , , , , ( ( )) . .
{0,1}, , ,
, , ,
I J
RB UL
i j i j i j i j n sc sybm i j n i j n
i j n N
i j n r
i j n i k n i n
Maximize S V U x N N eff MCS CQI
s t
x i I j J n N
CQI CQI CQI i I j k J
C. The Problem Solution
The final problem is nonlinear binary programming problem, since the utility function is concave, which obey the disciplined convex programming rules, this problem is also called as the mixed-integer models disciplined convex problem (MIDCP) [4], and this kind of problem can be solved by convex optimization tools such as CVX.
Note that the when we apply the CVX solver to solve the problem at each round, the binary variable can be 1000*N*I*J, i.e. the number of RBs in each TTI multiply the number of TTIs in each round which is the total number of RBs in each round, and multiply the dimensions of the video Tiles. This takes a long time to find the optimal solution of the problem in each round, the complexity at worst case is
O((1000*N)I*J). Since we assume that the CQI of the UEs in one round (i.e. 1
second) is not fluctuated too much, and we relax the constraint of the assignment
indicator 0<xi,j,n< 1, so that we solve the following problem instead of the former
one. , , , , , , , , , , , , , , , , , , ( ( )) . .
0 1, , ,
1
, , ,
I J
RB UL
i j i j i j i j n sc sybm i j n i j n
i j n N
i j n TTI
I J i j n i j
i j n i k n i n
Maximize S V U x N N eff MCS CQI
s t
x i I j J n N
x
CQI CQI CQI i I j k J
Note that the optimal solution xi,j,n is a between 0 and 1, when we get the
proportion index(i.e. xi,j,n), and the complexity at worst case is O(NI*J), which
dramatically reduce the complexity of the solving the problem. After the resource allocation, each tile is encoded at the target bitrate by the encoder.
5. EXPERIMENT SETUP AND RESULTS
In this section the proposed QoE-driven resource allocation scheme is evaluated by plenty of simulations. In our simulations, four uncompressed 360-degree video trace is used to compete for the limited wireless resources: Academic- Building(Video1), Sward(Video2), Runner(Video3) and Basketball Court(Video4) from the STJU immersive video sequence Dataset[17], 100 frames of each video sequence is extracted for the simulations, The HEVC reference software (HM) version 16.7 is used as the video encoder[18], and a higher number of tiles in general might lead to an increased user experience, but decreases the efficiency of the codec[3], in this paper we use the 3×3 tiling scheme. The LTE simulation parameter is set as the presented in Section IV.
The proposed and other resource allocation schemes is summarized in the Table II, we compare the proposed scheme with other three schemes, the Proportional Fair (PF) scheduler [19] works by scheduling a user when its instantaneous channel quality is high relative to its own average channel condition over time. The Maximum Throughput (MT) scheduler [20] aims to maximize the overall throughput of eNB. It allocates each RB to the user that can achieve the maximum achievable rate in the current TTI. The Round Robin (RR) scheduler is probably the simplest scheduler found in the literature. It works by dividing the available resources among the user, and allocate the RBs to user by the round robin scheme.
TABLE II.COMPARISON OF RA SHCEMES.
Resource allocation Scheme Tile encoding rate
Proposed QoE-driven Adaptive, QoE-driven
Proportional Fair Distributed, fairness guaranteed
Maximum Throughput Distributed, throughput-driven
Round Robin Distributed, fairness guaranteed
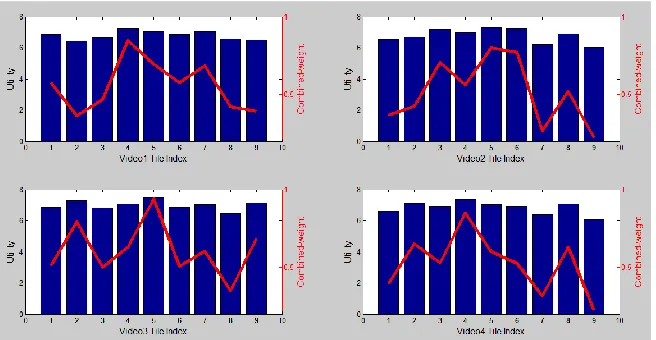
Figure 6. Comparison weighted-utility of videos with different schemes.
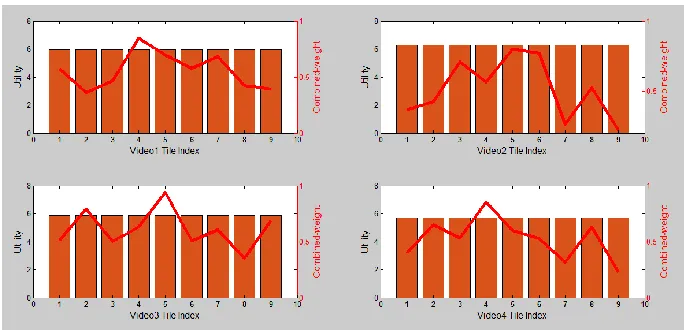
[image:11.612.135.463.512.682.2]Since our motivation is to achieve the total optimal QoE at the client side by assigning the optimal tile data rate according to the weight of probability of being viewed and the distortion caused by the compression, so we compared the tiles encoding data rate of four videos by applying four RA scheme respectively, we extracted the same video frame from each encoded video sequences, then evaluated the tile data rate distribution along with the combined weight differ, as shown in Fig.7, Fig.8, Fig.9, Fig.10, the left y-axis and the right y-axis of the figure represent the utility of the tiles (i.e. Log of tile data rate) and the combined weight of tiles respectively, the x-axis is the video tile index, the red broken line corresponding to the combined weight of tiles. Fig.7 shows that the utility of tile changes according to the combined weight when applied the proposed scheme, the tiles with highest weight of 4 videos the utility can reach at 7.2, 7.4, 7.6 and 7.0 respectively. Even the tiles with the lowest weight the utility can achieve 6.2, 6.0, 6.5 and 6.1 respectively. Fig.8 and Fig.9 show that the PF and the TM scheme, the utility is only fluctuated slightly, which means both of them could not satisfy the demand of providing higher quality video at the higher priority area (i.e. tiles which attract more the viewers’ attention), while the proposed scheme by sacrificing the utility of tiles with lower priority to guarantee the quality of tiles with higher priority.
Figure 8. Video tile utility distribution with PF scheme.
Figure 9. Video tile utility distribution with TM scheme.
Figure 10. Video tile utility distribution with RR scheme.
6. CONCLUSION
[image:12.612.126.470.443.608.2]weight of the 360-degree video tile is introduced during the encoding process, while the encoding rate of video tiles is determined by results of resources allocation in LTE uplink. Unlike the traditional way, the original 360-degree video directly encode in the format of tiles at the target bitrate, without transcoding in the cloud, then those video tiles are streamed to the corresponding viewer, thus the video tile data rate is the most key factor which affect the total QoE in those scenarios, In the paper, we formulate this problem as a convex problem, by relaxing the constraint, the problem turns to a nonlinear integer programming problem which can be solved by the optimization toolbox.
ACKNOWLEDGMENT
This work is supported in part by the Graduate Scientific Research Program of Chongqing under Grant CYB17133 and Doctoral Graduate Students Training program of Chongqing University of Posts and Telecommunications under Grant RC2016008.
REFERENCES
1. 2015. Augmented/Virtual Reality to hit $150 billion disrupting mobile by 2020 [Online]. Available: http://www.digi-capital.com/news/2015/04/augmentedvirtual-reality-to-hit-150-billion-disrupting-mobile-by-2020/#.WrDR2PknY5o
2. NGMN 5G White paper. document Rec. Next Generation Mobile Network Allince. Feb. 2015. 3. R. A. Patrice, M. Jean-François, V. Nico, Interactive Omnidirectional Video Delivery: A
Bandwidth-Effective Approach[J], Bell Labs Technical Journal, 2012:135-47. 4. Accessed March 2018. [Online]. Available: http://cvxr.com/cvx/
5. A. Ragaleux, S. Baey, M. Karaca. Standard-compliant LTE-A Uplink Scheduling Scheme with Quality of Service[J]. IEEE Transactions on Vehicular Technology, 2017.
6. A. El Essaili, L. Zhou, D. Schroeder. QoE-driven live and on-demand LTE uplink video transmission[C]//Multimedia Signal Processing (MMSP), 2011 IEEE 13th International Workshop on. IEEE, 2011: 1-6.
7. P. H. Wu, C. W. Huang, J. N. Hwang, et al. Video-quality-driven resource allocation for real-time surveillance video uplinking over OFDMA-based wireless networks[J]. IEEE Transactions on Vehicular Technology, 2015, 64(7): 3233-3246.
8. F. Qian, L. Ji, B. Han, G. Vijay. Optimizing 360 Video Delivery over Cellular Networks[C]. Proceedings of the 5th Workshop on All Things Cellular: Operations, Applications and Challenges (ACM, 2016), 2016:1-6.
9. C. Xavier, S. Gwendal, D. Alisa, et al. Viewport-Adaptive Navigable 360-Degree Video Delivery[C]. 2017 IEEE International Conference on Communications (ICC), pp. 1-7.
10. M. Chen, S. Walid, C.Yin. Virtual Reality over Wireless Networks: Quality-of-Service Model and Learning-Based Resource Management[C] arXiv preprint arXiv: 1703.04209 (2017).
11. U. Engelke, M. Barkowsky, P. Le Callet, et al. Modelling saliency awareness for objective video quality assessment[C]//Quality of Multimedia Experience (QoMEX), 2010 Second International Workshop on. IEEE, 2010: 212-217.
12. C. L. Fan, J. Lee, W. C. Lo, et al. Fixation Prediction for 360° Video Streaming in Head-Mounted Virtual Reality[C]//Proceedings of the 27th Workshop on Network and Operating Systems Support for Digital Audio and Video. ACM, 2017: 67-72.
13. X. Hou, J. Harel, and C. Koch, Image Signature: Highlighting Sparse Salient Regions [J]. IEEE Trans. Pattern Anal. Mach. Intell. 2012:34(1): 194-201.
14. K. Davaslioglu, E. Ayanoglu. Efficiency and fairness trade-offs in SC-FDMA schedulers [J]. IEEE Transactions on Wireless Communications, 2014, 13(6): 2991-3002.
16. LTE-Evolved Universal Terrestrial Radio Access (E-Utra); Physical Channels and Modulation, document Rec. 3GPP Ts 36.211, Jan. 2011
17. X. Liu, Y. Huang, L. Song, R. Xie, X. Yang, The SJTU UHD 360-Degree Immersive Video Sequence Dataset, the 17th International Conference on Virtual Reality and Visualization (ICVRV2017), 2017: 21-22.
18. Accessed March 2018. [Online]. Available: https://hevc.hhi.fraunhofer.de/svn/svn_HEVCSoftware/ tags/HM-16.7/
19. S. B. Lee, I. Pefkianakis, A. Meyerson, et al. Proportional fair frequency-domain packet scheduling for 3GPP LTE uplink[C]//INFOCOM. IEEE, 2009: 2611-2615.