2018 3rd International Conference on Information Technology and Industrial Automation (ICITIA 2018) ISBN: 978-1-60595-607-7
A Computational Model Based on Intelligence
Computation for Classifying Enhancers
Qingling Yan, Xuan Xiao and Wangren Qiu
ABSTRACT
As a crucial DNA element, enhancer usually can be classified as strong enhancer or weak enhancer. To make some improvement for identifying enhancers and their subsets, the paper constructed an intelligent computational model by extracting features from bi-profile Bayes and pseudo amino acid components. Moreover, the combination of features, jackknife cross validation and Support Vector Machine were tested on the rigorous dataset. It has been achieved that accuracyof 77.30% on identifying enhancers and non-enhancers, and accuracy of 68.22% on classifying strong enhancers and weak enhancers. Eventually, the performance we achieved is satisfactory.1
INTRODUCTION
DNA elements play an essential role in comprehending the gene expression pattern of diseased as well as healthy cell, particularly, enhancers control the process of gene expression. There are more and more effective computational models have been introduced in the regard, for example, repDNA[1], Pse-in-One [2], iDHS-EL[3] and iDNA-KACC[4]. Likewise, ChromeGenSVM was proposed by using genetic algorithm to identify enhancers and non-enhancers [5]. RFECS[6]and EnhancerFinder were developed for identification of enhancers. Then, Ghandi applied Gapped k-mers approach and developed GKM-SVM[7] predictor in this field. On the basis of a global feature space, DEEP predictor was proposed to identify enhancers[8]. Moreover, Liu proposed iEnhancerPsedeKNC[9] and iEnhancer-2L[10] to identify enhancers and the
1
Qingling Yan, Xuan Xiao, Wangren Qiu: Jingdezhen Ceramic Institute
strength of enhancers. It is useful for general form of Chou's trinucleotide composition[11] to elicit salient and high discriminative features. However, most methods on identifying enhancers still has room to be improved.
In this model, we apply tri-nucleotide composition, pseudo amino acid components of the protein translated from the DNA samples and bi-profile Bayes feature extraction to identify enhancers and their subsets including strong enhancers and weak enhancers.
BENCHMARK DATASET
According view of Liu [10], the benchmark dataset 𝑆 were used. The benchmark dataset 𝑆 for this study can be formulated as:
S S
S S SsSw (1)
Where the dataset S consists of enhancers samples 𝑆+ and non-enhancers samples 𝑆− . 𝑆𝑆+Contains 742 sequences of strong enhancers, 𝑆𝑤+contains 742 sequences of week enhancer.
FEATURE EXTRACTION METHODS
Combining Trinucleotide Composition and Pseudo Amino Acid Components
In this study, a DNA sequence with L nucleic acid residues can be expressed
as𝐷 = 𝑁1𝑁2𝑁3⋯ 𝑁𝐿. Where, 𝑁𝑖 ∈ {𝐴, 𝐶, 𝐺, 𝑇}(𝑖 = 1,2,3, ⋯ 𝐿). For getting more
available information from sequences, we extract features from trinucleotide composition. And the feature space can be expressed as[11,12]:
D = [𝑓(𝐴𝐴𝐴), 𝑓(𝐴𝐴𝐶), 𝑓(𝐴𝐴𝐺), 𝑓(𝐴𝐴𝑇), ⋯ , 𝑓(𝑇𝑇𝑇)]𝑇 (2)
D = [𝑓13−𝑡𝑢𝑝𝑙𝑒𝑠, 𝑓23−𝑡𝑢𝑝𝑙𝑒𝑠, 𝑓33−𝑡𝑢𝑝𝑙𝑒𝑠, ⋯ , 𝑓643−𝑡𝑢𝑝𝑙𝑒𝑠]𝑇 (3)
Where,𝑓13−𝑡𝑢𝑝𝑙𝑒𝑠 = 𝑓(𝐴𝐴𝐴) is the relative frequencies of𝐴𝐴𝐴; 𝑓23−𝑡𝑢𝑝𝑙𝑒𝑠 =
𝑓(𝐴𝐴𝐶) is the relative frequencies of𝐴𝐴𝐶and so on. Then, we use the pseudo
components to deal with DNA sequences [13]. In this paper, we represent a protein chain as 𝑃 = 𝐴1𝐴2𝐴3⋯ 𝐴𝐿. And 𝐴𝑖 is one of native amino acids of 20,𝐿∗ =
𝑖𝑛𝑡{𝐿 3⁄ }. Then, we calculate 𝑃 as:
0 0
0
( ) ( )
( )
n i n
n i
n
H A H
H A
SD H
Where,𝐻𝑛(𝐴𝑖)(n = 1,2, ⋯ ,6)denotes the 𝑛𝑡ℎoriginal physicochemical property value of the amino acid𝐴𝑖. Relevantly, 𝑆𝐷is the standard deviation. Through combing theλcorrelation factors with the 64 components in the TNC, the DNA sequence can be expressed as:
1 2 64 64 1 64
T
D d d d d d (5)
Where:
3-tuples
64 3-tuples
1 1
64 64
3-tuples
1 1
(1 64)
(64 1 64 )
u
i k
i k
u
u
i k
i k
f
u
f w
d
w
u
f w
(6)
Where,𝑤 denotes the weight factor. And 𝜃𝑘(𝑘 = 1,2,3, ⋯ , 𝜆) denotes the k-tuples correlation factor, which reflects the sequence order correlation among all the 𝑘𝑡ℎ most contiguous residues along a protein chain.
Bi-profile Bayes
In this study, the recently proposed bi-profile Bayes outperforms other methods because of its consideration of information from both positive and negative training samples 𝑆. The posterior probability of 𝑆 can be formulated by:
𝑓(S) = sgn(𝑤⃗⃗ ∙ 𝑝 ) (7)
Where 𝑤⃗⃗ is weigh vector, 𝑝 denotes vector of the posterior probability. According BPB, 𝑝1, 𝑝2, ⋯ , 𝑝𝑛and 𝑝𝑛+1, ⋯ , 𝑝2𝑛 represent the positive and the negative feature space respectively [12,14].
METRICS FOR MEASURING PREDICTION PERFORMANCE
( ) ( )
( )( )( )( )
TP Sen
TP FN TN Spe
TN FP TP TN Acc
TP TN FP FN
TP TN FP FN MCC
TP FP TP FN TN FP TN FN
(8)
Where 𝑇𝑃 indicates true positive, 𝑇𝑁represents true negative, 𝐹𝑃shows false positive and 𝐹𝑁represents false negative. 𝑀𝐶𝐶is Mathews Correlation Coefficient[9].
It has been proved that optimized parameters could improve predictive accuracy. In this study, a feature selection method known as F-value[13] is used to evaluate and measure the contribution of feature to the classification.
RESULTS AND DISCUSSIONS
Prediction Performance of Using TNC and PseAAC Feature Space
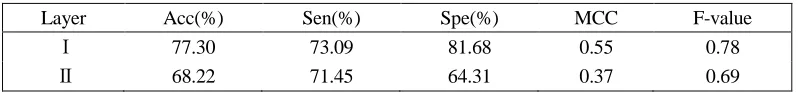
The predicted results are shown in TABLE I for dataset 𝑆and𝑆+. And using TNC and PseAAC feature space, for the jackknife test, SVM classifier achieved the satisfactory performance. Accuracy is 77.30%, other metrics like sensitivity is 73.09%,specificity is 81.68%, 𝑀𝐶𝐶 is 0.55, F-value is 0.78. Furthermore, using BPB and combing TNC and PseAAC feature space, SVM classifier achieved in the second step, the accuracy is 68.22%. In addition, sensitivity is 71.45%,specificity is 64.31%,
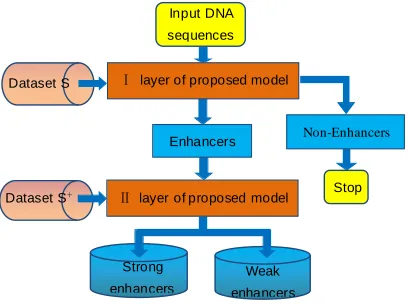
𝑀𝐶𝐶is 0.37, F-value is 0.69. As we can see, there is still much room for promotion on identifying subsets of enhancers. And the framework diagram of the proposed model is show in Figure 1.
Performance Comparison with Several Approaches
[image:4.612.98.497.638.684.2]There are several classification methods work well in some fields of computational biology, such as K Nearest Neighbour (KNN), Support Vector Machine (SVM), Probabilistic Neural Network (PNN) and so on. To determine the classification methods which are most effective for identifying enhancers and their strength, we adopt control variable method, used same benchmark dataset to compare the performances of several classification methods. The performance as shown in the following TABLE Ⅱ and TABLE Ⅲ.
TABLE I. THE PERFORMANCE OF PROPOSED METHODON THE FEATURE SPACE USING DATASET 𝑆AND𝑆+.
Layer Acc(%) Sen(%) Spe(%) MCC F-value
Ⅰ 77.30 73.09 81.68 0.55 0.78
TABLE II. THE PREDICTED RESULTS OF LEARNERS ON THE FEATURE SPACE USING DATASET 𝑆AND 𝑆+.
Layer Method Acc(%) Sen(%) Spe(%) MCC F-value
Ⅰ
PNN 75.99 72.53 79.61 0.52 0.75
KNN 76.43 73.20 79.60 0.53 0.76
SVM 77.30 73.09 81.68 0.55 0.78
Ⅱ PNN 63.01 77.14 51.05 0.29 0.67
[image:5.612.93.496.268.358.2]SVM 68.22 71.45 64.31 0.37 0.69
TABLE III. COMPARISON WITH EXISTING METHODS ON DATASET 𝑆AND𝑆+.
Layer Method Acc(%) Sen(%) Spe(%) MCC F-value
Ⅰ
iEnhancer-2L 76.89 78.09 75.88 0.54 --
CMPB 77.25 75.84 78.63 0.55 0.77
Proposed Method 77.30 73.09 81.68 0.55 0.78
Ⅱ
iEnhancer-2L 61.93 62.21 61.82 0.24 --
CMPB 64.70 72.00 57.41 0.30 0.67
Proposed Method 68.22 71.45 64.31 0.37 0.69
Figure 1. The framework diagram of the proposed model.
CONCLUSIONS
After summarizing and comparing various classification methods by continuous experiments, we find that identifying enhancers and non-enhancers by using several features selection method is useful. We have verified that trinucleotide and pseudo composition contribute to feature extraction. Utilizing bi-profile Bayes features and
Input DNA
sequences
Dataset S
Dataset S+ Stop
Strong
enhancers
Weak
enhancers
Ⅰ layer of proposed model
Ⅱlayer of proposed model
[image:5.612.190.394.392.544.2]jackknife cross-validation strategy can improve prediction performance. Comparing with other classifiers, the performance of SVM determined this classification method is effective for identifying enhancers and their strength.
REFERENCES
1. B. Liu, F. Liu, L. Fang, X. Wang, K.-C. Chou, 2015, Rep, DNA: a Python Package to Generate Various Modes of Feature Vectors for DNA Sequences by Incorporating User-Defined Physicochemical Properties and Sequence-Order Effects, Bioinformatics.
2. B. Liu, F. Liu, X. Wang, J. Chen, L. Fang, K.-C. Chou, 2015, Pse-in-One: a Web Server for Generating Various Modes of Pseudo Components of DNA, RNA, and Protein Sequences,
Nucleic Acids Research.
3. B. Liu, R Long. And K. C. Chou, 2016, IDHS-EL: Identifying DNase I Hypersensitive-sites by Fusing Three Different Modes of Pseudo Nucleotide Composition into an Ensemble Learning Framework. Bioinformatics, 250-257.
4. Q. Dong, S. Wang, K. Wang, X. Liu and B. Liu, 2015, Identification of DNA-binding Proteins by Auto-cross Covariance Transformation. IEEE International Conference on Bioinformatics and Biomedicine.
5. M. Fernandez, D. Miranda-Saavedra, 2012,Genome-wide Enhancer Prediction from Epigenetic Signatures Using Genetic Algorithm-optimized Support Vector Machines, Nucleic Acids Res. 6. Rajagopal, N. Etal., 2013, RFECS: a Random-forest Based Algorithm for Enhancer Identification
from Chromatin State. PLoSComput. Biol.
7. Ghandi, M. Etal., 2014, Enhanced Regulatory Sequence Prediction Using Gapped K-mer Features. PLoSComput. Biol., 10, E1003711.
8. Kleftogiannis, D., Kalnis, P. and Bajic, V. B., 2015, DEEP: a General Computational Framework for Predicting Enhancers. Nucleic Acids Research.
9. B. Liu, 2016, IEnhancer-Psede, KNC: Identification of Enhancers and Their Subgroups Based on Pseudo Degenerate KmerNucleotide Composition. Neurocomputing, 46-52.
10. B. Liu, L. Fang, R. Long, X. Lan and K. C. Chou, 2016, IEnhancer-2L: a Two-layer Predictor for Identifying Enhancers and Their Strength by Pseudo K-tuple Nucleotide Composition.
Bioinformatics, 32.
11. Tahir, M., Hayat, M. and Kabir, M., 2017, Sequence Based Predictor for Discrimination of Enhancer and Their Types by Applying General Form of Chou's Trinucleotide Composition.
Compute Methods Programs Biomed, 69-75.
12. X. Zhou, Z. Li, Z. Dai, and X. Zou, 2013, Predicting Promoters by Pseudo-trinucleotide Compositions Based on Discrete Wavelets, Transform. Journal of Theoretical Biology. 13. H. Lin, and H. Ding, 2011, Predicting Ion Channels and Their Types by theDipeptide Mode of
Pseudo Amino Acid Composition. Journal of Theoretical Biology.