Open Access
Research
Arsenic in drinking water and cerebrovascular disease, diabetes
mellitus, and kidney disease in Michigan: a standardized mortality
ratio analysis
Jaymie R Meliker*
1, Robert L Wahl
2, Lorraine L Cameron
2and
Jerome O Nriagu
3Address: 1BioMedware, Inc., Ann Arbor, Michigan, USA, 2Division of Environmental and Occupational Epidemiology, Michigan Department of
Community Health, Lansing, Michigan, USA and 3Department of Environmental Health Sciences, School of Public Health, the University of
Michigan, Ann Arbor, Michigan, USA
Email: Jaymie R Meliker* - meliker@biomedware.com; Robert L Wahl - wahlr@michigan.gov; Lorraine L Cameron - cameronl@michigan.gov; Jerome O Nriagu - jnriagu@umich.edu
* Corresponding author
Abstract
Background: Exposure to arsenic concentrations in drinking water in excess of 300 μg/L is associated with diseases of the circulatory and respiratory system, several types of cancer, and diabetes; however, little is known about the health consequences of exposure to low-to-moderate levels of arsenic (10–100
μg/L).
Methods: A standardized mortality ratio (SMR) analysis was conducted in a contiguous six county study area of southeastern Michigan to investigate the relationship between moderate arsenic levels and twenty-three selected disease outcomes. Disease outcomes included several types of cancer, diseases of the circulatory and respiratory system, diabetes mellitus, and kidney and liver diseases. Arsenic data were compiled from 9251 well water samples tested by the Michigan Department of Environmental Quality from 1983 through 2002. Michigan Resident Death Files data were amassed for 1979 through 1997 and sex-specific SMR analyses were conducted with indirect adjustment for age and race; 99% confidence intervals (CI) were reported.
Results: The six county study area had a population-weighted mean arsenic concentration of 11.00 μg/L and a population-weighted median of 7.58 μg/L. SMR analyses were conducted for the entire six county study area, for only Genesee County (the most populous and urban county), and for the five counties besides Genesee. Concordance of results across analyses is used to interpret the findings. Elevated mortality rates were observed for both males (M) and females (F) for all diseases of the circulatory system (M SMR, 1.11; CI, 1.09–1.13; F SMR, 1.15; CI, 1.13,-1.17), cerebrovascular diseases (M SMR, 1.19; CI, 1.14– 1.25; F SMR, 1.19; CI, 1.15–1.23), diabetes mellitus (M SMR, 1.28; CI, 1.18–1.37; F SMR, 1.27; CI, 1.19– 1.35), and kidney diseases (M SMR, 1.28; CI, 1.15–1.42; F SMR, 1.38; CI, 1.25–1.52).
Conclusion: This is some of the first evidence to suggest that exposure to low-to-moderate levels of arsenic in drinking water may be associated with several of the leading causes of mortality, although further epidemiologic studies are required to confirm the results suggested by this ecologic SMR analysis. Published: 2 February 2007
Environmental Health 2007, 6:4 doi:10.1186/1476-069X-6-4
Received: 26 July 2006 Accepted: 2 February 2007
This article is available from: http://www.ehjournal.net/content/6/1/4
© 2007 Meliker et al; licensee BioMed Central Ltd.
Background
Assessment of health risks associated with exposure to moderately elevated levels of arsenic in drinking water (10–100 μg/l) has become the subject of considerable interest and some controversy in both regulatory and pub-lic health communities. The National Research Council (NRC) subcommittee on Arsenic in Drinking Water, for instance, found that "additional epidemiological evalua-tions are needed to characterize the dose-response rela-tionship for arsenic-associated cancer and noncancer end points, especially at low doses" [1](see page 3) and simul-taneously concluded that the guideline of "50 μg/L does not achieve...public health protection, and therefore, requires downward revision as promptly as possible." [1](see page 9). In the end, the United States Environmen-tal Protection Agency (USEPA) recommended a reduction in the maximum contaminant level (MCL) to 10 μg/l for arsenic in US public drinking water supplies [2].
The call for a significant reduction in the MCL by the USEPA was prompted, at least in part, by findings of inter-nal cancers (especially bladder, kidney, liver, and lung) among populations in Taiwan, Japan, Chile, and Argen-tina that are exposed to elevated levels of arsenic (typically > 300 μg/l) in their drinking water [3-8]. In addition to cancer, ample evidence exists to support a relationship between arsenic in drinking water and cardiovascular and circulatory diseases such as blackfoot disease [9,10], ischemic heart diseases [11], and cerebrovascular diseases [12]. Emerging evidence also suggests an association between arsenic and diabetes mellitus [13,14] and non-malignant respiratory diseases [15,16]. Most of these stud-ies, however, examined arsenic concentrations of 100 μg/ L and above, providing little insight into health effects from low-to-moderate concentrations (10–100 μg/L) which are more commonly found in sources of drinking water in the US and Europe.
A few mortality studies have been conducted in areas where arsenic concentrations in drinking water are com-monly in the 10–100 μg/L range; however, a clear picture of the relevant health risks has not yet emerged. Engel and Smith (1994) conducted a standardized mortality ratio (SMR) analysis for vascular and respiratory diseases in thirty US counties with elevated levels of arsenic in drink-ing water. Diseases of arteries, arterioles, and capillaries (DAAC), emphysema, and chronic airways obstruction exhibited significantly elevated SMRs in counties where mean arsenic levels exceeded 20 μg/L. In a cohort mortal-ity study in Millard County, Utah where arsenic levels ranged from 14–166 μg/L, Lewis et al. [17] examined can-cer and a host of cardiovascular, respiratory, and kidney diseases. These authors reported significant positive SMRs for women and men from hypertensive heart diseases, and for only men from nephritis and nephrosis, and
pros-tate cancer. In contrast to the results from Engel and Smith [10], however, Lewis et al [17] did not identify an elevated SMR for DAAC, and did not investigate deaths caused by emphysema or chronic airways obstruction. In ecologic studies conducted in Belgium [18] and Hungary [19], low-to-moderate levels of arsenic were not reported to be associated with mortality due to diseases of the nervous system, circulatory system, liver, or cancer. Individual-level incidence studies of low-to-moderate arsenic expo-sure have also generated ambiguous findings with regard to the role of arsenic in cancers of the bladder and skin [20-25].
In light of this uncertainty, it is important to continue to investigate health risks from exposure to arsenic concen-trations in the 10–100 μg/L range. Therefore, the goal of this study is to investigate mortality rates for twenty-three different health outcomes, including several types of can-cer, circulatory and respiratory diseases, diabetes, and dis-eases of the kidneys and liver in six contiguous counties of Michigan with moderately elevated levels of arsenic in drinking water.
Methods
Arsenic in southeastern Michigan study area
Elevated concentrations of arsenic in Michigan groundwa-ter were first reported from a well supplying a mobile home park in Huron County in 1981 [26]. Since then, arsenic has been identified in groundwater supplies, typi-cally in the 10–100 μg/L range, throughout six contiguous counties of Michigan and is now a well-documented phe-nomenon that has generated considerable concern [27-29]. The counties involved include Genesee, Huron, Lap-eer, Sanilac, Shiawassee, and Tuscola, and are located in the Michigan thumb region (Figure 1). The 2000 US Cen-sus indicates the six counties have a population of approx-imately 740,000 people and occupy an area of approximately 11,500 km2. The majority of the popula-tion resides in Genesee County (439,000), while the remainder is split fairly evenly among the other five coun-ties (Table 1). Genesee County also contains the industrial city of Flint and the largest proportion of African Ameri-cans in the study area; in contrast, the other five counties are predominantly rural and white.
absorp-tion spectrometry (GF/AAS) (1983–1987, 1989–1995), inductively coupled plasma (ICP) optical emission hydride generation (1987–1988), hydride flame (quartz tube AAS) (1989–1995), and ICP/mass spectrometry (1996-present); previous analyses have indicated that samples analyzed using different methods were highly correlated [30]. Approximately 86% of the analyses were of private wells, and 14% came from municipal wells.
Analyses of water samples from private wells were per-formed at the request of property owners.
Using the MDEQ arsenic database, county-level mean and median arsenic concentrations were calculated for private wells. In addition, arsenic estimates were compiled for each public well water supply in the area from the MDEQ arsenic database [30]; those not drinking groundwater were served by municipal surface water from the Great
The six-county study area in the "thumb" region of southeastern Michigan
Figure 1
The six-county study area in the "thumb" region of southeastern Michigan.
Michigan
Huron
Sanilac
Tuscola
Lapeer
Genesee
Shiawassee
Lakes which contains arsenic concentrations averaging 0.30 μg/L [31]. The size of the population served by pri-vate well, public well, and public surface water supplies was compiled from an MDEQ database and population-weighted estimates were tabulated.
Mortality and population data
Cause-specific mortalities from 1979 to 1997 were com-piled from Michigan Resident Death Files by the Vital Records and Health Data Development Section of the Michigan Department of Community Health (MDCH). Twenty-three different underlying causes of death were included in the study, categorized according to the Inter-national Classification of Diseases, 9th Revision (ICD-9). The twenty-three causes of death include several types of cancer, diseases of the circulatory and respiratory system, diabetes mellitus, and kidney and liver diseases, and are listed in Table 2. Each of these diseases has shown some evidence of association with arsenic exposure, although at higher concentrations in drinking water. The number of deaths from 1979 through 1997 by cause in each individ-ual county and in the entire State were stratified by sex, race, and age and grouped into five-year categories begin-ning at age 35 and ending at ≥ 85 years of age. Census data and population estimates were compiled at five-year time intervals from the same period for the State of Michigan and the six counties in the study area.
Data analysis
Sex-specific SMRs were calculated by dividing the number of observed deaths from a given cause by the age- and race-adjusted expected values for Michigan [32]. Expected values were calculated using indirect adjustment; statewide mortality rates for each underlying cause, strati-fied by age, race, and sex were multiplied by the combined sex-, race-, and age-specific person-years in each county. To account for the large number of calculations (23 SMRs each for males and females), 99% confidence intervals,
instead of 95%, were calculated. SMR analyses were con-ducted for the entire six county study area, for only Gene-see County (the most populous, urban, and racially diverse county), and for the five counties besides Genesee. Concordance of results across analyses was used to inter-pret the findings.
Results
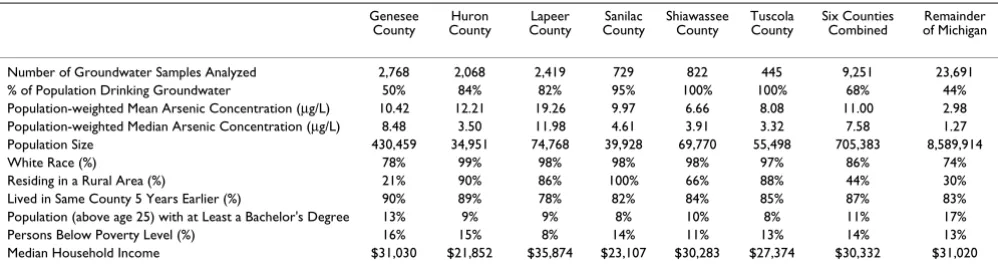
The six county study area contains a population-weighted mean arsenic concentration of 11.00 μg/L and a popula-tion-weighted median of 7.58 μg/L. In comparison, in the remainder of Michigan, the population-weighted mean is 2.98 μg/L with a median of 1.27 μg/L (Table 1).
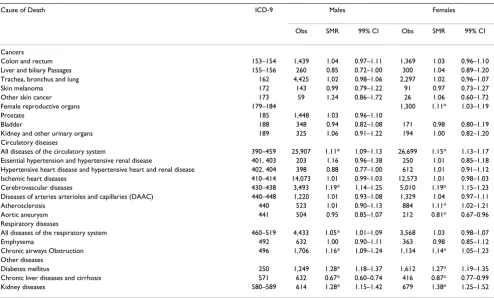
SMRs are reported for twenty-three causes of death for males and females in the six county study area of south-eastern Michigan (Table 2). Observed deaths from cancers were not different from the expected values for males or females, with the exception of cancer of the female repro-ductive organs (ICD-9 179–184), which was elevated. Deaths from all diseases of the circulatory system (ICD-9 390–459) and cerebrovascular diseases (ICD-9 430–438) were elevated in both males and females. In females only, deaths from atherosclerosis (ICD-9 440) were elevated and deaths from aortic aneurysm (ICD-9 441) were reduced. Deaths from respiratory diseases were elevated in the study area, with chronic airways obstruction-related deaths elevated in both males and females (ICD-9 496). Males also experienced elevated mortality rates for all dis-eases of the respiratory system (ICD-9 460–519). Deaths from diabetes mellitus (ICD-9 250) and kidney diseases (ICD-9 580–589) were also elevated among both males and females in the study area. Deaths from chronic liver diseases and cirrhosis (ICD-9 571) were reduced for males and females.
[image:4.612.55.554.100.236.2]In Genesee County alone, mortality rates were elevated for the same health outcomes as those identified from the six
Table 1: Exposure and Population Statistics for Counties in Southeastern Michigan Study Area
Genesee County
Huron County
Lapeer County
Sanilac County
Shiawassee County
Tuscola County
Six Counties Combined
Remainder of Michigan
Number of Groundwater Samples Analyzed 2,768 2,068 2,419 729 822 445 9,251 23,691 % of Population Drinking Groundwater 50% 84% 82% 95% 100% 100% 68% 44% Population-weighted Mean Arsenic Concentration (μg/L) 10.42 12.21 19.26 9.97 6.66 8.08 11.00 2.98 Population-weighted Median Arsenic Concentration (μg/L) 8.48 3.50 11.98 4.61 3.91 3.32 7.58 1.27 Population Size 430,459 34,951 74,768 39,928 69,770 55,498 705,383 8,589,914
White Race (%) 78% 99% 98% 98% 98% 97% 86% 74%
Residing in a Rural Area (%) 21% 90% 86% 100% 66% 88% 44% 30%
Lived in Same County 5 Years Earlier (%) 90% 89% 78% 82% 84% 85% 87% 83% Population (above age 25) with at Least a Bachelor's Degree 13% 9% 9% 8% 10% 8% 11% 17%
Persons Below Poverty Level (%) 16% 15% 8% 14% 11% 13% 14% 13%
Median Household Income $31,030 $21,852 $35,874 $23,107 $30,283 $27,374 $30,332 $31,020
Arsenic data collected from 1983–2002, provided by Michigan Department of Environmental Quality. US Maximum Contaminant Limit for public drinking water supplies is 10 μg/L.
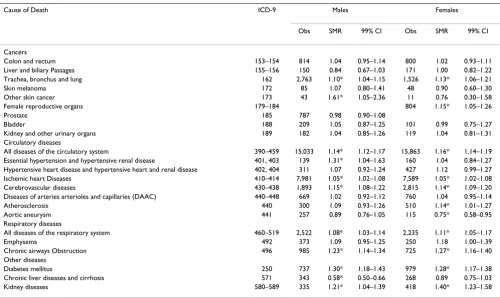
county analysis (Table 3). In addition, elevated mortality rates were observed for both males and females from tra-chea, bronchus, and lung cancer (ICD-9 162), ischemic heart diseases (ICD-9 410–414), and all diseases of the respiratory system (ICD-9 460–519). Deaths were also elevated for only males from non-melanoma skin cancer (ICD-9 173) and essential hypertension and hypertensive renal disease (ICD-9 401, 403). Deaths from chronic liver diseases and cirrhosis (ICD-9 571) were no longer signif-icantly reduced for females.
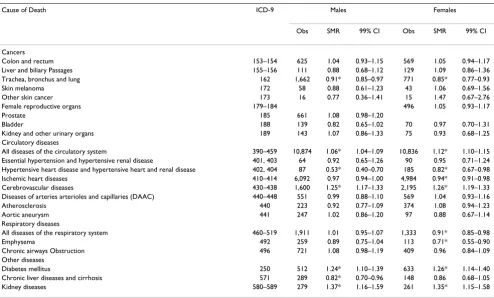
In the five counties other than Genesee County, mortality rates remained elevated for males and females from all diseases of the circulatory system (ICD-9 390–459), cere-brovascular diseases (ICD-9 430–438), diabetes mellitus (ICD-9 250), and kidney diseases (ICD-9 580–589) (Table 4). Deaths from chronic airways obstruction (ICD-9 4(ICD-96) were no longer elevated. In fact, mortality rates were significantly reduced for females from all diseases of the respiratory system (ICD-9 460–519) and emphysema (ICD-9 492). Deaths were also reduced for males and females from trachea, bronchus, and lung cancer (ICD-9 162) and hypertensive heart disease and hypertensive heart and renal disease (ICD-9 402, 404), for females from ischemic heart diseases (ICD-9 410–414), and for
males from chronic liver diseases and cirrhosis (ICD-9 571).
Discussion
In these six county, five county, and Genesee county-only SMR analyses of the Michigan thumb region, heightened mortality rates were consistently observed for diabetes mellitus, cerebrovascular diseases, and kidney diseases in both males and females. Each of these health endpoints is reported to be associated with arsenic in drinking water at levels in excess of 200–300 μg/L; here we present some of the first evidence of a relationship between these health outcomes and arsenic concentrations in a region of the US where elevated concentrations typically range from 10– 100 μg/L.
[image:5.612.58.552.98.396.2]Arsenic has been shown to be associated with increased rates of diabetes incidence [14], prevalence [13,33], and mortality [8] in studies from Taiwan and Bangladesh. Only one previous study, however, examined risk of mor-tality from diabetes from drinking water arsenic concen-trations below 200 μg/L and that study found no association [17]. In contrast, we report elevated mortality rates for diabetes in both males (SMR, 1.28; 99%CI, 1.18– 1.37) and females (SMR, 1.27; 99%CI, 1.19–1.35) (Table
Table 2: Standardized Mortality Ratios in Six County Southeastern Michigan Study Area, 1979–1997.
Cause of Death ICD-9 Males Females
Obs SMR 99% CI Obs SMR 99% CI
Cancers
Colon and rectum 153–154 1,439 1.04 0.97–1.11 1,369 1.03 0.96–1.10 Liver and biliary Passages 155–156 260 0.85 0.72–1.00 300 1.04 0.89–1.20 Trachea, bronchus and lung 162 4,425 1.02 0.98–1.06 2,297 1.02 0.96–1.07
Skin melanoma 172 143 0.99 0.79–1.22 91 0.97 0.73–1.27
Other skin cancer 173 59 1.24 0.86–1.72 26 1.06 0.60–1.72
Female reproductive organs 179–184 1,300 1.11* 1.03–1.19
Prostate 185 1,448 1.03 0.96–1.10
Bladder 188 348 0.94 0.82–1.08 171 0.98 0.80–1.19
Kidney and other urinary organs 189 325 1.06 0.91–1.22 194 1.00 0.82–1.20 Circulatory diseases
All diseases of the circulatory system 390–459 25,907 1.11* 1.09–1.13 26,699 1.15* 1.13–1.17 Essential hypertension and hypertensive renal disease 401, 403 203 1.16 0.96–1.38 250 1.01 0.85–1.18 Hypertensive heart disease and hypertensive heart and renal disease 402, 404 398 0.88 0.77–1.00 612 1.01 0.91–1.12 Ischemic heart diseases 410–414 14,073 1.01 0.99–1.03 12,573 1.01 0.98–1.03 Cerebrovascular diseases 430–438 3,493 1.19* 1.14–1.25 5,010 1.19* 1.15–1.23 Diseases of arteries arterioles and capillaries (DAAC) 440–448 1,220 1.01 0.93–1.08 1,329 1.04 0.97–1.11
Atherosclerosis 440 523 1.01 0.90–1.13 884 1.11* 1.02–1.21
Aortic aneurysm 441 504 0.95 0.85–1.07 212 0.81* 0.67–0.96
Respiratory diseases
All diseases of the respiratory system 460–519 4,433 1.05* 1.01–1.09 3,568 1.03 0.98–1.07
Emphysema 492 632 1.00 0.90–1.11 363 0.98 0.85–1.12
Chronic airways Obstruction 496 1,706 1.16* 1.09–1.24 1,134 1.14* 1.05–1.23 Other diseases
Diabetes mellitus 250 1,249 1.28* 1.18–1.37 1,612 1.27* 1.19–1.35
Chronic liver diseases and cirrhosis 571 632 0.67* 0.60–0.74 416 0.87* 0.77–0.99
Kidney diseases 580–589 614 1.28* 1.15–1.42 679 1.38* 1.25–1.52
2). This inconsistency may be explained by the added power in our study which includes 1249 male and 1612 female deaths from diabetes, compared with only 20 male and 35 female deaths in the Utah study by Lewis et al. [17]. In addition, the Utah study relied on data from a cohort of members of the Church of Jesus Christ of Latter-day Saints whose personal lifestyle choices (e.g., no tobacco smoking or consumption of alcohol) make com-parisons with other study populations difficult. Diabetes mellitus is a complex disease, defined as a set of abnor-malities characterized by a state of sustained hyperglyc-emia. It is the sixth leading cause of death in the United States, with unknown specific etiology [34,35]. The fea-tures of diabetes mellitus most commonly observed in arsenic-exposed individuals are similar to non-insulin-dependent diabetes mellitus or Type 2 diabetes [14]. Although the biological mechanisms responsible for arsenic-induced diabetes mellitus are largely unknown, recent evidence suggests that the trivalent arsenicals may suppress insulin-stimulated glucose uptake by interfering with mobilization of glucose transporters in adipose cells [36], as well as interfering with transcription factors involved in insulin-related gene expression [37].
Kidney diseases are the ninth leading cause of death in the United States [35] and were also found to be elevated in
the six county study area for males (SMR, 1.28; 99%CI, 1.15–1.42) and females (SMR, 1.38; 99%CI, 1.25–1.52), as well as in the five county and Genesee County-only analyses. Elevated mortality rates for kidney diseases have been reported in high arsenic areas of Taiwan [8], and sig-nificantly elevated SMRs were also reported from nephri-tis and nephrosis in Utah men [17]. Few mechanisms of arsenic-induced kidney diseases have been proposed, however. Kidney diseases are a frequent complication of diabetes, and arsenic may be affecting the kidney via vas-cular changes associated with diabetes.
In addition to diabetes and kidney diseases, elevated mor-tality rates were observed for cerebrovascular diseases for males (SMR, 1.19; 99%CI, 1.14–1.25) and females (SMR, 1.19; 99%CI, 1.15–1.23). Elevated mortality rates were also observed when grouping together all diseases of the circulatory system, however, only mortality from cere-brovascular diseases was consistently elevated for both males and females when examining the individual major causes of vascular-related death. Cerebrovascular diseases are the third leading cause of death in the United States [35]. Epidemiologic studies have previously reported increased prevalence [12] and mortality [8] from cere-brovascular diseases in high arsenic areas of Taiwan. Chiou et al. [12] found prevalence of cerebrovascular
dis-Table 3: Standardized Mortality Ratios in Genesee County, Michigan, 1979–1997.
Cause of Death ICD-9 Males Females
Obs SMR 99% CI Obs SMR 99% CI
Cancers
Colon and rectum 153–154 814 1.04 0.95–1.14 800 1.02 0.93–1.11
Liver and biliary Passages 155–156 150 0.84 0.67–1.03 171 1.00 0.82–1.22 Trachea, bronchus and lung 162 2,763 1.10* 1.04–1.15 1,526 1.13* 1.06–1.21
Skin melanoma 172 85 1.07 0.80–1.41 48 0.90 0.60–1.30
Other skin cancer 173 43 1.61* 1.05–2.36 11 0.76 0.30–1.58
Female reproductive organs 179–184 804 1.15* 1.05–1.26
Prostate 185 787 0.98 0.90–1.08
Bladder 188 209 1.05 0.87–1.25 101 0.99 0.75–1.27
Kidney and other urinary organs 189 182 1.04 0.85–1.26 119 1.04 0.81–1.31 Circulatory diseases
All diseases of the circulatory system 390–459 15,033 1.14* 1.12–1.17 15,863 1.16* 1.14–1.19 Essential hypertension and hypertensive renal disease 401, 403 139 1.31* 1.04–1.63 160 1.04 0.84–1.27 Hypertensive heart disease and hypertensive heart and renal disease 402, 404 311 1.07 0.92–1.24 427 1.12 0.99–1.27 Ischemic heart Diseases 410–414 7,981 1.05* 1.02–1.08 7,589 1.05* 1.02–1.08 Cerebrovascular diseases 430–438 1,893 1.15* 1.08–1.22 2,815 1.14* 1.09–1.20 Diseases of arteries arterioles and capillaries (DAAC) 440–448 669 1.02 0.92–1.12 760 1.04 0.95–1.14
Atherosclerosis 440 300 1.09 0.93–1.26 510 1.14* 1.01–1.27
Aortic aneurysm 441 257 0.89 0.76–1.05 115 0.75* 0.58–0.95
Respiratory diseases
All diseases of the respiratory system 460–519 2,522 1.08* 1.03–1.14 2,235 1.11* 1.05–1.17
Emphysema 492 373 1.09 0.95–1.25 250 1.18 1.00–1.39
Chronic airways Obstruction 496 985 1.23* 1.14–1.34 725 1.27* 1.16–1.40 Other diseases
Diabetes mellitus 250 737 1.30* 1.18–1.43 979 1.28* 1.17–1.38
Chronic liver diseases and cirrhosis 571 343 0.58* 0.50–0.66 268 0.89 0.75–1.03
Kidney diseases 580–589 335 1.21* 1.04–1.39 418 1.40* 1.23–1.58
[image:6.612.55.555.98.396.2]eases to be significantly associated with arsenic levels as low as 0.1–50 μg/L in drinking water (compared to a base-line of <0.1 μg/L). Increased mortality from cerebrovascu-lar diseases, however, was not found in previous ecologic studies of health effects from low-to-moderate arsenic exposure in the US [10,17]. Experimental studies suggest potential mechanisms for cerebrovascular toxicity of arsenic include inflammatory and coagulatory activity of endothelial cells, increased oxidative stress, and impaired vascular nitric oxide homeostatis [38]. These studies, however, have typically been performed using unrealisti-cally high arsenic concentrations calling into question their mechanistic relevance [39]. Our study lends support to the evidence that low-to-moderate levels of arsenic in drinking water are associated with elevated rates of cere-brovascular diseases.
Mixed results were observed for several other circulatory disease outcomes across the six county, five county, and Genesee County-only analyses. Deaths from atherosclero-sis were significantly elevated and deaths from aortic aneurysm were significantly reduced for females in the six county and Genesee County-only analyses, but not in the five county analyses. Deaths from ischaemic heart dis-eases (for males and females) and essential hypertension and hypertensive renal disease (for males only) were
ele-vated only in the Genesee County-only analyses. In only the five county analyses, deaths from hypertensive heart disease and hypertensive heart and renal disease were reduced for males and females. Taken as a whole, these results suggest that, with the exception of cerebrovascular diseases, deaths from different types of circulatory dis-eases were elevated in Genesee County but not in the other five counties.
Differences in cancer and respiratory outcomes were also detected between Genesee County and the other five counties. In Genesee county, elevated mortality rates were observed for trachea, bronchus, and lung cancer (for males and females), other skin cancer (for males), cancer of the female reproductive organs, all diseases of the res-piratory system (for males and females), and chronic air-ways obstruction (for males and females). None of these disease outcomes were significantly elevated in the five county analyses, and mortality rates were significantly reduced for cancers of the trachea, bronchus, and lung (for males and females), emphysema (for females), and all diseases of the respiratory system (for females).
[image:7.612.57.551.98.396.2]These differences in mortality profiles between Genesee County and the other five counties may reflect differences commonly observed between urban and rural residents.
Table 4: Standardized Mortality Ratios in Five Counties of Study Area Excluding Genesee County, Michigan, 1979–1997.
Cause of Death ICD-9 Males Females
Obs SMR 99% CI Obs SMR 99% CI
Cancers
Colon and rectum 153–154 625 1.04 0.93–1.15 569 1.05 0.94–1.17
Liver and biliary Passages 155–156 111 0.88 0.68–1.12 129 1.09 0.86–1.36 Trachea, bronchus and lung 162 1,662 0.91* 0.85–0.97 771 0.85* 0.77–0.93
Skin melanoma 172 58 0.88 0.61–1.23 43 1.06 0.69–1.56
Other skin cancer 173 16 0.77 0.36–1.41 15 1.47 0.67–2.76
Female reproductive organs 179–184 496 1.05 0.93–1.17
Prostate 185 661 1.08 0.98–1.20
Bladder 188 139 0.82 0.65–1.02 70 0.97 0.70–1.31
Kidney and other urinary organs 189 143 1.07 0.86–1.33 75 0.93 0.68–1.25 Circulatory diseases
All diseases of the circulatory system 390–459 10,874 1.06* 1.04–1.09 10,836 1.12* 1.10–1.15 Essential hypertension and hypertensive renal disease 401, 403 64 0.92 0.65–1.26 90 0.95 0.71–1.24 Hypertensive heart disease and hypertensive heart and renal disease 402, 404 87 0.53* 0.40–0.70 185 0.82* 0.67–0.98 Ischemic heart diseases 410–414 6,092 0.97 0.94–1.00 4,984 0.94* 0.91–0.98 Cerebrovascular diseases 430–438 1,600 1.25* 1.17–1.33 2,195 1.26* 1.19–1.33 Diseases of arteries arterioles and capillaries (DAAC) 440–448 551 0.99 0.88–1.10 569 1.04 0.93–1.16
Atherosclerosis 440 223 0.92 0.77–1.09 374 1.08 0.94–1.23
Aortic aneurysm 441 247 1.02 0.86–1.20 97 0.88 0.67–1.14
Respiratory diseases
All diseases of the respiratory system 460–519 1,911 1.01 0.95–1.07 1,333 0.91* 0.85–0.98
Emphysema 492 259 0.89 0.75–1.04 113 0.71* 0.55–0.90
Chronic airways Obstruction 496 721 1.08 0.98–1.19 409 0.96 0.84–1.09 Other diseases
Diabetes mellitus 250 512 1.24* 1.10–1.39 633 1.26* 1.14–1.40
Chronic liver diseases and cirrhosis 571 289 0.82* 0.70–0.96 148 0.86 0.68–1.05
Kidney diseases 580–589 279 1.37* 1.16–1.59 261 1.35* 1.15–1.58
Approximately 21% of the population in Genesee county resides in rural areas, compared with more than 80% in the other five counties (Table 1). Farmers and rural resi-dents have been shown to have lower mortality due to all causes combined, all cancers combined, respiratory sys-tem cancer, cardiovascular disease, and respiratory dis-eases other than cancer compared to non-farmers and urban residents [40-44]. A lower prevalence of smoking among farmers compared with non-farmers is often cited as one explanation for the lower mortality among the former population [41-43]. A lower smoking prevalence among our study population may also be a factor sup-pressing mortality within the five county area, especially since smoking is a key risk factor for many of the diseases in question. Although data were not available on histori-cal smoking prevalence for this population or for Michi-gan, a comparison of data from the 1976 National Health Interview Survey with a previous cohort study conducted in the region in the 1970s indicated that proportionally fewer adults in the region were smokers (25.1%) com-pared with the adult white national population (36.0%) [45,46]. These differences suggest that results which appear to be consistent across the six county, five county, and Genesee-county analyses are likely to be the least con-founded.
Aside from potential differences in historical smoking behaviors among the rural segment of the population, additional differences between the six county study area and the remainder of the state of Michigan deserve com-ment (Table 5). Michigan Behavioral Risk Factor Survey (BRFS) data from 1989–1993 indicate lower age-adjusted rates of heavy or binge drinking from this part of Michi-gan, as compared to the state as a whole [47]. This may explain the reduced mortality rates observed for chronic liver diseases and cirrhosis, which were consistent for males across the different analyses. Nevertheless, it is pos-sible that low-to-moderate levels of arsenic in drinking water are protective against liver diseases, although this would be surprising since arsenic is a well-established risk factor for liver diseases when high doses are given in ani-mal studies [48].
The proportion of the population that lived in the same county five years earlier was slightly higher in the six county study area (87%) compared with the remainder of the state (83%) (Table 1). The six county study area also is considerably more rural than the State as a whole (Table 1). BRFS data generally indicate poorer access to health care in the most rural parts of the State [47], however higher rates of mammography and cholesterol screening were reported in this part of Michigan compared with the State average (Table 5). It is unknown how these rates relate to screening for other diseases. A slightly higher prevalence of cardiovascular disease risk factors such as obesity, high blood pressure, and high cholesterol has also been reported in the study area. Smoking prevalence in the study area in the early 1990s, however, is no differ-ent than that of the state as a whole. Obesity, high blood pressure, cigarette smoking, and poor access to health care are established risk factors for the diseases of strongest sig-nificance here [49,50], however not all of these factors are elevated throughout the study area. In addition, high blood pressure may not be a confounder, but rather could be an intermediate variable in cerebrovascular mortality. Results indicate that deaths due to diseases strongly asso-ciated with these risk factors, such as emphysema, lung cancer, ischemic heart diseases, and DAAC were not ele-vated throughout our study area, suggesting that smoking, poor access to health care, obesity, and high blood pres-sure can only partially explain the elevated mortality rates observed for kidney and cerebrovascular diseases and dia-betes mellitus.
[image:8.612.64.553.606.718.2]In light of the attention given to arsenic and cancer [3-7], the lack of findings in our study of significantly elevated mortality rates for cancers of the bladder, kidney, lung, and skin is intriguing. The SMR for lung cancer was ele-vated in Genesee County, but depressed in the other five counties. This may be due to a possible synergism between arsenic and smoking [51], as Genesee is the most urban county, presumably with the highest smoking rates [41-43]. An alternative explanation for the lack of strong cancer-related findings may be that arsenic levels in groundwater of southeastern Michigan are below the
Table 5: Prevalence of Selected Behavioral Characteristics for Six County Study Area and Entire State of Michigan.
Six County Study Area Entire State of Michigan
Current smoking 25.1% 25.1%
Heavy drinking (60+ drinks/mo) 2.6% 3.7%
Binge drinking (5+ drinks on 1+ occasions in past month) 7.6% 11.7%
Cholesterol never checked 16.1% 19.3%
Ever told cholesterol high (among tested) 37.4% 33.0%
Ever told high blood pressure 33.6% 31.4%
Overweight (BMI >= 27.8 for men, >= 27.3 for women) 34.6% 33.4% Never had mammogram (among women 40+) 19.0% 22.2%
threshold for cancer induction, or there may be moderat-ing factors which were not considered here. However, if the excess risk for these cancers is small, it is possible that ecologic studies will be unable to detect significant risk, as was cautioned by the NRC subcommittee on Arsenic in Drinking Water [52](see page 223). In addition, the use of mortality rates may not be the best measure for certain cancer outcomes, such as skin and bladder cancer, which have relatively high survival rates [53].
In interpreting results of this ecologic analysis, other aspects of the study deserve consideration. This study did not assess the accuracy and precision of the arsenic labo-ratory measurements nor the proportion of each arsenic species (As(III) and As(V)) in the drinking water samples. Private wells were preferentially sampled based on home-owner requests, possibly causing an overestimate of pop-ulation-based arsenic exposure, as has been shown in another region of the US [54]. This study also did not investigate differences in the reporting and classification of underlying causes of death across counties and regions. Such reporting and classification differences are common in mortality studies of diabetes; however, these differences are less common for mortality studies of kidney and cere-brovascular diseases [55].
Additional limitations characteristic of ecologic studies also need to be kept in mind when interpreting our results: individual-level exposure has not been assessed; mortality in one geographic area does not imply that a person lived there for long periods of his or her life; and confounding variables such as smoking and obesity were not included in the quantitative analyses. Since there is no individual-level exposure assessment, interpretation of exposure at the individual-level would result in the Berk-son measurement error [52]. Furthermore, as is fore-warned by the ecologic fallacy, conclusions should not be drawn at the individual-level because there was no indi-vidual-level assessment of the exposure-disease relation-ship, only a county-level assessment.
Conclusion
These limitations not withstanding, this region of south-eastern Michigan was selected because of moderately ele-vated concentrations of arsenic in groundwater, a large percentage of the population using groundwater as their drinking water source, and low rates of migration in and out of the study area [30]. Health risks from long-term ingestion of water containing arsenic concentrations in the 10–100 μg/L range are uncertain, and this ecologic study is a first step in suggesting that moderately elevated arsenic concentrations are associated with mortality from cerebrovascular diseases, diabetes mellitus, and kidney diseases. Carefully planned individual-level
epidemio-logic studies are necessary to further investigate this rela-tionship.
Abbreviations
AAS Atomic Absorption Spectrometry
BRFS Behavioral Risk Factor Survey
CI Confidence Interval
DAAC Diseases of Arteries, Arterioles, and Capillaries
EPA Environmental Protection Agency
GF Graphite Furnace
ICD-9 International Classification of Diseases, 9th Revi-sion
ICP Inductively Coupled Plasma
MCL Maximum Contaminant Level
MDCH Michigan Department of Community Health
MDEQ Michigan Department of Environmental Quality
SMR Standardized Mortality Ratio
Competing interests
The author(s) declare that they have no competing inter-ests.
Authors' contributions
LC and RW conceived of and designed this study; RW gained access to the data and oversaw data coding and data management. JM conducted the analyses and drafted the manuscript. JN, LC, and RW offered analytical sugges-tions, assisted with interpretation, made critical revisions to the manuscript, and gave approval to the final draft.
Acknowledgements
References
1. NRC: Arsenic in Drinking Water Washington, DC: National Academy of Sciences Press; 1999.
2. USEPA: National Primary Drinking Water Regulations: Arsenic and clarifi-cations to compliance and new source contaminants monitoring; final rule. Fed Reg 2001, 66(no. 14):6976-7066.
3. Ferreccio C, Gonzalez C, Milosavjlevic V, Marshall G, Sancha AM, Smith AH: Lung cancer and arsenic concentrations in drinking water in Chile. Epidemiology 2000, 11:673-679.
4. Guo H-R, Chiang H-S, Hu H, Lipsitz SR, Monson RR: Arsenic in drinking water and incidence of urinary cancers. Epidemiology
1997, 8:545-550.
5. Hopenhayn-Rich C, Biggs ML, Fuchs A, Bergoglio R, Tello EE, Nicolli H, Smith AH: Bladder cancer mortality associated with arsenic in drinking water in Argentina. Epidemiology 1996, 7:117-124. 6. Smith AH, Goycolea M, Haque R, Biggs ML: Marked increase in
bladder and lung cancer mortality in a region of Northern Chile due to arsenic in drinking water. Am J Epidemiol 1998,
147:660-669.
7. Steinmaus C, Moore L, Hopenhayn-Rich C, Biggs ML, Smith AH:
Arsenic in drinking water and bladder cancer. Cancer Invest
2000, 18:174-182.
8. Tsai S-M, Wang T-N, Ko Y-C: Mortality for certain diseases in areas with high levels of arsenic in drinking water. Arch Environ Health 1999, 54:186-193.
9. Ch'i IC, Blackwell RQ: A controlled retrospective study of blackfoot disease, an endemic peripheral gangrene disease in Taiwan. Am J Epidemiol 1968, 88:7-24.
10. Engel RR, Smith AH: Arsenic in drinking water and mortality from vascular disease: an ecologic analysis in 30 counties in the United States. Arch Environ Health 1994, 49:418-427. 11. Chen C-J, Chiou H-Y, Chiang M-H, Lin L-J, Tai T-Y: Dose-response
relationship between ischemic heart disease mortality and long-term arsenic exposure. Arterioscl Throm Vas 1996,
16:504-510.
12. Chiou H-Y, Huang W-I, Su C-L, Chang S-F, Hsu Y-S, Chen C-J: Dose-response relationship between prevalence of cerebrovascu-lar disease and ingested inorganic arsenic. Stroke 1997,
28:1717-1723.
13. Rahman M, Tondel M, Ahmad SK, Axelson O: Diabetes mellitus associated with arsenic exposure in Bangladesh. Am J Epide-miol 1998, 148:198-203.
14. Tseng C-H, Tai T-Y, Chong C-K, Tseng C-P, Lai M-S, Lin BJ, Chiou H-Y, Hsueh Y-M, Hsu K-H, Chen C-J: Long-term arsenic exposure and incidence of non-insulin-dependent diabetes mellitus: A cohort study in arseniasis-hyperendemic villages in Taiwan. Environ Health Persp 2000, 108:847-851.
15. Mazumder DNG, Steinmaus C, Bhattacharya P, von Ehrenstein OS, Ghosh N, Gotway M, Sil A, Balmes JR, Haque R, Hira-Smith MM, Smith AH: Bronchiectasis in persons with skin lesions result-ing from arsenic in drinkresult-ing water. Epidemiology 2005,
16:760-765.
16. Milton AH, Rahman M: Respiratory effects and arsenic contam-inated well water in Bangladesh. Int J Environ Health R 2002,
12:175-179.
17. Lewis DR, Southwick JW, Ouellet-Hellstrom R, Rench J, Calderon RL:
Drinking water arsenic in Utah: A cohort mortality study. Environ Health Persp 1999, 107:359-365.
18. Buchet JP, Lison D: Mortality by cancer in groups of the Belgian population with a moderately increased intake of arsenic. Int Arch Occup Environ Health 1998, 71:125-130.
19. Varsanyi I, Fodre Z, Bartha A: Arsenic in drinking water and mortality in the southern Great Plain, Hungary. Environ Geo-chem Hlth 1991, 13:14-22.
20. Bates MN, Smith AH, Cantor KP: Case-control study of bladder cancer and arsenic in drinking water. Am J Epidemiol 1995,
141:523-530.
21. Bates MN, Rey OA, Biggs ML, Hopenhayn C, Moore LE, Kalman D, Steinmaus C, Smith AH: Case-control study of bladder cancer and exposure to arsenic in drinking water in Argentina. Am J Epidemiol 2004, 159:381-389.
22. Karagas MR, Stukel TA, Morris JS, Tosteson TD, Weiss JE, Spencer SK, Greenberg ER: Skin cancer risk in relation to toenail arsenic concentrations in a US population-based case-con-trol study. Am J Epidemiol 2001, 153:559-565.
23. Karagas MR, Tosteson TD, Morris JS, Demidenko E, Mott LA, Heaney J, Schned A: Incidence of transitional cell carcinoma of the bladder and arsenic exposure in New Hampshire. Cancer Cause Control 2004, 15:465-472.
24. Michaud DS, Wright ME, Cantor KP, Taylor PR, Virtamo J, Albanes D:
Arsenic concentrations in prediagnostic toenails and the risk of bladder cancer in a cohort study of male smokers. Am J Epi-demiol 2004, 160:853-859.
25. Steinmaus C, Yuan Y, Bates MN, Smith AH: Case-control study of bladder cancer and drinking water arsenic in the western United States. Am J Epidemiol 2003, 158:1193-1201.
26. Michigan Department of Public Health: Arsenic in drinking water – A study of exposure and clinical survey Division of Environmental Epidemi-ology, Michigan Department of Public Health, Lansing, MI; 1982. 27. Haack SK, Trecanni SL: Arsenic concentration and selected geochemical
characteristics for ground water and aquifer materials in southeastern Michigan US Geological Survey Water Resources Investigation Report 00-4171; 2000.
28. Kim MJ, Nriagu JO, Haack S: Arsenic species and chemistry in groundwater of southeast Michigan. Environ Pollut 2002,
120:379-390.
29. Kolker A, Haack SK, Cannon WF, Westjohn DB, Kim MJ, Nriagu J, Woodruff LG: Arsenic in southeastern Michigan. In Arsenic in Ground Water Edited by: Welch AH, Stollenwerk KG. Norwell, Mas-sachusetts: Kluwer Academic Publishers; 2003:281-294.
30. Meliker JR, Slotnick MJ, AvRuskin GA, Kaufmann A, Fedewa SA, Goo-vaerts P, Jacquez GM, Nriagu JO: Individual lifetime exposure to inorganic arsenic using a Space-Time Information System. Int Arch Occup Environ Health 2007, 80:184-197.
31. Slotnick MJ, Meliker JR, Nriagu JO: Effects of Time and Point-of-Use Devices on Arsenic Levels in Southeastern Michigan Drinking Water, USA. Sci Tot Environ 2006, 369:42-50. 32. Breslow NE, Day NE: Statistical methods in cancer research. Vol II: the
design and analysis of cohort studies Lyon, France: IARC Scientific pub-lications No. 82; 1987.
33. Lai MS, Hsueh YM, Chen CJ, Shyu MP, Chen SY, Kuo TL, Wu MM, Tai TY: Ingested inorganic arsenic and prevalence of diabetes mellitus. Am J Epidemiol 1994, 139:484-492.
34. American Diabetics Association: Standards of Medical Care in Diabetes. Diabetic Care 2005, 28(Suppl 1):S4-S36.
35. Anderson RN, Smith BL: Deaths: leading causes for 2002. National Vital Statistics Reports 2005, 53:17.
36. Walton FS, Harmon AW, Paul DS, Drobna Z, Patel YM, Styblo M:
Inhibition of insulin-dependent glucose uptake by trivalent arsenicals: possible mechanism of arsenic-induced diabetes. Toxicol Appl Pharmacol 2004, 198:424-433.
37. Salazard B, Bellon L, Jean S, Maraninchi M, El Yazidi C, Orsiere T, Mar-gotat A, Botta A, Bergé-Lefranc J-L: Low-level arsenite activates the transcription of genes involved in adipose differentiation. Cell Biol Toxicol 2004, 20:375-385.
38. Simeonova PP, Luster MI: Arsenic and atherosclerosis. Toxicol Appl Pharmacol 2004, 198:444-449.
39. Navas-Acien A, Sharrett AR, Silbergeld EK, Schwartz BS, Nachman KE, Burke TA, Guallar E: Arsenic exposure and cardiovascular disease: a systematic review of the epidemiological evidence. Am J Epidemiol 2005, 162:1037-1049.
40. Blair A, Dosemeci M, Heineman EF: Cancer and other causes of death among male and female farmers from twenty-three states. Am J Ind Med 1993, 23:729-742.
41. Blair A, Sandler DP, Tarone R, Lubin J, Thomas K, Hoppin JA, Samanic C, Coble J, Kamel F, Knott C, Dosemeci M, Zahm SH, Lynch CF, Rothman N, Alavanja MCR: Mortality among participants in the Agricultural Health Study. Ann Epidemiol 2005, 15:279-285. 42. Cerhan JR, Cantor KP, Williamson K, Lynch CF, Torner JC,
Bur-meister LF: Cancer mortality among Iowa farmers: Recent results, time trends, and lifestyle factors (United States). Cancer Cause Control 1998, 9:311-319.
43. Folsom AR, Zhang S, Sellers TA, Zheng W, Kushi LH, Cerhan JR:
Cancer incidence among women living on farms: findings from the Iowa Women's Health Study. J Occup Environ Med
1996, 38:1171-1176.
Publish with BioMed Central and every scientist can read your work free of charge
"BioMed Central will be the most significant development for disseminating the results of biomedical researc h in our lifetime."
Sir Paul Nurse, Cancer Research UK
Your research papers will be:
available free of charge to the entire biomedical community
peer reviewed and published immediately upon acceptance
cited in PubMed and archived on PubMed Central
yours — you keep the copyright
Submit your manuscript here:
http://www.biomedcentral.com/info/publishing_adv.asp
BioMedcentral 45. U.S. Department of Health, Education and Welfare: Smoking and
Health: A Report of the Surgeon General DHEW Publication No. (PHS) 79-50066; 1979.
46. Vasiliu O, Cameron L, Gardiner J, DeGuire P, Karmaus W: Polybro-minated biphenyls, polychlorinated biphenyls, body weight, and incidence of adult-onset diabetes mellitus. Epidemiology
2006, 17:352-359.
47. Schillo BA, Skarupski KA, McGee H, Rafferty A: Michigan Risk Factor Surveillance System: Assessing Risk Factors at the Regional Level 1989– 1993 Michigan Dept. of Public Health, Center for Health Promotion and Disease Prevention, Lansing MI; 1995.
48. Liu T, Liu J, LeCluyse EL, Zhou YS, Cheng ML, Waalkes MP: Applica-tion of cDNA microarray to the study of arsenic-induced liver diseases in the population of Guizhou, China. Toxicol Sci
2001, 59:185-192.
49. Paeratakul S, Lovejoy JC, Ryan DH, Bray GA: The relation of gen-der, race and socioeconomic status to obesity and obesity comorbidities in a sample of US adults. Int J Obesity 2002,
26:1205-1210.
50. Sturm R: The effects of obesity, smoking, and drinking on medical problems and costs. Health Affairs 2002, 21:245-253. 51. Chen CL, Hsu LI, Chiou HY, Hseuh YM, Chen SY, Wu MM, Chen CJ:
Ingested arsenic, cigarette smoking, and lung cancer risk. JAMA 2004, 292:2984-2290.
52. NRC: Arsenic in Drinking Water: 2001 Update Washington DC: National Academy of Sciences Press; 2001.
53. Adami H-O, Hunter D, Trichopoulos D: Textbook of Cancer Epidemi-ology New York: Oxford University Press; 2002.
54. Peters SC, Blum JD, Klaue B, Karagas MR: Arsenic occurrence in New Hampshire drinking water. Environ Sci Technol 1999,
33:1328-1333.