5415
1M.F. SULAIMA, 2M.H. JALI, 3Z.H. BOHARI, 4M.F. BAHAROM, 5N. BAHARIN
Faculty of Electrical Engineering, Universiti Teknikal Malaysia Melaka Malacca, Malaysia
E-mail: 1fani@utem.edu.my, 2mohd.hafiz@utem.edu.my,
3zulhasrizal@utem.edu.my, 4mohamad.faizal@utem.edu.my, 5liyana@utem.edu.my,
ABSTRACT
The Artificial Neural Network is a technique that modeled from the ways of human brain acts. The unsupervised training is a self-learning process which is performing a classification without outside teaching help. The Self-Organizing Map is an algorithm that consists process of generated neurons to organize by themselves. This paper proposes a way of analysis of the Self-Organizing Map (SOM) applied to the classification of the standard IEEE 33-bus and 69-bus distribution data. The distribution bus data were classified based on four main features: active power (MW), reactive power (MVAr), apparent power (MVA), and power factor (pf). These features are the input for SOM classification. The analysis of SOM result has shown the capability of this algorithm as a classification method in order to classify the distribution bus data.
Keywords: Self-Organizing Maps (SOM), IEEE 33-bus Distribution Data, IEEE 69-bus Distribution Data
1. INTRODUCTION
Neural Networks is one of artificial intelligence technique which is part of Classification Methodologies. The Artificial Neural Networks (ANNs) is a mathematical technique that modeled from the way of human brain acts. The human brain acts with highly complex, nonlinear, and the parallel information processor is able to perform many times faster of computation than the latest digital computer technology [1][13]. The group of interconnected neurons and nodes is included in ANN. ANN is very helpful in determining of pattern or fingerprint between input and output data [2][14]. So, Self-Organizing Maps (SOM) is one type of ANN which was introduced by Kohonen (1989).
Unsupervised training is a learning process of the network to perform own classifications of the training data without teaching from outside. The class membership is broadly by the input patterns which sharing the common features. So, the network will be able to identify the features through the range of input patterns. The important part of unsupervised
system is a competitive learning. The output neurons will compete amongst themselves to be activated, and only one will be activated at one time. The activated neuron is known as winning neurons (or winner-takes-all neurons). The lateral inhibition connections (or negative feedback paths) will allow the competition to be induced or implemented. So, the neurons are forced to organize by themselves and it is known as Self Organizing Map (SOM) [2][9][11].
One of the important parts is a topographic map. Based on the concept of the neurological inhuman system, the human sensory inputs are mapped onto corresponded areas in the cerebral cortex (in an orderly fashion). The forming of map consists of two important properties:
1. At each stage of processing, each incoming of information stores in its proper neighborhood.
2. The neurons and closely related information are kept close together so they can interact through the short synaptic connections.
EVALUATION OF POWER DISTRIBUTION NETWORK
SYSTEM BY USING SELF-ORGANIZING MAP (SOM) AS
5416 The main aim of the SOM is to transform the incoming signal pattern into a one or two dimensional discrete maps. The topologically ordered fashion is adapted to perform the transformation[11][12].
The self-organizing process consists of four major components: initialization, competition, cooperation and adaptation. For the SOM algorithm, it consists of five stages of algorithms: initialization, sampling, matching, updating and continuation.
In this study, the SOM algorithm is applied to classify the bus characteristics inside the distribution bus test system. The SOM classification is applied to the standard IEEE 33-bus and 69-33-bus distribution system respectively.
2. THE TEST SETUP
In this work, the standard IEEE 33-bus and 69-bus distribution system has been used accordingly. The radial distribution network system consists of bus data, lines, and tie-lines have been considered as the initial parameters. The distribution network is passive termination of the transmission grid, which have a high R/X ratio resulting in high distribution losses [3][10]. Each bus inside the network has their own characteristics (active and reactive power loads and power losses).
For standard IEEE 33-bus radial distribution system, it consists of 33 buses, 32 lines and 5 tie-lines. The original configuration of the distribution network system is shown in Figure 1. In this system, the substation voltage is 11kV. The total active and reactive power loads are 3715 kW and 2300 kVAr respectively. The initial active and reactive power loss in this system are 202.771 kW and 135.236 kVAr [4].
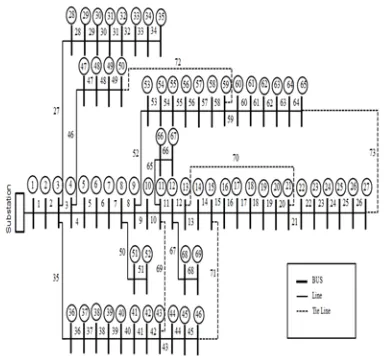
For standard IEEE 69-bus radial distribution network system, it consists of 69 buses, 68 lines and 5 tie-lines. Figure 2 shows the original configuration of 69-bus radial distribution system. The 69-bus radial system uses 12.66 kV as the substation voltage. The total active power loads in this system are 3802 kW and the total reactive power loads is 2694 kVAr. The initial active and reactive power loss are 225 kW and 102.16 kVAr respectively [4].
3. RESEARCH METHODOLOGY
3.1.SOM Algorithm
The input data points are mapped to SOM units on a usual one or two-dimensional grid. The mapping is learned from the training data samples by a simple stochastic learning process, where the SOM units are adjusted by small steps with respect to the feature vectors that are extracted from the data and presented one after another in a random order [5].
[image:2.612.333.523.101.261.2] [image:2.612.338.530.305.483.2]The most familiar version of algorithm uses the minimum Euclidean distance criterion for D-dimensional stochastic sample ∈ to find the winner unit c (best-matching unit, BMU) of the total of N SOM units [6]. The criterion Figure 1: Standard IEEE 33-bus radial distributio
5417 works so that the weight vector of the BMU fulfills the condition of Equation 1.
‖ ‖ ‖ ‖ , ∀ 1, … , (1)
The update of SOM weights corresponding to and c from the Equation 1 is described by the Equation 2 as follow:
1 ,
∀ 1, … , (2)
Where t = 0,1,… is a discrete time index. The value of the neighborhood function hci(t) can be, for example, the learning rate ∈ 0,1, if the array distance between and is smaller than the neighborhood radius r(t) and zero otherwise [7]. The desired form of convergence and characteristics of the result is ensured by the gradual decrease of and while t increases. This function resembles the kernel that is applied in the usual smoothing process. The subscript c is the index of a particular node (winner) in the grid, namely, the one with the model mc(t) that has the smallest Euclidean distance from x(t) as shown in Equation 3 below [8].
‖ ‖ (3)
The Equation 2 and 3 can be illustrated as defining a recursive step where first the input data item x(t) defines or selects the best-matching model (winner) in the grid according to the Equation 3. Then, according to Equation 2, the models at this node as well as at its spatial neighbors in the grid are modified. The modifications always take place in such a direction that the modified models will match better with the input [8].
For faster convergence and simpler computations, the learning rate control can be eliminated by using the iterative batch adaptation [7]. Meanwhile, each iterative weight modification is based on the averaged effect of a set of samples. Even if the set of samples used in the batch steps is large enough, it is important to note that the modification steps must be iterated several times, because the choice of the BMU (index c) depends on the current values of mis as shown in Equation 4 correspondingly.
∑
∑ (4)
The Equation 4 is used for the motivation of the iterative solution for the mi, known as the batch computation of the SOM (Batch Map).
3.2.SOM Visualization
The U-matrix or unified distance matrix that visualized the distance between adjacent units
in the SOM. The colors in the U-matrix show the value of the unit for the particular variable, instead, to show the average distance of that unit to other units.
The dark areas are where the distance between the nodes is large. The light areas are where the nodes are close to each other. The U-matrix visualizes distance between neighboring map units, thus shows the cluster structure of the map: high values of the U-matrix indicates the cluster border, uniform areas of low values
indicates cluster themselves.
3.3.Research Process
In this research, the Self-Organizing Map was applied to classify the bus of the standard IEEE 33-bus and 69-bus based on the bus characteristics. In this work, the bus data has been transformed into a SOM data format. The bus data, including the active power (MW), reactive power (MVAr), apparent power (MVA), power factor (pf), and the label of buses (B1 to B33 and B1 to B69) has been classified based on bus characteristic as well. The general process of this technique is shown in Figure 4 significantly.
5418 The hexagonal topologytype is used in this work. The hexagonal lattice is the recommended topology type because all 6 neighbors of neurons have the same distance. The simulation of SOM consists of the combination between the various normalization methods (‘var’, ‘range’, ‘log’, and ‘logistics’) and the optimum number of neurons is set to 220. The ‘var’ data input will normalize the variance variable to unity and means to zero. For the ‘range’ input data will scale the variable values between zero and one. The ‘log’ is a logarithmic transformation and the ‘logistics’ or softmax transformation scales all possible values between zero and one [2].
For SOM result analysis, the important parts that will consider in result analysis are map size, training time, Quantization error, Topographic error, and the U-matrix analysis. The training time should be lower or equal to 5 seconds and it will consider as a faster training time. The Quantization error and Topographic error should be lower (near or equal to zero). The map size will be affected by the size of U-matrix correspondingly.
4. RESULTS AND ANALYSIS
The result of this work can be divided into two parts (normalization method analysis and U-matrix analysis). The first part consists of four
sets of SOM parameters; normalization methods and number of neurons need to be applied and optimized respectively. Data of normalization is very important in forming the maps. The subsection 4.1 and 4.2 represent the results and analysis accordingly.
4.1.Normalization Method Analysis for 33-bus
and 69-bus Data
The comparison is used to decide the best normalization type based on the lowest Quantization error and Topographic error with the faster of training time ( 5sec). The Table 1 and Table 2 (Appendix A) shows the comparison between the MATLAB simulation result of normalization method for IEEE 33-bus and 69-bus data.
Based on Table 1 and Table 2 (Appendix A), all normalization method achieves the fastest training time (3sec) with the number of neurons is 220. The good mapping capability and quality are referred from the fastest training time during the classification process.
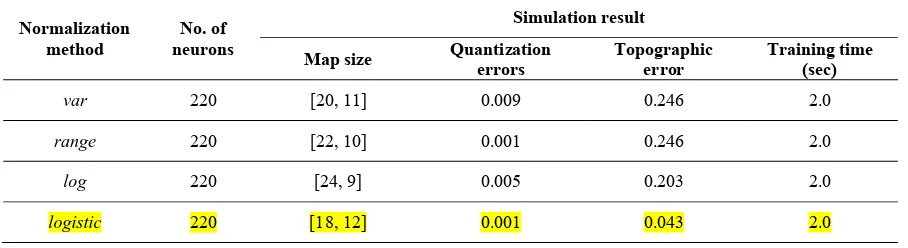
In Table 1, the comparison between the normalization method show that the ‘log’ method achieves very small Quantization error and Topographic error (0.000 for both errors). Meanwhile, in Table 2, the best normalization method for 69-bus data is ‘logistic’ which have low Quantization and Topographic errors (0.001 and 0.043 respectively). The low quantization error and topographic error show that the good and smooth classification is achieved through the hexagonal lattice for all normalization method [2].
4.2.U-Matrix Analysis
In this work, the hexagonal topology is used to get higher resolution and faster result. The U-matrix for 33-bus and 69-bus data are shown in Figure 5 and 6 respectively. Based on the U-matrix in Figure 5, the neurons are labeled by B1 to B33 presents the 33-bus data while bus B1, B24, and B30 as formed light boundary area which means they have different characteristics between the neurons among the buses.
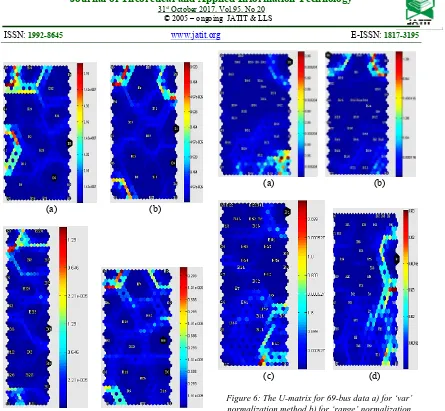
Based on the U-matrix in Figure 6, for 69-bus data system; the neurons are labeled by B1 to B69 respectively. The bus B1, B49, B61, and B64 have the characteristic of the heavy light area which means a high distance factor when it is compared to the other neurons.
Export the bus data
Set the topology type (hexagonal) and normalization method (var, range,
log, and logistics)
Set the number of neurons
(220)
Analysis the SOM result
5419
(a) (b)
(a) (d)
(c)
(a) (b)
(c)
(d)
Figure 5: The U-matrix for 33-bus data a) for ‘var’ normalization method b) for ‘range’ normalization method c) for ‘log’ normalization method d) for
‘logistic’ normalization method
The grouping process for bus data is achieved by inspecting the bus characteristics that are grouped together and placed in a darker color border for shorter distances and inside lighter color which signifies higher distances.
It is proven that from the U-matrix visualization, the different characteristic between the bus inside the distribution network based on the value of active power, reactive power, apparent power and also the power factor can be analyzed through SOM algorithm technique.
(a) (b)
[image:5.612.102.547.43.454.2]
(c) (d)
Figure 6: The U-matrix for 69-bus data a) for ‘var’ normalization method b) for ‘range’ normalization method c) for ‘log’ normalization method d) for
‘logistic’ normalization method
5. CONCLUSION
5420 of the real distribution system network in the future.
ACKNOWLEDGEMENTS
The authors would like to thank the Universiti Teknikal Malaysia Melaka for the financial support thru grant no. RAGS/1/2015/TK0/FKE/02/B00093
REFERENCES
[1] S. V. Verdu, M. O. Garcia, C. Senabre, A. G. Marin and F. J. G. Franco, "Classification, Filtering, and Identication of Electrical Customer Load Patters Through the Use of Self-Organizing Maps" IEEE Transactions on Power Systems, vol. 21, pp. 1673, Nov 2006.
[2] Z. H. Bohari et al., “Feature Analysis of Numerical Calculated Data from Sweep Frequency Analysis (SFRA) Traces Using Self Organizing Maps,” Journal of Technology (Sciences & Engineering), 67:3, pp. 37-42, 2014. [3] A. K. Saonerkar, B. Y. Bagde, “Optimized DG
Placement in Radial Distribution System with Reconfiguration and Capacitor Placement using Genetic Algorithm” in IEEE International Conference on Advanced Communication
Control and Computing Technologies, 2014.
ICACCCT 2014, 2014, pp. 1077-1083.
[4] D. Sudha Rani, N. Subrahmanyam, M. Sydulu, “Self Adaptive Harmony Search Algorithm for Optimal Network Reconfiguration”, IEEE, pp. 1-6, 2014.
[5] T. Kohonen, J. Hynninen, J. Kangas,. J. Laaksonen, “SOM_PAK: The Self-Organizing Map Program Package”, Lab. of Computer and Information Science, Helsinki University of Technology, January 1996.
[6] T. Kohonen, “The Self-Organizing Map”, Proceedings of the IEEE, vol. 78, pp. 1464-1480, 1990
[7] T. Kohonen, “Self-Organizing Map”, Springer Series in Information Science, vol. 30, Springer, Berlin, Heidelberg, New York, 1995
[8] T. Kohonen, “Essential of the Self-Organizing Map”, Neural Network, vol. 37, pp. 52-65, 2013 [9] M.H.Jali, Z.H.Bohari, M.F.Sulaima, M.N.M.Nasir
and H.I.Jaafar, "Classification of EMG Signal Based on Human Percentile using SOM", Research Journal of Applied Sciences, Engineering and Technology (RJASET), 2014. [10] MF Sulaima, SN Othman, MH Jali, MS Jamri,
MNM Nasir, ZH Bohari, “A 33kV Distribution Network Feeder Reconfiguration by Using REPSO for Voltage Profile Improvement” , International Journal of Applied Engineering Research (IJAER), vol 9(18), pp 4569 - 4582, 2014
[11]Z. H. Bohari, H. S. Azemy, M.H. Jali., M.N.M. Nasir, M.F. Baharom, M.F. Sulaima, “Reliable short term load forecasting using self organizing map (SOM) in deregulated electricity market”, Journal of Theoretical and Applied Information Technology, vol 79(3), pp 3898-394, 2015
[12]ZH Bohari, MAM Yusof, MH Jali, MF Sulaima, MNM Nasir, “Feature combination analysis in smart grid based using SOM for Sudan national grid”, IOP Conference Series: Materials Science and Engineering, vol 100(1), 2015
[13]Mohd Hafiz Jali, Tarmizi Ahmad Izzuddin, Zul Hasrizal Bohari, Mohamad Fani Sulaima, Hafez Sarkawi, “Predicting EMG Based Elbow Joint Torque Model Using Multiple Input ANN Neurons for Arm Rehabilitation”, 16th International Conference on Computer Modelling and Simulation (UKSim), 2014 UKSim-AMSS, IEEE, pp 189-194, 2014.
5421 Appendix A
Table 1: The comparison between the types of normalization method for 33-bus data
Normalization method
No. of neurons
Simulation result
Map size Quantization errors Topographic error Training time (sec)
var 220 [20, 11] 0.004 0.030 3.0
range 220 [20, 11] 0.001 0.030 3.0
log 220 [31, 7] 0.000 0.000 3.0
logistic 220 [22, 10] 0.001 0.000 3.0
Table 2: The comparison between the types of normalization method for 69-bus data
Normalization method
No. of neurons
Simulation result
Map size Quantization errors Topographic error Training time (sec)
var 220 [20, 11] 0.009 0.246 2.0
range 220 [22, 10] 0.001 0.246 2.0
log 220 [24, 9] 0.005 0.203 2.0
[image:7.612.102.556.319.443.2]