IJPSR (2014), Vol. 5, Issue 7 (Research Article)
Received on 17 January, 2014; received in revised form, 05 March, 2014; accepted, 14 May, 2014; published 01 July, 2014
STUDYING THE EFFECT OF DISPERSED DRUG CRYSTAL IN THE ORGANIC PHASE ON THE ENCAPSULATION BY SOLVENT EVAPORATION TECHNIQUE; (1) EFFECT OF DRUG LOADING EXTENT ON THE PRODUCT SIZE ANALYSIS, MORPHOLOGY AND DRUG CONTENT
Omar Mady
Department of Pharmaceutical Technology, Faculty of Pharmacy, Tanta University, Egypt
ABSTRACT:Eudragit RS100 microcapsules containing Aspirin as a model drug was prepared using solvent evaporation technique. The drug was dispersed in the organic phase and poured into the aqueous phase with stirring until microcapsules formation. The product was collected by filtration and air dried. The particle size analysis of the products was done and normal distribution curve showed for the same size range of different theoretical drug content, microcapsules had different size distribution. The sphericity of the microcapsule was greatly affected by the theoretical drug loaded. The mean microcapsule size decreased upon increasing the percent of theoretical drug content and then increased again. The surface of spherical microcapsule was smooth and no drug crystals attached to the surface. It was noticed drug crystals in the microcapsule structure. The mean actual drug content was markedly higher than the theoretical one. In the same product prepared with the same theoretical drug content, there was a relationship between the actual drug content and the product particle size. These findings were explained according to the division of emulsified microcapsule during preparation by division mechanism. In this division mechanism, there are two forces; one is the viscosity of the emulsified microcapsule which depends upon the polymer content. This force works against emulsified microcapsule division. The second is the drug solid particle weight in the emulsified microcapsule droplets and the stirring force effect on it which creates and potentiates the division mechanism. These two interacted forces, may be, the controlling factor for the resulting findings.
INTRODUCTION: Incorporation of a drug within microcapsules plays a major factor on its release. Microcapsules can be classified according to the method of drug incorporation into reservoir type in which a solid or a liquid drug is enveloped in the polymer membrane and matrix system in which the drug is dissolved or dispersed in the polymer
matrix 1. These two types of microcapsule
structures can be achieved by the use of solvent evaporation technique.
QUICK RESPONSE CODE
DOI:
10.13040/IJPSR.0975-8232.5(7).2620-30
Article can be accessed online on:
www.ijpsr.com
DOI link: http://dx.doi.org/10.13040/IJPSR.0975-8232.5(7).2620-30
When the drug is dissolved and/or dispersed in the microcapsule structure, its release has what is
called Burst effect 2, 3. In many cases, incomplete
drug release occurs 2-6. Mady et al 2 found that, the
percent of drug loaded could not be increased more than 20%. Many trials were made to increase the percent of the actual drug content in the spheres.
One of them involved the dispersion of drug in the organic phase which led to decrease the drug
diffusion to the aqueous phase. Benoit et al 3, tried
to increase the actual drug content using theoretical drug content up to 60%. In every case, the authors found that the actual drug content was not more than 23% although the drug (5-flurouracil) was dispersed in the organic phase as drug crystals.
Keywords:
Division mechanism, Microcapsule, Eudragit RS100, Aspirin, Particle
size distribution analysis, Drug content, Electron scanning
microscopy
Correspondence to Author:
Omar Mady
Assistant Professor of Pharmaceutical Technology, Department of
Pharmaceutical Technology, Faculty of Pharmacy, Tanta University, Egypt
Lu et al 7 suspended AZT in the polymer solution before pouring into the aqueous phase and tried to prepare microspheres with drug/polymer ratio from 1:2 to 2:1. They reported that, it was very difficult to produce microspheres with higher drug to polymer ratios.
Polyacrylate polymers (Eudragit) have been widely evaluated as polymeric coating materials for the development of microcapsules and microspheres. Benita et al 8, prepared nifedipine, microspheres on a large scale using 1:1drug: polymer as a microencapsulating material. The authors stated that the product was spherical micromatrix comprising an internal void space and a polymeric membrane of variable thickness where the drug was dispersed either molecular or in solid state,
depending on the payload extent. Mady et al 2
could prepare placebo Eudragit RS100
microspheres in different pH media using different anti-aggregating agents as a method to increase the % of drug loaded.
It was found that the morphology, the surface and the internal microsphere structure were dependent on the pH and the type of antiaggregating agent used. As an example for acidic drugs that can be dissolved in the organic phase, Ibuprofen microspheres on small scale (10 gm / experiment) and large scale (50 gm / experiment) using Eudragit RS100 as a microencapsulating material were prepared 2.
It was reported that the encapsulation efficiency depends on the solubility of the drug in the solvent and continuous phase. An increase in the concentration of polymer in a fixed volume of organic solvent resulted in an increase in encapsulation efficiency 9. Shidhaye et al 10, reported that, when the drug is soluble in alcohol, alcohol diffused out first to the external aqueous phase. Then, it was possible that the drug may diffuse out of emulsion droplets together with alcohol before the droplet solidification leading to a low loading efficiency. This tendency of the drug would become more prominent when the solubility of the drug in dichloromethane was low, since the drug preferentially partition into the alcohol phase when it moved into aqueous phase from a solvent mixture. In contrast to this condition, glipizide is water insoluble drug and also is practically
insoluble in alcohol but soluble in dichloromethane
11
. As a result glipizide shows greater encapsulation efficiency.
Aspirin has a limited solubility in dichloromethane. Accordingly, the aim of this work was oriented towards the preparation of sustained release aspirin microcapsules to study of the effect of the drug loading extent in the microcapsules on the product morphology and also of the actual drug loaded percent.
MATERIALS AND METHODS
Materials: Acetylsalicylic acid crystals (ADWIC, Egypt), Eudragit RS100 (Rhom Pharma, Germany), Gelatin (Pharma Production, Austria). All other chemicals were of analytical grades.
Equipment: Mechanical stirrer (Heidolph,RZR-2000,Germany),Electron microscop ( leitz 10000, Wetzlar, Germany),UV/visible spectro¬hotometer (Perkin-Elmer,Lambda 1,USA),Vibrating set of sieves (VEB /letalweberei Neustadt, Orla, DDR).
Methods:
Preparation of Microcapsule: Microcapsules were prepared by solvent evaporation technique. The aqueous solution was 200 ml of 0.1N HC1 containing 0.5 gm of gelatin as an antiaggregating agent. The organic phase was composed of a constant volume of dichloromethane (20 ml) containing the required weight of Eudragit RS100. The required weight of drug was dispersed with stirring in the organic phase until a homogeneous dispersion was obtained. Then, the prepared homogeneous organic phase was poured onto the stirred aqueous phase at 500 rpm. Stirring was continued until complete evaporation of the
dichloromethane. The microcapsules were
collected by filtration and air dried. In every case, the total amount of polymer and drug was 10 gm. Microcapsules containing 20%, 33.33%, 50%, 66.66% and 80% theoretical drug content were prepared.
1. Product size analysis: The mean particle sizes of the microspheres were determined by sieving
method 12. A definite weight of Eudragit RS100
set of standard sieves and shaken for 10min using mechanical sieve shaker. The resulting fractions remaining on the sieves were weighed
to determine the particle size distribution 13.
The mean microspheres diameter was
calculated after sieving. The mean particle size of microspheres was calculated using the
following formula 14;
2. Electron Scanning Microscope examination: The morphology and the internal structure of the products were studied using an electron microscope with different magnifications. The magnification used was depending on the shape of the product and also the best vision.
3. Determination of the actual drug content: After standardization of the method of drug analysis in dichloromethane, an accurate weight (100 mg) of each product was dissolved in 100
ml of dichloromethane. The produced
dichloromethane solution was measured
spectrophotometrically at 241 nm using dichloromethane as a blank. The procedure was carried out in triplicates. The mean actual drug content (MADC) and encapsulation % (%E) were calculated using the following equations
15, 16
:
RESULTS AND DISCUSSION: As a trial to increase the amount of drug content in the product prepared using solvent evaporation technique, aspirin crystal was selected as a model drug
because of its limited solubility in
dichloromethane. After preparation, in case of using 20% TDC, it was noticed there was some big size floated microcapsules. The product was filtrated using 40 µm size diameter sieve. The size distribution of the products was studied using sieve particle size determination method. Different distribution plots were carried out to study the size distribution of the products. The frequency
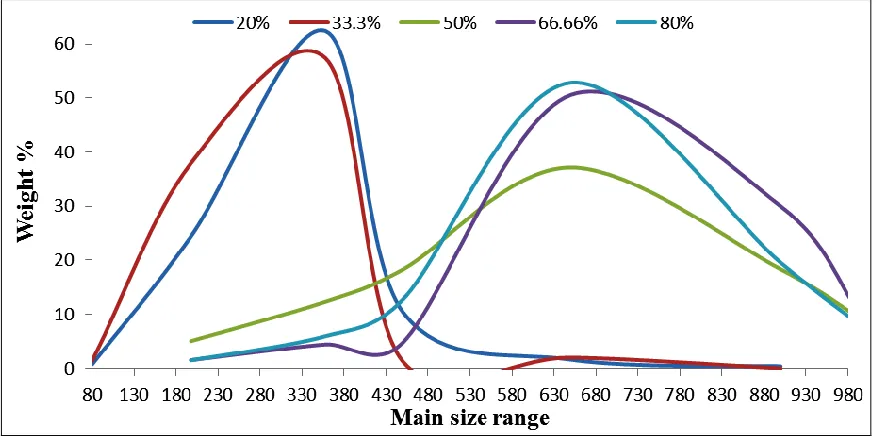
distribution curve (figure 1) illustrated that, all
products prepared using different theoretical drug
contents had different particle size distribution 17.
The particle size distribution curve is unimodal in
nature 18. There are also a sharp cut of the
[image:3.612.88.526.508.727.2]frequency distribution curve between the products prepared on using 20%, 33.33% theoretical drug content and that prepared on using 50%, 66.66% and 80% theoretical drug content.
Table 1 shows the size range and mean diameter (µm) of each product. From the table, it can be noticed that, the size range and mean diameter of the product prepared on using 20% theoretical drug content is higher than that on using 33.33% theoretical drug content which is in agreement with what is noticed before about the presence of big size floated microcapsules in case of using 20%
TDC. Abdallah et al 19 found that, the mean
diameter of the microspheres was increased significantly as the drug: polymer ratio was varied from 1:1 to 1:5. Low concentration of Eudragit RS100 resulted in a low viscosity of the polymer solution which in turn resulted in smaller emulsion
droplets in the aqueous phase 20, 21.
TABLE 1: PARTICLE SIZE DISTRIBUTION OF EUDRAGIT RS100 MICROSPHERES
Theoritical drug content
Size range (µm)
Mean Diameter (µm)
20% 80-650 333
33.33% 80-450 300
50% 198-1000 631
66.66% 198-1000 726
80% 198-1000 675
Also, from the same table, it can be also noticed that, the size range and mean diameter of the products prepared on using 50%, 66.66% or 80% theoretical drug content are nearly double to that prepared on using 20% or 33.33% theoretical drug content products which is in agreement with what stated before about there is a sharp cut in the frequency distribution curve between these products. This finding is not in agreement with what stated before about increasing the particle size with increasing the polymer ratio.
Not only that but also, although the products prepared on using 50%, 66.66% or 80% have the same particle size range, they have an interested mean diameter. The mean diameter of the product prepared on using 66.66% theoretical drug content (lower polymer concentration) has higher mean diameter than that prepared on using 50%
theoretical drug content (higher polymer
concentration) but lower than that on using 80% theoretical drug content. In addition to what found before, it can be also noticed that, behind the size range of the frequency distribution curve of the product prepared using 33.33% drug content, there is 2% of the product with another mean size range
(650 µm). This finding indicated the presence of small amount of larger particles along with the
larger particles size 18. The same finding can be
also observed from the frequency distribution curve of the product prepared on using 66.66% TDC. The difference is, it occurred before the frequency distribution curve of the product indicating the presence of small amount of smaller particles along with the smaller particles size.
Cumulative frequency plot showed sigmoidal curve results with the mode being that particle size at the greatest slope. Log- normal distribution curve was also plotted and showed no improvement in the data representation although some has a typical
bell-shape curve 9. Accordingly, it can be
concluded that, there is a disturbance in the relationship between the theoretical drug content and the particle size distributions of the products. As a trial to clarify this finding, the surface topography, particle size morphology and an
internal cross-sectional structure of the
microcapsules (which may be found by chance) were studied using scanning electron microscopy
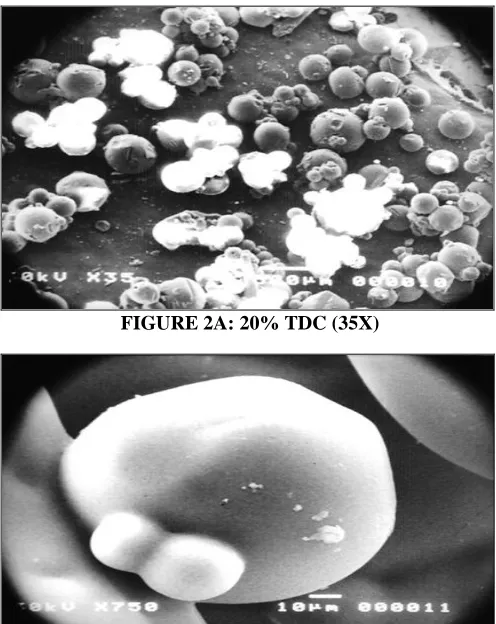
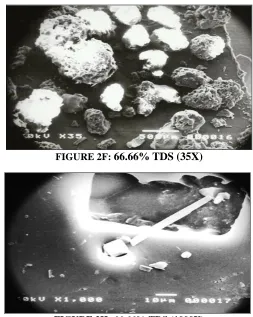
(ESM). Figure (2A-H) shows the ESM
photographs of all products at different
magnifications. Figure (2A) shows that the microcapsules prepared on using 20% TDS having a narrow size distribution, smooth surface, some big one which engulf some smaller ones and some aggregated microcapsules in addition to some polymer pieces. No crystals of drug were visible on the surfaces indicating complete incorporation
within the polymeric matrix 22. At the same time,
figure (2b) is ESM for the same product with magnification of 750X shows microcapsule with very nice smooth surface, no drug crystal attached to the surface but some pieces of the polymer and also some small microspheres.
structure but as a result of another possibility, it was not occurred. The possibility which acted against the splitting may be the high concentration of the polymer (80% TPC) which delays the splitting till the surface structure was formed. This explanation may be supported with the finding that, there is no drug crystal but smooth and non-porous microcapsule surface.
ESM of microcapsules prepared using 33.33% TDC (figure 2C) shows that, the product is aggregated microcapsules and particles took the shape of its internal structure with smooth and pores like cavities. These cavities do not like the porous surface which is documented in some literatures of the porous surface microcapsules but cavities as a result of escaping of something from the particle. Fortunately one can see the internal structure of the particles which looks like a matrix with big cavities inside indicating the cleavage of drug crystal from the matrix structure. This form can be better noticed from figure (2, D) with 200X magnification.
At the same time, figure (2E) which is for particles prepared using 50% TDC shows the same finding which stated before with an increase in the amount of the polymer pieces attached to the surface of the particles. Increase in the amount of polymer pieces attached to the microcapsules is not in agreement with decreasing the percent theoretical polymer content and increasing the percent of theoretical drug content. Again fortunately, figure (2F) which is for particles prepared with using 50% TDC and photographed at 1000 times magnification shows that, there is a big microcapsule with smooth surface and narrow ink at the top.
Attached to the narrow ink top another small one separated from the mother one with another narrow ink branch and the rest of two broken ones with drug crystals remain above. The brocken particles may be responsible about the increasing of polymer pieces attached to the microcapsule surface which observed before. This finding suggested that, during microcapsule formation and during the emulsification phase and before the formation of microcapsule structure there was a division of the emulsified microcapsule like bacterial division.
If the daughter one has the chance to divide it before the formation of the microcapsule wall from her mother, it will form smaller one. If the microcapsule wall is formed before the division, we get the structure which noticed before. ESM of particles prepared on using 66.66% TDC (figure 2G) shows spongy like structure particles. At the same time ESM for the same product at 1000 times magnification shows a microcapsule with smooth and non-porous surface with polymer pieces attached on it. It can be also shown the escaping of drug crystal from a cavity in the surface which may be due to stirring effect and the density of the drug crystal.
[image:5.612.314.562.420.732.2]There is also a huge deep cavity with some drug crystal which may be due to destroying the microcapsule wall at this part. From the above and from knowing the low solubility of the drug in dichloromethane, it could be concluded that the drug is dispersed in the microcapsule structure which is a reservoir type. The dispersion of the drug crystal in the emulsified polymer droplets has a big role in the microcapsule shape and surface which will be reflected on the frequency distribution curves stated before.
FIGURE 2A: 20% TDC (35X)
FIGURE 2C: 33.33% TDC (35X
FIGURE 2D: 33.33% TDS (200)
FIGURE 2E: 50% TDS (35X)
FIGURE 2F: 50% TDS (100X)
FIGURE 2F: 66.66% TDS (35X)
FIGURE 2H:66.66% TDS (1000X)
The mean actual drug contents (MADC) in the prepared microcapsules using different theoretical
drug contents were determined. From table 2, it
could be observed that, MADC was increased than theoretical drug content (TDC) with increasing TDC. The values difference between MADC and TDC named increasing % (%I). From the table it can be noticed that the increasing percent (% I) increased in case of using 33.33% TDS than that in case of using 20% and then decreased gradually to become less than one in case of using 80%TDC. The % of drug encapsulation (%E) on using 33.33% TDS was found to be higher than that on using 20%TDC and then started to decrease till reaching to a normal value on using 80% TDC.
Increase the actual drug content more than theoretical drug content was also reported in some
literatures. Khattab et al 23 prepared terbutaline
sulphate (dispersed in the organic phase) microspheres using eudragit RS100 and reported that the best drug content was (141.1%) and the
lowest value was (51.8%). Guyat et al 24 studied
[image:6.612.53.298.51.695.2]viscosity increased, the percent of drug loaded decreased but the difference were not statistically significant. When hydroxypropylcellulose (HPC) or hydroxypropylmethylcellulose (HPMC) were
associated with ethylcellulose, nifedipine
[image:7.612.73.538.140.256.2]entrapment efficacy was closer or superior to the theoretical value. This likely is due “at least in part” to a possible migration of HPC or HPMC into the aqueous phase leading to an enhancement of drug – polymer ratio.
TABLE 2: EFFECT OF THEORETICAL DRUG CONTENT ON DRUG LOADING%
TDC MADC % I % E TPC APC %PL
20.00% 30.107 10,107 150.537 80.00% 69.893 10.107
33.33% 52.581 19.251 157.757 66.66% 47.419 19.251
50.00% 66.595 16.595 133.160 50.00% 33.405 16.595
66.66% 72.333 5.673 108.510 33.33% 27.667 5.673
80.00% 80.965 0.965 101.206 20.00% 19.035 0.965
TDC= theoretical drug content; MADC=mean actual drug content; % E = % encapsulation; %I= MADC – TDC; TPC= theoretical polymer content; APC= actual polymer content=(100mg product weight - MADC); %PL=TPC-APC
Yuksel et al 25 encapsulated indomethacin in
PMMA with and without triacetin. The authors found the entrapment efficiency on using triacetin (plastizer) was 102.3% and reported that the increasing drug entrapment efficacy in the microcapsule might be attributed to the fact that the drug molecules and triacetin together with the solvent are easily diffused into the polymer matrix in the presence of a plastizer.
Mallick et al 26 prepared ethylcellulose, eudragit
RS or eudragit RL microspheres containing verapamil. The drug was dispersed in the organic phase. The authors found that (table 2, comparing initial drug loading % and entrapped drug loading %) there is an increase in entrapped drug loading percent than the theoretical drug content in all ratios except on using 80% TDC which is nearly equal to ADC. The entrapped drug loading close to the initial drug was due to the insolubility of veapamil hydrochloride in the non-solvents.
Also from table 2, the values and finding will be opposite when actual polymer content (APC) and percent of polymer loss (%PL) are considered. These results may be explained on the following basis:
The drug was dispersed in dichloromethane containing polymer until a homogenous was obtained (organic phase). The organic phase was poured onto the aqueous phase while stirring.
Due to using high concentration of the polymer, stirring may lead to the formation of an emulsion of
small droplets due to mechanical stress 27 which
could be passed from the sieve during product
collection 2. This led to increase the ADC over
TDC of the product. This explanation may be accepted in case of using low TDC but what will happen in opposite case.
At the same time, it is not so easy to ignore the effect of the presence of suspended solid particle(s) in the emulsified droplet in addition to the effect of stirring on the emulsified droplet containing solid particle(s) on the formation of small empty micro or nanospheres. This effect can be clarified from
figure 3.
[image:7.612.315.565.522.699.2]Suppose there is a solid particle(s) in an emulsified droplet suspended in an aqueous phase. The presence of solid particle(s) in the emulsified droplet leads to tailing of the droplet due to the particle(s) weight (falling down due to gravity). The presence of polymer in the emulsified droplet tends to prevent this effect by increasing the viscosity of the droplet media (mechanism of suspending agents). As a result of stirring, the emulsified droplet will be rod-shaped and the solid particle(s) will be directed to the outside due to centrifugal force of stirring.
Further stirring will lead to gradual tailing and then splitting of the emulsified droplet into two droplets, one of them is the drug solid particle(s) surrounded by a film of the organic phase containing polymer and the other is an empty emulsified droplet(s) of the organic phase containing dissolved polymer which lead to formation of an emulsion of small droplets as a result of the mechanical stress of stirring. This was suggested to be known as a division mechanism. This suggested mechanism (Division mechanism) is supported with the fact that, solvent evaporation technique, as a method for encapsulation, depends on the emulsification of the internal phase, containing dissolved polymer and dissolved or dispersed drug, into the external phase in the presence of antiaggregating agent.
Then, the internal phase started slowly to diffuse to the external phase which will be started to evaporate by time during stirring. As a result of diffusion of the organic to the aqueous phase, the microcapsule structure will be formed specially the outer wall which is directly contact with the aqueous phase. Accordingly, it can be concluded that, the diffusion of the organic phase to the aqueous phase and its evaporation from the system is a rate limiting step in the microcapsule formation by solvent evaporation technique.
Since dichloromethane is insoluble in water, so it can be expected (and so also found practically in this work and other literatures) that it is a long time process which give, in the fact, the chance for the division mechanism to occur. Increasing the viscosity of the emulsified droplet by increasing the polymer concentration will be opposing the division mechanism.
From table (2), it can be noticed that %PL in case of using 20%TDC is lower than that in case using 33.33 % TDC. That is may be due to low TDC and high TPC used which lead to increase the viscosity of the emulsified droplet. This finding is in agreement with the role of the viscosity in opposing of the division mechanism. Accordingly it can be concluded that the using of 80% TPC, in this work, lead to increase the viscosity of the emulsified droplet which is the limiting factor in the division process.
As a result the percent of drug encapsulation on using 33.33% TDC was higher than that on using 20% TDC (table 2). On the other hand, the increase of the concentration of the dispersed solid particles in the emulsified droplet (by using 50 %TDC or more) will oppose the chance of the formation of an empty emulsified droplets organic phase (division mechanism) due to the need of the volume of the organic phase containing polymer for coating the dispersed solid particles after division. This procedure will be increased with increasing the % of TDC till special concentration at which the volume of the organic phase containing dissolved polymer will be only enough to coat the dispersed solid particles inside after the division.
In this case the division will be between solid particles coated with organic phase containing polymer which occurred as a result of suspended particle size, drug density and centrifugal force. This is may explain the finding that the % E started to decrease on using 50%TDC till reached to normal percent on using 80%TDC (table 2).
At the end it can be also stated that, the division mechanism of the emulsified droplets lead to the formation of all structures which was observed by ESM which is also reflected on the particle size and frequency distribution curve of the products stated before.
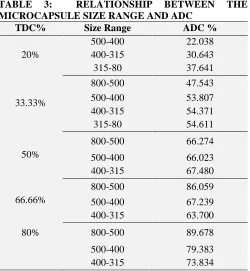
The opposite was observed in case of using 66.66% and 80% TDC. But in case of using 33.33% TDC the biggest microcapsule size has the lowest ADC then started to be equal in the other particle size ranges. At the same time, on using 50 % TDC different microcapsule sizes had the same ADC. In addition, there was a clear difference in the ADC in different microcapsule sizes prepared by using 20% and 80% TDC. On contrary, this difference was only observed in the large microcapsule size in case of 33.33% and 66.66% TDC. These findings can be also explained according to the suggested division mechanism.
Division mechanism depends on two forces. The first one is the solid dispersed drug particles in the emulsified droplet in addition to effect of centrifugal force of stirring on the emulsified droplet. The second one (which is opposing the division force) is due to the viscosity of the
emulsified droplet which depends on the
concentration of the polymer.
The effect of these two opposite forces is quite clear on using 20% and 80% TDC. Increasing the viscosity of the emulsified droplet on using 20% TDC and the increase of the solid dispersed drug on using 80% TDC controlled the division of the emulsified droplet(s).
As a result, the ADC was greatly dependent on the microcapsule size. The limit solubility of aspirin crystal in dichloromethane led to dispersion of the drug in the organic phase. High concentration of the polymer used in case of using 20% TDC may be lead to formation of big size floated microcapsules with lower ADC. This may explain the finding that on using 20% TDC increasing the microcapsule size led to a decrease in the ADC.
On the other side, in case of using 80 % TDC it could be expected the lager microcapsule contains more drug crystal than smaller one. This may also explain the finding that in case of using 80% TDC increase the particle size led to increase the drug content. Decreasing the viscosity of the emulsified droplet by using low polymer concentration and increasing the solid content in emulsified droplet led to improve the homogeneity of the division process.
Accordingly, there was nearly homogeneity in the ADC on using 33.33%TDC with different sizes except the largest one which has the lowest ADC. This may be due to stirring distribution force during microcapsules preparation specially; it was found that the percent weight of this size range was small amount during sieve analysis.
At the same time the maximum homogeneity in the division process between the two forces and their effect on the particle size formation and ACD% would be observed in case of using 50% TDC since there is no difference in ACD of different particle size product.
TABLE 3: RELATIONSHIP BETWEEN THE
MICROCAPSULE SIZE RANGE AND ADC
TDC% Size Range ADC %
20%
500-400 22.038
400-315 30.643
315-80 37.641
33.33%
800-500 47.543
500-400 53.807
400-315 54.371
315-80 54.611
50%
800-500 66.274
500-400 66.023
400-315 67.480
66.66%
800-500 86.059
500-400 67.239
400-315 63.700
80% 800-500 89.678
500-400 79.383
400-315 73.834
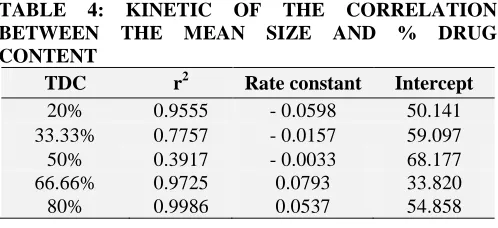
Figure 4 represents the relationship between the mean size range and ADC of each TDC. From the figure, it is clear that the relationship is a straight line with a negative slope in case of 20% TDC and with positive one in case of 66.66% and 80% TDC (table 3).
[image:9.612.316.566.257.528.2]FIGURE 4: RELATIONSHIP BETWEEN THE MEAN PRODUCT SIZE AND MADC
TABLE 4: KINETIC OF THE CORRELATION BETWEEN THE MEAN SIZE AND % DRUG CONTENT
TDC r2 Rate constant Intercept
20% 0.9555 - 0.0598 50.141
33.33% 0.7757 - 0.0157 59.097
50% 0.3917 - 0.0033 68.177
66.66% 0.9725 0.0793 33.820
80% 0.9986 0.0537 54.858
At the same time in case of 66.66% or 80% TDC, the increase in the mean size range led to the increase of ADC i.e. in these cases the division of the emulsified droplet is controlled by its solid drug particle content. From table (4), it can be also noticed that there is no correlation between the mean size range and ADC in case of using 33.33%
and 50% TDC since the value of r2 is low
indicating that these two forces are working simultaneously together at the same time. On trying to fit the curves in these cases it was found that the fitting of the curves were following polynomial
order 2 with value of r2 equal one.
From figure 4, it can be noticed that the fitting curve in case of using 33.33% TDC is directed downwards which may indicate that the viscosity has the upper hand. At the same time the fitting curve in case of using 50% TDC is directed upwards indicating that the solid particles have the upper hand. These results can be also supported with the finding that ADC of the largest microcapsule prepared on using 33.33% TDC has the lowest ADC.
CONCLUSION: From this work, it could be
concluded that, the drug loaded in the
microcapsules structure can be increased by controlling the drug solubility in the organic phase and using the drug in the crystalline form. This lead to enhance the division of the emulsified internal phase by the factors stated before. Also it could be increasing the theoretical drug content to extend that there is no loss of polymer which represent an economic process and decrease the weight of the dose which has to contain an accurate weight of the drug. At the same time it can be noticed that, increasing the drug loaded led to a complete change in the morphology of the product i.e. loss of the product spherecity.
REFERENCES:
1. Kissel T and Demirdere J., „Microspheres controlled release system for parenteral application" through Muller, B.: „Controlled drug delivery ", International symposium of the association for pharmaceutical technology (APV), Bad, Hamburg 12-14 November, 1984.
2. Mady 0., “Development of microspheres as means of controlling drug release" Ph.D. Thesis, Tanta University, 1994.
3. Celle M., Menei Ph. and Benoit J., “Preparation and characterization of 5 Flurouracil-loaded microparticles as biodegradable anticancer drug carriers", J. Phann. Pharmacol., 1995; 47: 108.
4. 0th, M. and Moes, A., “Proceedings of the 5th International Congress of Pharmaceutical Technology, 1989, vol.2, 104.
5. Baby D., Hoffmann A. and Benita S.,” Design and release kinetic pattern evaluation of indomethacin microspheres intended for oral administration” Biomaterials, 1988; 9: 482.
7. Avu-izza K., Garcia-contreras L. and Lu R., Preparation and evaluation of sustained release AZT-loaded microspheres", J. Pharm.Sci., 1996; 85: 2.
8. Barkai A., Pathak Y. and Benita S., „Polyacrylate (Eudragit retard) microspheres for oral controlled release of nifedipine, Formulation design and process optimization", Proceedings of the 8th Pharmaceutical Technology Conference, March 29-31, Monte-Carlo, 1989; 11: 1.
9. Youan BB, Jackson TL, Dickens L, Hernandez C, Owusu-Ababio G. Protein release profiles and morphology of biodegradable microcapsules containing an oily core. J Control Release. 2001; 76:313–26.
10. Phutane P., Shidhaye S, Lotlikar V., Ghule A., Sutar A., and Kadam V., In vitro Evaluation of Novel Sustained Release Microspheres of Glipizide Prepared by the Emulsion Solvent Diffusion-Evaporation Method, J Young Pharm. 2010 Jan-Mar; 2(1): 35–41.
11. British Pharmacopoeia. Vol. 1. British Pharmacopoeia Commission, London; 2003. pp. 874–5.
12. Gupta K., Pal R., Chakraborty M. and Debnath R. Design, evaluation and optimization of microcapsules of leflunomide with Eudragit RL100 and Eudragit RS100 by solvent evaporation technique. Asian J. Pharm. 2009; 3 (4): 309-313.
13. El-Helw M., Al-Hazimi M. and Youssef M. Preparation of Sustained Release Phenobarbitone Microspheres Using Natural and Synthetic Polymers. JKAU: Med. Sci. 2008; 15(2): 39-53.
14. Behera, B. C., Sao, S. K., Dhal, S., Baric, B. B. and Gupta, B. K. Characterization of Glipizide-Loaded Polymethacrylate Microspheres Prepared By an Emulsion Solvent Evaporation Method. Trop. J. Pharm. Res. 2008; 7 (1): 879-885.
15. Mao, S., Shi, y., Li, L. Xu, J., Schaper, A. and Kissel, T. Effect of process and formulation parameters on characteristics and internal morphology of poly (D, L-lactide-co-glycolide) microspheres formed by the solvent evaporation method. Eur. J. Pharm. Biopharm., 2008; 68: 214- 223.
16. Yerriswamy, B., Reddy, C. L. N., Prasad, C. V., Subha, M. C. S., Rao, K. C. and Venkatareddy, G. Controlled release studies of 5- fluorouracil through poly (vinyl caprolactum-co- vinyl acetate) microspheres. Asian J. Pharm., 2010; 4(3): 200-204.
17. Martin, A., Bustamante, P. and Chun, A. ”Physical Pharmacy", Fourth Edition, B.I. Waverly, New Delhi, 1996; 426-429.
18. Islam S., Jalil R., Preparation and characterization of polyvinyl acetate (Kollidion) microspheres containing diclofenac sodium: Effect of different cellulosic and acrylic polymers, International Journal of Pharma and Bio Sciences; 2010; (1)2.
19. Marwa H. Abdallah, Omaima A. Sammour, Hanaa A. El-ghamry, Hanan M. El-nahas and Waleed Barakat, Development and Characterization of Controlled Release Ketoprofen Microspheres. Journal of Applied Pharmaceutical Science, 2012; 02(03): 60-67.
20. Chaisri, C., Hennink, W. E. and Okonogi, S. Preparation and characterization of cephalexin loaded PLGA microspheres. Cur. Drug Deliv. 2009; 6: 69-75.
21. Parashar, V., Ahmad, D., Gupta, S. P., Upmanyu, N., Parashar, N. and Mudgal, V. Formulation and evaluation of biodegradable microspheres of tinidazole. Int. J. Drug Deliv., 2010; 2: 238-241.
22. Maestrelli F., Cirri M., Gorti G., Mennini N. and Mura P., Development of enteric-coated calcium pectinate microsphere intended for colonic drug delivery(2008), European J. of Pharmaceutics and Biopharmaceutics, 2008; 69: 508-518.
23. Khattab Ib., Bandarkar F. and Lila A., Drug disco. Ther. 2009, 3(3): 123-135.
24. Guyot M. and Fawaz F., int. J. of Pharmaceutics, 1998, 175, 61-74.
25. Yuksel N., Baykara M., shirinzade H., Investigation of triacetin effect on indomethacin release from poly(methylmethacrylate) microspheres: evaluation of interaction using IR and NMR spectroscopy, int. J. of Pharmaceutics 2011; 404: 102-109.
26. Mallick S., Gupta B. and Ghosal S., Formulation and evaluation of microencapsulation of verapamail hydrochloride coated with ethylcellulose, Eudragit RS and Eudragit RL, Acta Poloniae Pharmaceutika-drug research 1999; 56(4): 289-295.
27. Ghazy, F. H., Sammour, O. A., Abu-Selem, M. E. and Shehata, T. M. Formulation and evaluation of tramadol hydrochloride microspheres. Zag. J. Pharm. Sci., 2003, 12(1): 29-35.
All © 2013 are reserved by International Journal of Pharmaceutical Sciences and Research. This Journal licensed under a Creative Commons Attribution-NonCommercial-ShareAlike 3.0 Unported License.
This article can be downloaded to ANDROID OS based mobile. Scan QR Code using Code/Bar Scanner from your mobile. (Scanners are available on Google Playstore)
How to cite this article: