Full Length Research Article
E-WASTE MANAGEMENT AND HANDLING IN INDIA: MODELING OF ENABLERS (DRIVERS) USING
AN INTERPRETIVE STRUCTURAL MODELING (ISM)
1
Sirajuddin Ahmed,
2*Rashmi Makkar Panwar and
3Anubhav Sharma
1,2
Department of Civil Engineering, Jamia Millia Islamia, Delhi, India
3Department of Mechanical Engineering, GB Pant Polytechnic, Delhi, India
ARTICLE INFO ABSTRACT
The aim of this article is to analyze the interaction of various enablers (drivers) in management and handling of e-waste in India, which paves the way for an efficient e-waste management either by effective recycling/reuse or through safe and secure disposal for sustainable development. After review of literature on e-waste management in India and other countries, major driving factors of e-waste management have been identified. The literature review coupled with the experts’ opinion revealed during various field visits was instrumental in developing the relationship matrix, which is further used in the development of an Interpretive Structural Model (ISM).
Copyright © 2015 Sirajuddin Ahmed et al. This is an open access article distributed under the Creative Commons Attribution License, which permits unrestricted use, distribution, and reproduction in any medium, provided the original work is properly cited.
INTRODUCATION
The phenomenal growth in Information Technology as well as the exponential increase in use of electronic gadgets in our daily life over the past decade has resulted in generation of huge quantity of electronic waste (e-waste) (UNEP Conf, 2006). The trivial and intricate composition of e-waste has further complicated the issue of waste management. E-waste contains several types of metallic and non metallic hazardous chemicals (WEEE and hazardous waste, DEFRA, 2001, AEA Technology). The contemporary practices of e-waste management and deterrence in India suffer from a number of drawbacks like lack of reference data, public awareness, recycling infrastructure and financial liberty. The consequences are that toxic materials enter the waste stream with no exclusive and certain precautions to avoid the known adverse effects on the environment and human health. When electronic waste is dumped in landfills, not only all the energy and material used in making the product is lost, but it also poses high risk of environmental hazards (Pandve, 2007).
*Corresponding author: Rashmi Makkar Panwar
Department of Civil Engineering, Jamia Millia Islamia, Delhi, India
Their erroneous and unwarranted disposal is likely to cause severe environmental problems. Electronic junk consists of a significant amount of useful and handy components and materials which can be reused or recycled. Thus e-waste management has not only become a major challenge for India but also a lucrative mode of energy conservation. Interpretive Structural Modeling (ISM) proves beneficial and effective in identifying and summarizing relationships among specific variables (Warfield, 1974), which define a problem or an issue. It intends to arrange elements associated with a system in a hierarchical relation (Yih and Lin, 2007). Using ISM, a structural model is generated for the factors associated with the system on the basis of their relationships. ISM is an interactive learning process whereby a set of different and directly related factors are structured into a comprehensive systematic model. The model so formed portrays the structure of a complex issue or problem, a system or a field of study, in a carefully designed pattern involving graphics as well as words (Lal, and Haleem, 2009). The following are the steps involved in the ISM methodology.
Identification of enablers: The factors associated with the system, which are to be examined and modeled are identified.
ISSN: 2230-9926
International Journal of Development Research
Vol. 5, Issue, 01, pp. 2921-2926, January,2015
DEVELOPMENT RESEARCH
Article History:
Received 24th October, 2014
Received in revised form 17th November, 2014
Accepted 30th December, 2014 Published online 26th January, 2015
Key words:
Contextual relationship: A structural self-interaction matrix (SSIM) is prepared by comparing the enablers pair-wise.
A reachability matrix is developed from the SSIM and then transitivity is checked. The transitivity states that if an enabler A is analogous to B and B is analogous to C, then A is inevitably and imminently related to C.
The reachability matrix obtained in Step 3 is converted into the canonical matrix format by arranging the elements according to their levels.
From the canonical matrix form of the reachability matrix a supervised and conducted graph is drawn by means of vertices or nodes and lines of edges and the transitive links are removed based on the relationships given above in the reachability matrix. The resultant digraph is converted into an ISM, by replacing enabler nodes with statements.
The study of an industrial concept under the name ‘E-waste management and handling’ has been undertaken. Enablers i.e. the driving factors have been identified, and then an integrated model of these enablers has been developed by using interpretive structural modelling (ISM) methodology. Ranking of these enablers has been realized. The enablers have further been classified into four categories namely autonomous, linkage, dependent and independent according to their respective and subsequent driving power and dependence. This model shall be helpful in efficient and optimized implementation of the practices of E-waste management and handling in India.
Enablers
Efficient recycling and reuse
"Recycle" implies separating, dismantling and processing the materials, components or commodities contained in electronic waste for the purpose of preparing the materials for reuse in new products or components. Recycling includes the manual and mechanical separation of electronic waste to recover materials, components or commodities contained therein for the purpose of reuse and changing the physical or chemical composition of electronic waste to segregate components for purposes of recycling those components (The future of electronic waste recycling in the united states: Obstacles and Domestic Solutions, Jennifer Namias). By dismantling and providing reuse possibilities, intact natural resources are conserved and air and water pollution caused by hazardous disposal is avoided. Additionally, recycling reduces the amount of greenhouse gas emissions caused by the manufacturing of new products.
E-waste Regulation act
A research paper titled 'E-waste in India' presented in the Rajya Sabha in 2011, quotes the Comptroller and Auditor-General's (CAG) report as the situation and magnitude of e-waste generated and dumped into Indian territory is alarming. The “E-waste (Management and Handling) Rules”, 2010, came into effect on May 1, 2012 and clearly require manufacturers to take responsibility for the end-of-life recycling of their products, under the Extended Producer Responsibility (ERP) clause. The government gave states one year to set up a collection and disposal mechanism in place.
Those caught violating the rules are punishable under the Environment Protection Act with a maximum sentence of seven years and/or a fine of Rs 1 lakh. The law talks about authorizing collection agencies, and registered dismantlers and recyclers. It also has a provision called the Reduction of Harmful Substances (RoHS), which aims to tackle the problem at the time on manufacture (“E-Waste in India”, Rajya Sabha, 2011).
Monitoring of treatment chain
Monitoring involves dedicated inspection of the processes involved in fetching out the most useful material of what had been considered electronic waste. The sequence and series of the steps involved right from the collection to the recycling of the parts and components till we get something which could be reused elsewhere, i.e. in power generation etc are monitored and inspected so as to avoid any discrepancies and adversaries. (Gustavo Fernandez Protomastro, 2014) The aim is to keep an eye on the various stages an e-waste has to go through till it gets recycled for reuse or disposed off securely.
Technology Transfer
With the advent of globalization and advanced communication technologies, there have been several technology sharing endeavors among the countries which see e-waste as a threat to sustainable development. Swiss Knowledge Partnerships in e-Waste Recycling is a global program which focuses on (a) Capacity building by cooperating with five countries: China, India, South Africa, Colombia and Peru to facilitate the development of sustainable e-waste management systems. And (b) Knowledge Management by connecting national stakeholders internationally to stimulate knowledge and knowhow exchange on e-waste management (Dr. Mathias Schluep). India is classified as having a significant potential for the introduction of pre- and end-processing technologies (EMPA) with a strong support in capacity building in the informal sector (ELCINA-DSIR, 2009).
Processing infrastructure
The enactment of appropriate infrastructure is essential for the successful implementation of electronic waste recycling. Infrastructure determines the process methods and the magnitude of waste that can be processed. It includes transportation, collection, recovery and resale establishments. India needs a proper e-waste management infrastructure to turn the country's growing heaps of hazardous electronic waste into an opportunity. An impeccable recycling and reprocessing infrastructure is decisive and vital for a pragmatic conversion of the nuisance of E-waste into an economic opportunity considering the impending growth of E-waste (Rajiv Gauba). Both the government and the industry need to take a realistic and sensible approach for forceful implementation of the upcoming 'e-waste policy'. (Deptt of IT, GOI, 2003)
Profitability in recovery (WEEE pilot scheme report, Govt of UK, 2005)
in Information and Communication Equipments (Kahhat et al., 2009) as well as Entertainment and Consumer Electronics. Vis-à-vis prominent precious metals such as gold, silver, platinum and palladium, scarce and lesser popular materials like indium and gallium are also on an onset to play an important role (Cui, 2005) due to their application in new technologies (e.g flat screens, photovoltaics). E-waste consists of more than 92% retrievable and recyclable components (Management of WEEE, ACRR, 2003), of which some are exceedingly precious and limited. Approximately, 50 million tons of e-waste has 15 million tons of steel, 4 million tons of aluminium, 6 million tons of copper over and above glass, plastic, silver, gold, palladium, platinum, iridium etc (Jang et al., 2003). More than 80% of the weight of a CRT Desktop consists of silica (glass), plastics, iron and aluminium (Jang et al., 2003). Though precious and scarce materials account for only a small percentage of the total weight, nevertheless, the concentration of such metals, e.g. gold, is higher in a desktop computer than found in naturally occurring mineral ore.
Standardization
Standardization is the process of developing and implementing technical standards. Standardization can help to maximize compatibility, interoperability, safety, repeatability, or quality. Standardized e-waste management in developed countries, from efficient sourcing and collection right upto extraction and disposal of material has ensured that the huge pile of junk of electronic waste turns into a lucrative business opportunity. With very ambiguous laws related to environmental protection, India , China and a few African countries have become dumping sites to the developed countries (Widmer et al., 2004). There are many countries that have already kicked off the take back system for electronic products and they also have incorporated dedicated laws on e-waste management. India now seems on the same road as its other friendly emerging economies have been for some time.
Developing ISM for enablers
Developing the SSIM
Based on the available literary research and experts’ opinion the contextual relationship among the enablers has been developed as given in Table 1. Four symbols (V, A, X and O) are used to denote the direction of relationship between the factors (i and j):
V factor i will help to achieve factor j A factor j will help to achieve factor i
X factors i and j will help to achieve each other O factor i and j have no relationship.
Reachability matrix
The SSIM developed in previous step is then converted into a binary matrix, which is known as the initial reachability matrix by substituting1 and 0 in SSIM. The rules for the substitution of 1’s and 0’s are the following (refer Table 2):
if V is present in the (i, j) element in SSIM, then 1 will be put in (i, j) element and 0will be put (j, i) element in the reachability matrix
if A is present in the (i, j) element in SSIM, then 0 will be put in (i, j) element and 1will be put (j, i) element in the reachability matrix
if X is present in the (i, j) element in SSIM, then 1 will be put in (i, j) element and 1will be put (j, i) element in the reachability matrix.
if O is present in the (i, j) element in SSIM, then 0 will be put in (i, j) element and 0 will be put (j, i) element in the reachability matrix.
The final reachability matrix is developed from initial reachability matrix by including the transitivity. Table 3 shows the final reachability matrix.
Initial reachability matrix
Table 2.
S.No. 1 2 3 4 5 6 7
1 1 0 0 0 0 0 0
2 1 1 1 1 1 0 1
3 1 0 1 0 0 1 0
4 1 0 0 1 0 1 1
5 1 0 1 0 1 0 1
6 1 0 0 0 0 1 0
7 1 0 1 0 0 0 1
Final reachability matrix
Table 3.
S.No. 1 2 3 4 5 6 7
1 1 0 0 0 0 0 0
2 1 1 1 1 1 1* 1
3 1 0 1 0 0 1 0
4 1 0 1* 1 0 1 1
5 1 0 1 0 1 1* 1
6 1 0 0 0 0 1 0
7 1 0 1 0 0 1* 1
Level partitioning
Level partitioning is done to obtain the different levels of these 7 factors. From the final reachability matrix, the reachability set and antecedent set are obtained. In the reachability set the factor itself is present and the factors which it may help to achieve are present. Similarly, the antecedent set includes the factor itself and other factors which help in achieving it. The intersection set includes the common factors between reachability set and antecedent set. The factor present in the top-level will not help to achieve any other factor in the hierarchy. Similarly, the factor which has the least dependence will occupy the bottom level. Based on these levels the diagraph and the final model are built. Table 4 shows the level of enablers.
Table 1.
S.No. Enablers 7 6 5 4 3 2 1
Levels of enablers
Table 4.
Enabler Reachability set Antecedent set Intersection set Level
1 1 1,2,3,4,5,6,7 1 I
2 1,2,3,4,5,6,7 2 2 VI
3 1,3,6 2,3,4,5,7 3 III
4 1,3,4,6,7 4 4 V
5 1,3,5,6,7 2,5 5 V
6 1,6 2,3,4,5,6,7 6 II
7 1,3,6,7 2,4,5,7 7 IV
As is evident from the SSIM, factor 1 is being aided by every other factor and factor 2 is helping achieve others.Levels have been allotted based on the reachability set and intersection set. Factors with lesser Reachability sets will occupy lower levels. Eg. Factors 4 and 5 are allotted the same level (5) based on their reachability set. Similarly, factor 3 will assume 3rd and factor 6 will accommodate at 2nd level.
Developing conanical matrix and calculating driver power and dependence
A conanical matrix is obtained by putting together the factors and Driving and dependence powers are obtained based on the Reachability matrix. Table 5 shows the driving power and dependence of each factor. Driving power is calculated row wise by summing the total number of factors, including the factor itself, which it may help achieve. And dependence is calculated column wise by summing the total number of factors, including the factor itself, which may help in achieving it.
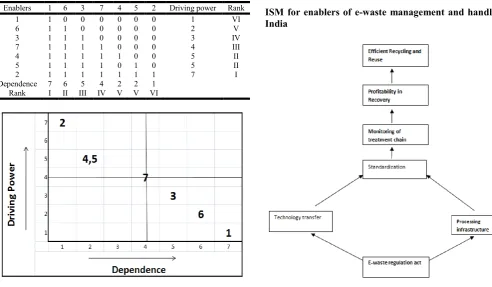
[image:4.595.35.297.475.754.2]Driving power and dependence in reachability matrix
Table 5.
Enablers 1 6 3 7 4 5 2 Driving power Rank
1 1 0 0 0 0 0 0 1 VI
6 1 1 0 0 0 0 0 2 V
3 1 1 1 0 0 0 0 3 IV
7 1 1 1 1 0 0 0 4 III
4 1 1 1 1 1 0 0 5 II
5 1 1 1 1 0 1 0 5 II
2 1 1 1 1 1 1 1 7 I
Dependence 7 6 5 4 2 2 1 Rank I II III IV V V VI
Figure 1.
CONCLUSIONS AND DISCUSSION
A descriptive picture is drawn for the emerging organizational paradigm under the name ‘E-waste management and handling’. Various enablers of ‘E-waste management and handling’ have been identified by an extensive literature survey and expert opinion. Structural model (Figure 1) has been developed for enablers using the ISM methodology. The enablers have been classified into four categories which are: autonomous, linkage, dependent and independent according to their driver power and dependence.
The enablers so obtained are further classified into four categories, according to their driving power and dependence.
Autonomous: These are the factors with weak driver and dependent powers. They are located nearest to the origin and relatively disconnected from the system. These neither influence the system much nor are they influenced by the system. In the present study of the system, there is no enabler in this category.
Dependent: They are mainly dependent factors. They are identified by their weak driving power. Enabler 1 (efficient recycling and reuse), enabler 3 (monitoring of treatment chain) and enabler 6 (profitability in recovery) are present in this category.
Linkage: The third category has the linkage variables that have strong driving power and dependence. Enabler 7 (standardization) falls under this category.
Independent: The fourth category includes independent variables with strong drivers and weak dependence. Enabler 2 (e-waste regulation act), enabler 4 (processing infrastructure) and enabler 5 (profitability in recovery) lie in this category.
ISM for enablers of e-waste management and handling in India
Figure 1.
[image:4.595.41.534.476.763.2]Recommendations: The way forward
The useful life of consumer electronic devices is relatively short, and decreasing as a result of rapid changes in equipment features and capabilities. This creates a large waste stream of obsolete electronic equipment, electronic waste (e-waste).Even though there are conventional disposal methods for e-waste, these methods have disadvantages from both the economic and environmental viewpoints. As a result, new e-waste management option needs to be considered, which is “recycling”. But electronic recycling has a short history, so there is not yet a solid infrastructure in place. One of the major goals to be achieved by recycling e-waste to conserve the ever depleting natural resources. Large e-waste centers exist in Delhi, Meerut, Gujarat, Ferozabad, Chennai, Bangalore and Mumbai, with 20,000+ recyclers working in Delhi alone. The Government need to ensure the working condition in these recycling companies and the same time health of the surrounding environment. For e-waste recycling to take off in India, the government has to reconsider its rules. The present rules are guidelines with no monitoring agency to oversee the implementation of the rules. Moreover, making policy is not the only function; government will have to ensure its timely implementation and set benchmarks for various recycling process. as well.
Having said that, the future of e-waste recycling is bright in India as there is a gap of proper solution providers that can handle the growing demand of electronic appliance consumption. With growing amount of consumers, this sector will keep on giving positive returns in the years to come. The country's E-Waste market is expected to grow at a CAGR of around 30.6% during 2014-19.The Southern and Western regions are the largest contributing regions (IRGSSA, 2005) in the country's E-Waste market due to the presence of various IT hubs such as Chennai, Bangalore and Hyderabad. However, the country's Western and Northern regions are also growing at a significant rate due to introduction of new recycling facilities, especially in Delhi/NCR region. Although the technology in India is still limited and the e-waste recyclers cannot recover metals from the printed circuit boards, but their operational costs are coming down significantly as the industry prepares itself for the proposed e-waste recycling policy. In India this trash could well be turned to treasure (Kahhat et al., 2009). With a growing middle class and increasing urbanization, India has a massive and rapidly growing market for electronics re-use. Many in this country don't have the resources to buy new electronics, but would be happy to have access to used ones. India, as a net importer of metals and plastics, also has sufficient metal and plastic industry demand to consume all raw materials extracted from non re-usable electronic, reducing our dependency of imports.
REFERENCES
Dahl, R. 2002. Who pays for e-junk? Environ Health Perspect; 110:A196–9. (PMC free article) (PubMed)
CPCB. Guidelines for environmentally sound management of e-waste (As approved vide MoEF letter No. 23-23/2007-HSMD) Delhi: Ministry of Environment and Forests, Central Pollution Control Board, March 2008. Available from: http://www.cpcb.nic.in (last accessed on 2008 Mar 12)
Baud, I., Grafakos, S., Hordjik, M. and Post, J. 2001. Quality of life and alliances in solid waste management. Cities; 18:3–12.
Pandve, HT. 2007. E-waste management in India: An emerging environmental and health issue. Indian J Occup Environ Med; 11:116. (PMC free article) (PubMed) Puckett, J., Byster, L., Westervelt, S., Gutierrez, R., Davis, S.,
Hussain, A. et al. 2002. Exporting Harm: The high-tech Trashing of Asia. Seattle: Basal Action Network; Available from: http://www.ban.org (last accessed)
World market for domestic electrical appliances. US: Euromonitor; Euromonitor. Available from: http://www. nautilus.org (last accessed on 2004 Feb)
Agarwal, R., Ranjan, R., Sarkar P. New Delhi: Toxics Link; 2003. Scrapping the hi-tech myth: Computer waste in India.
ELCINA-DSIR. E-waste menace needs urgent technological and market interventions. Global SMT and Packaging India. Available from: http://www.global-smtindia.in/ indexphp? option=com_contentandtask=viewandid=26548 anditemid=7 (last accessed on 2009 Feb)
Mehra HC. Tribune, 2004. PC waste leaves toxic taste. Widmer, R., Oswald, HK., Sinha, DK., Schnellmann, M. and
Heinz, B. 2004. Global perspectives on e-waste. Environ Impact Assess Rev.; 25:436–58.
Jang, YC. and Townsend, TG. 2003. Leaching of lead from computer printed wire boards and cathode ray tubes by municipal solid waste landfill leachates. Environ Sci Technol.; 37:4778–4. (PubMed)
Bathurst, PA., McMichael, AJ., Wigg, NR., Vimpani, GV., Robertson, EF., Roberts, RJ. et al. 1992. Environmental exposure to lead and children’s intelligence at the age of seven years: The Port Pirie Cohort Study. N Engl J Med.; 327:1279–84. (PubMed)
Brigden, K., Labunska, I., Santillo, D. and Allsopp, M. 2005. Recycling of electronic wastes in China and India: workplace and environmental contamination. Greenpeace. Available from: http://www.greenpeace.org/india/press/ reports/recycling-of-electronic-wastes (last accessed) Qiu, B., Peng, L., Xu, X., Lin, X., Hong, J. and Huo, X. 2004.
In: Proceedings of the International Conference on Electronic Waste and Extended Producer Responsibility, April 21-22. Beijing, China: Greenpeace and Chinese Society for Environmental Sciences. Medical investigation of e- waste demanufacturing industry in Guiyu town; pp. 79–83.
Huo, X., Peng, L., Xu, X., Zhang, L., Qiu, B., Qi, Z. et al. 2007. Elevated Blood Lead levels of children in Guiyu, An Electronic Waste Recycling Town in China. Environ Health Perspect.; 115:1113–7. (PMC free article)(PubMed) Janet, KY., Xing, CG., Xu, Y., Liang, Y., Chen, LX., Wu, SC.
et al. 2007. Body loadings and health risk assesments of
polychlorinated dobenzo-p-dioxines and dibezofurans at an intensive electronic waste recycling site in China.Environ Sci Technol.; 41:7668–74. (PubMed)
Wang, T., Fu, JJ., Wang, Y., Liao, C., Tao, Y. and Jiang, G. 2009. Use of scalp hair as indicator of human exposure to heavy metals in an electronic waste recycling area. Environ Pollut.; 157:2445–51. (PubMed)
electronic-waste recycling site in southeast China. Environ Sci Technol.; 41:2730–7. (PubMed)
Hicks, C., Dietmar, R. and Eugster, M. The recycling and disposal of electronic waste in China – legislative and market response. Environ Impact Assess Rev. 2005;25:459–71.
Siliconindia News Bureau. Only for Rs.5 e-waste workers risk lives (news) Siliconindia. Available from: http://www. siliconindia.com/shownews/Indias_ewaste_hazard _only_ for_Rs5_workers_risk_lives_-nid-63623-cid-1.html (last accessed on 2009 Dec 9)
Roman, LS. and Puckett, J. 2002. In: Proc. International Symposium on Electronics and the Environment, IEEE, May 6–9, 2002, San Francisco CA, USA. E-scrap exportation: Challenges and considerations; pp. 79–84. Williams, E. 2005. In: Proc. Third Workshop on Materials
Cycles and Waste Management in Asia. Tsukuba, Japan: National Institute of Environmental Sciences. International activities on E-waste and guidelines for future work. Yanez, L., Ortiz, D., Calderon, J., Batres, L., Carrizales, L.,
Mejia, J. et al. 2002. Overview of human health and chemical mixtures: Problems facing developing countries. Environ Health Perspect.; 110:901–9. (PMC free article) (PubMed)
Kishore, J. 2007. A Dictionary of Public Health. 2nd ed. New Delhi: Century Publications;. p. 680.
Kishore, J. 2010. National Health Programs of India: National Policies and Legislations related to health. 8th ed. New Delhi: Century Publications;. pp. 735–6.
Environmental management for Information Technology industry in India. New Delhi: Department of Information Technology, Government of India; 2003. DIT; pp. 122–4.
Raymond, J. 2007. Environment: Easy to be green. Newsweek, Jan 8. Available from: http//www. newsweek. com/id/56722 (last accessed on 2009 Dec 26)
Sharma P. Govt plans e-waste management programme (news) Delhi News line. Available from: http//www.cities. expressindia.com/fullstory.php? newsid=222390 (last accessed on 2007 Feb 15)
Warfield, J.W. 1974. "Developing interconected matrices in structural modelling." IEEE Transcript on Systems Men
and Cybernetics vol. 4, No.1: 51-81.
Warfield, J.W. 1974. "Developing interconnected matrices in structural modeling ." IEEE Transcr Syst.Men.Cybern.4(1)
(Placeholder1), 1974: 51-81.
Lal, R. and Haleem, A. 2009. "A structuramodelling for -governance service delivery in rural India." Int.J.Electronic
Governance,Vol.2.No.1,: 3-21.
Rajesh Attri, Nikhil Dev, Vivek Sharma, 2013. "Interpretive Structural Modelling (ISM)approach :An Overview."
Res.J.Management.Sci.,Vol.2(2): 3-8.
Urfi Khan and Abid Haleem, 2012."Modelling of enablers using an integrated ISM and fuzzy MICMAC approach."
Int.J.Intelligent Enterprise, Vol.1, No3/4: 249-269.
UNEP, 2006. Nairobi Conference on Basel convention, Nov27.
WEEE Pilot scheme report: Producer responsibility, Unit environment and heritage service, Govt of UK, 2005. Toxics link, E-waste Factsheet 31, WEEE: other side of the
digital revolution.
Kahhat, R. 2009. Williams, E: Product or waste? Environ. Sci. Technol., 43(15), 6010-6018.