`
Full Length Research Article
DETECTING DYNAMIC SPATIOTEMPORAL LAND USE CHANGE IN LINBIAN WATERSHED,
TAIWAN AFTER TYPHOON MORAKOT
*
Kwong Fai Andrew Lo and Darshani Waniganeththi
Graduate Institute of Earth Science, College of Science, Chinese Culture University,
Taipei 1114, Taiwan
ARTICLE INFO ABSTRACT
On 8th August 2009, the extreme rainfall of typhoon Morakot dumped record breaking rain in southern Taiwan. The typhoon significantly changed landscape patterns in Linbian Township, Pingtung County, in the southern part of Taiwan. Land use/land cover changes and the direct and indirect effects of these changes have drawn much public attention. This study aims at detecting typhoon Morakot induced land use changes and the dynamic landscape structure changes between 2006 and 2012. Three images from Formosat-2 satellite with resolution of 8 m were used for land use change detection. Geographic Information Systems (GIS), Remote Sensing (RS) techniques are used to quantitatively characterize the spatiotemporal changes of land use and landscape dynamic changes in the study area. Results obtained from the detection analysis show a decrease of vegetation cover by 30%. Other land use types such as river sediment and fallow land show an increased value. Three years after Morakot, vegetation and fallow land show an increasing value and an obvious recovery pattern. The intensity of landscape structure change is much higher between both 2006 - 2009 and 2009-2012 time periods. These are the transition periods when vigorous land use changes occur. However, the intensity value between year 2006 and year 2012 is small (0.007), very close to zero, indicating probable recovery back to normal conditions in 2012.
Copyright © 2016, Kwong Fai Andrew Lo and Darshani Waniganeththi. This is an open access article distributed under the Creative Commons Attribution License, which permits unrestricted use, distribution, and reproduction in any medium, provided the original work is properly cited.
INTRODUCTION
Land-use is one of the main factors through which man influences the environment. Land use change is the alteration in the structure and function of the ecological mosaic over time (Forman and Godron, 1986). Landscape fragmentation is a phase in the broader sequence of transforming land by natural or human causes from one type to another. It is important to examine fragmentation together with other spatial processes in the broader framework of land conversion. Landscape is dynamic in relation to the spatial, structural and functional patterns (Forman, 1995). The spatial setting of landscape elements is conditioned by the combination of both
biophysical and human forces (Fernandez et al., 1992;
Zonneveld, 1995). Most land use changes are induced by the
impacts of anthropogenic disturbances, such as urbanization and industrialization.
*Corresponding author: Kwong Fai Andrew Lo,
Graduate Institute of Earth Science, College of Science, Chinese Culture University, Taipei 1114, Taiwan.
However, the impacts of land use/cover changes can also be induced by large physical disturbances such as wildfire, earthquake, and heavy rainfall events. Few studies have examined the cumulative impacts of land use/cover changes induced by chronological disturbances such as typhoons and
earthquakes (Hong et al., 2009). Taiwan is located in a
subtropical region on top of the Philippine plate at the Euro-
Asian Plate junction (DeMets et al., 1990). Taiwan suffers
disastrous earthquakes because of plate convergence as well as disastrous typhoons. Typhoons bring enormous rainfall and strike Taiwan every year from July to October. These two types of large physical disturbances cause land use/cover changes affecting watersheds causing frequent landslides
occurrence (Chung and Fabbri, 2005; Guzzetti et al., 2005;
Lin et al., 2008a; 2008b) and vegetation damages in mountain
watersheds in Taiwan (Cheng et al., 2007; Chang and Feng,
2008). Extreme typhoon and earthquake events increase the incidence of landslides in the short term (Chang and Slaymaker, 2002). Typhoons are different from earthquakes in forcing changes in land use/cover. Typhoons can significantly influence land use/cover changes such as landslides via the flow of accumulated rainfall and wind gradients.
ISSN: 2230-9926
International Journal of Development Research
Vol. 06, Issue, 06, pp. 8067-8072, June,2016
DEVELOPMENT RESEARCH
Article History: Received 27th March, 2016
Received in revised form 17th April, 2016
Accepted 19th May, 2016
Published online 30th June, 2016
Key Words:
Land Cover Change, Typhoon Disasters,
Moreover, typhoons invariably lead to recurrent land
use/cover changes along an exposure aspect aligned with the
typhoon path and abrupt changes perpendicular to the
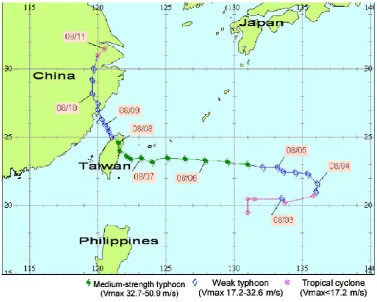
exposure aspect (Lin et al., 2008a; 2008b). Typhoon Morakot
struck Taiwan during August 6–10, 2009, had a slow moving path accompanied by a strong southwesterly monsoon with a radius of over 1,000 km (Fig. 1). It dumped nearly 2,000 mm
of rainfall, over 70% of the average annual rainfall (Wu et al.,
2011). Rainfall during Typhoon Morakot can be characterized as heavy, high-intensity and long duration. This rainfall caused numerous serious landslides and debris flows in upstream areas, as well as floods in downstream areas of the affected
watersheds. This study chooses the Linbian watershed as the
study site because it has been greatly affected by typhoon Morakot. The land use change caused by the large physical disturbance is analyzed quantitatively for spatiotemporal change of land use pattern over the period of 2006 to 2012. At the same time, an integrated approach of remote sensing and landscape structure dynamics is used to identify the land use change trends. The time series of landscape metrics help in describing and quantifying the spatial configuration of the disturbed area.
The Objectives of this study include:
To map and determine the nature, extent and rate of
spatiotemporal land use/cover changes using multiple Formosat-2 imageries
To detect the spatiotemporal land use/cover change
patterns before and after the typhoon Morakot
To analyze the spatiotemporal land use/cover change
patterns and the dynamic landscape structure change within the study time period
MATERIALS AND METHODS
The study area
The Linbian watershed is located in Pingtung County, the tropical region of southern Taiwan. Pingtung County is a strip-shaped region and one is of the major groundwater resources in Taiwan. The area of Pingtung County is approximately
2,775 km2 and extends 112 km from north to south and 27 km
from east to west (Fig. 2). The area is enclosed by the Kao-Ping Stream to the west, the central mountains to the north and east, and the Taiwan Strait to the south. The Kao-Ping, Tung-Kung, and Linbian are the three major streams that flow through the area. Agriculture and aquaculture are the primary sources of revenue in Pingtung areas. To boost earnings, many farmers have transformed their croplands into aquaculture farms. Over the past 30 years, a large quantity of groundwater has been overly extracted from the shallow layer aquifer to mix with seawater to supply aquaculture farms water use
(Huang et al., 2010). Linbian Stream is one of the major
streams in Pingtung County. The area of the Linbian Stream
watershed is about 336.3 km2and the length of the main stream
is about 41.3 km.
The average channel bed slope is 1/88. Average annual rainfall is about 2,115 mm. Apart from the flood season, usually the
water velocity is slow . The study watershed area is about 132
km2.
L and cover images and classification
[image:2.595.116.494.323.625.2]The primary information utilized in this study for land use change assessment is the Formosat-2 satellite images which are obtained from the Center for Space and Remote Sensing
Fig. 2. Location map of the study area
[image:3.595.155.450.420.736.2]Research, National Central University. The images are firstly interpreted using ArcGIS. Three Formosat-2 images acquired before and after Typhoon Morakot are used to detect the land use changes in the study site. The acquired dates of the remote sensing images are July 2006, August 2009 and October 2012. Resolutions of the images are about 8 m.
Unsupervised classification
The computer produces spectral classes based on the digital numbers without any direction from the user in unsupervised classification. It gives preliminary information on the potential spectral clusters to be assigned to thematic classes. Therefore, subsets of the satellite data are first classified using unsupervised classification. This classification has been used as a guide in the selection of training sites for input into the supervised classification.
Supervised classification
Supervised classification is based on the unsupervised classification method. The training sample sites have been used to define the decision space of the five different types of land cover. Old topographic maps are used to determine the necessary samples for each image. Finally, five types are extracted, namely river sediment with water body, vegetation, settlements, aquaculture and fallow land. The result of a supervised classification usually has some percentage of misclassification, due to noise and unknown pixels. Analysis and interpretation of satellite data is done by digital image processing using ERDAS IMAGING 2012 and ArcGIS 10.1 softwares.
Land use /cover change detection
Three land use maps have been prepared using the available satellite images for above mentioned years. Five different types of land use have been segregated in these maps. Land use/cover change results are obtained using the following formula:
(1)
(2)
(3)
Landscape structure dynamic of the study area is computed with the time period using the following equation:
LC = ∑ 1/T 100% (4)
Where
A = total area
△LUi-j = absolute value of the area of i type transfer to non-i
type T = time
LC = landscape structure changes in a region within a certain time
RESULTS AND DISCUSSION
Land cover maps are generated for the three years (Fig. 3) and
area estimates and change statistics are computed. Fig. 3
depicts the results of land cover. Table 1 lists the area of land use, percentage value and relative change before and after
typhoon from 2006 to 2012 time period. The first land use
map is about three years before the typhoon. The second map is about three days after the typhoon. The third map is three years after the typhoon.
Temporal land use/cover change between 2006 to 2009
Several types of changes can be observed when comparing the first and the second map (Fig. 3). River sediment has increased 1.35% than before the typhoon. Linbian Stream originates in the mountainous regions of Pingtung County. Typhoon Morakot dumped nearly 2,000 mm of rainfall, over 70% of the average annual rainfall on southwestern Taiwan especially around the Central Mountain Range in Pingtung, Chia-Yi, and Kaohsiung County. The driving forces for the soil detachment and sediment transport are related with rainfall intensity and rainfall amount. The susceptibility for detachment and transport is related to soil properties and management. During the typhoon, runoff washes away loose top soil and transports them through the stream channels. It contains lots of sand, debris and gravel and widens the stream channel. Sediment moves from upstream to downstream areas of the watershed through this process which is continuous and concentrated. Taiwan’s streams are generally short with lots of turbulent flow. As the flow volume increases during heavy storms, streams often surmount their banks and inundate large areas. This feature often transports the debris upstream to downstream areas resulting in siltation and serious flood.
Land use analysis
This reduction may have been caused by some of the aquaculture ponds being destroyed and filled up with sediments after the typhoon event. In the study area, settlement distribution is comparatively low when compared with other land use types. Most of the built up areas are located close to the plain areas of Pingtung County. Settlements have decreased 0.75% in the 2009 map (Fig. 3). This result indicates there is a minor disturbance to settlements by typhoon attack. However, one village was completely destroyed and buried with more than 400 casualties due to massive debris flow resulting from heavy rain during the typhoon passage.
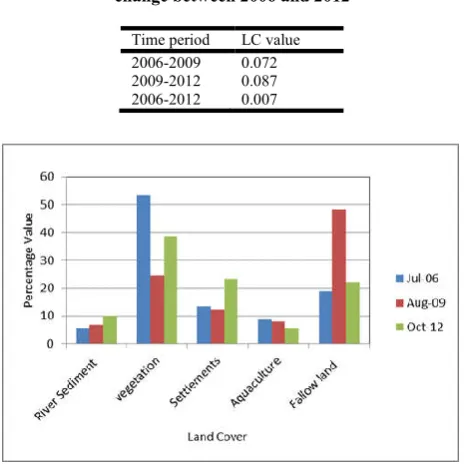
Table 2. Dynamic landscape structure change between 2006 and 2012
Time period LC value 2006-2009 0.072 2009-2012 0.087 2006-2012 0.007
Fig. 4. Percentage distribution of land use/cover between 2006 and 2012
Temporal patterns of land use/land cover changes from 2009 to 2012
Three years after the typhoon attack, river sediment percentage gradually increases up to 10.17%. After the typhoon there have been several small storm events which increase sediment transportation throughout the stream channel. Vegetation recovery has been in progress in Linbian watershed. The vegetation cover increased up to 38% three years after the typhoon. Results indicate that longer time period is needed to replenish the soil condition after a major physical disturbance. Settlement has also increased 11.25% three years after the typhoon Morakot.
The last image taken on October 2012 is interrupted by a few clouds. This may lead to some inaccurate estimates of settlement areas. Fallow lands which have been converted to barren land decreased by almost 26% three years after the typhoon. In fact, the bare land area value in 2012 is similar to the 2006 value. Aquaculture industry still showed a decreasing pattern after 2009. It seems that more time is needed to reestablish this long term industry.
Land cover change based on landscape structure dynamic
Analysis of landscape patterns and dynamics has become one of the primary objectives of landscape, geographical and ecological studies in recent years. The spatial patterns of landscape transformation through time are undoubtedly related to changes in land uses. Land cover dynamics changes between 2006 and 2012 have been examined in this study area based on landscape structure dynamics values (LC) (Table 2). From 2006 to 2009, the LC value is 0.072; from 2009 to 2012 is about 0.087. These values indicate that the landscape structure changes more rapidly from 2009 to 2012 period than from 2006 to 2009. But between 2006 and 2012, LC value is very small (0.007) indicating very little land cover change between 2006 and 2012. 2009 is the period when the typhoon Morakot hit the Linbian watershed. Due to this significant physical disturbance, the spatial structure of the landscape has been greatly altered. Between 2009 and 2012, this is the period when the transition and recovering back to the normal stage occurred. The small LC value between 2006 and 2012 is a good indicator that the Linbian watershed has achieved full landscape structure recovery and may be even better than three years after typhoon Morakot. These results also point to the fact that land use/cover undergo continuous changes and the spatial structure of land use classes transform and undergo rapid changes.
Conclusion
This study has shown that information from satellite remote sensing integrated with GIS can play a useful role in understanding the nature and extent of changes in land use/cover. The change detection analysis along with land use structure dynamics is discussed in this paper. The results of land use analysis reveal that the land use/cover types exhibit a considerable change after 2009. The dynamics of land use/cover change pattern have been identified by analyzing the satellite images of 2006, 2009 and 2012 in a GIS platform. The quantitative evidences of land use change analysis confirm that after typhoon Morakot the vegetation cover loss is close to 30% and conversion of fallow lands to barren lands is also almost 30%.
Table 1. Area (km) and percentage of land use types along with percent temporal relative changes
Land use/cover types Classified maps Relative change (%)
2006 2009 2012 2009-2006 2012-2009 2012-2006
Area % Area % Area %
[image:5.595.46.279.348.585.2]Three years after, vegetation cover recovery reaches 15%. The fallow lands which have been converted to barren land reduce by more than 26%. After this large scale physical disturbance, aquaculture does not show an improved condition. The settlement percentage decreases in a small amount right after the typhoon. Three years later it increases more than 10% as compared to 2006. The accumulation of river sediment remains relatively high after 2009 indicating that there has been many subsequent small storm events. Landscape structure changes in the study area shows higher value and rapid change between 2009 and 2012 as compared to the other two periods (2006 to 2009 and 2006 to 2012). The small LC value between 2006 and 2012 is a good indicator that the watershed has achieved high degree of recovery in about three years.
REFERENCES
Chang, J.C. and Slaymaker, O. 2002. Frequency and spatial distribution of landslides in a mountainous drainage basin:
Western Foothills, Taiwan. Catena, 46: 285–307.
Chang, J.Y. and Feng, F.L. 2008. A case study on landscape
change of Shinhua Forest Experimental Station. Taiwan
Journal of Forest Science, 30(2): 69–81.
Cheng Y., Cheng, H.W. Tan, Y.C. and Yeh, H.F. 2009. An Optimal Water Allocation for an Irrigation District in
Pingtung County, Taiwan. Irrig. and Drain. 58: 287–306.
Cheng, C.C., Wu, C.D. and Chuang,Y.C. 2007. Influence of land-use changes and climate change on stream flow simulations: A case study of the Jiao-long watershed.
Taiwan Journal of Forest Science, 22(4): 483–495.
Chung, C.F. and Fabbri, A. G. 2005. Systematic procedures of landslide hazard mapping for risk assessment using spatial prediction models. In T. Glade, M. Anderson, & M. J.
Crozier (Eds.), Landslide hazard and risk, New York:
Wiley: 139-177.
DeMets, C., Gordon, R.G., Argus, D.F. and Stein, S. 1990.
Current plate motions. Geophysical JournalInternational,
104, 425–478. doi:10.1111/j.1365-246X. 1990. tb 06579. Fernandez, R., Martin, A., Ortega, F., and Ales, E. 1992.
Recent changes in landscape structure and function in Mediterranean region of SW Spain (1950-1984).
Landscape Ecol. 7: 3-18.
Forman, R.T.T. 1995. Land Mosaics: The ecology of landscapes and regions. Cambridge University Press, Cambridge.
Forman, R.T.T. and Godron, M. 1986. Landscape Ecology. John Wiley & Sons, New York.
Guzzetti, F., Stark, C.P. and Salvati, P. 2005. Evaluation of flood and landslide risk to the population of Italy.
Environmental Management, 36, 15–36. doi:10.1007/s00267-003-0257-1.
Hong, N.M., Chu, H.J., Lin, Y.P. and Deng, D.P. 2009. Effects of land cover changes induced by large physical disturbances on hydrological responses in Central
Taiwan.Environ Monitor Assess
doi:10.1007/s10661-009-1019-1.
Huang, Y.C., Yang, C.P., Lee, Y.C., Tang, P.K. and Hsu, W.M. 2010. Variation of Groundwater Quality in Seawater Intrusion Area Using Cluster and Multivariate
Factor Analysis. The 6th International Conference on
Natural Computation (ICNC'10).
Lin, G.W., Chen, H., Chen, Y.H., and Horng, M.J. 2008a. Influence of typhoons and earthquakes on rainfall-induced
landslides and suspended sediments discharge.
Engineering Geology, 97: 32–41. doi:10.1016/ j.enggeo.2007.12.001.
Lin, Y.B., Lin, Y.P. and Deng, D.P. 2008b. Integrating remote sensing data with directional two-dimension wavelet analysis and open geospatial techniques for effective
disaster monitoring and management. Sensor, 8: 1070–
1089. doi:10.3390/s8021070.
Tsai, F., Hwang, J.H., Chen, L.C. and Lin, T.H. 2010. Post-disaster assessment of landslides in southern Taiwan after 2009 Typhoon Morakot using remote sensing and spatial
analysis. Nat. Hazards Earth Syst. Sci., 10: 2179–2190,
2010, doi:10.5194/nhess-10-2179-2010.
Wu, C.H., Chen, S.C. and Chou, S.T. 2011. Geomorphologic characteristics of catastrophic landslides during typhoon
Morakot in the Kaoping Watershed, Taiwan. Engineering
Geology, 123 (2011):13–21.
Zonneveld, I.S. 1995. Land Ecology. SPM Academic Publishing, Amsterdam, The Netherland.