© 2018, IRJET | Impact Factor value: 7.211 | ISO 9001:2008 Certified Journal | Page 2597
Determination of Water quality of Vengaihnakere Lake and Varthur
lake, Bangalore.
Naveen S
1, Aishwarya J
2, Mrs. Rashmishree K N
31Naveen Kumar S, U.G Civil engg Student, Cambridge Institute of technology,Karnataka, India. 2Aishwarya J, U.G Civil engg Student, Cambridge Institute of technology,Karnataka, India.
3Asst. ProfessorMrs. Rashmishree K N, Dept. of Civil Engineering, Cambridge Institute of technology, Karnataka,
---***---Abstract -
Water is a natural resource which is decisive for the survival of living organisms. One such source is surface water, in other words lakes and rivers. This work is focused on the quality of water of lakes in Bangalore. The lake under study is Vengaihnakere Lake or better known as K.R Lake and Varthur lake. The method adopted for determining the water quality is weighted arithmetic index method.Key Words: K.R kere, Varthur kere, WQI, Physicochemical parameters, Vengaihnakere.
1. INTRODUCTION
We are well aware that most of the globe is covered with water, which is roughly 71% of the earth’s surface, among which 97% of the water is spread out in the oceans. So the water which can be used for the needs of life on earth results to only 3 percent of which two third is frozen in glaciers and polar ice caps which further leaves us with only 1% of usable fresh water. Which is why this work focuses on the importance of wetlands. Bangalore was known as a city of a thousand lakes, due to rapid urbanization and the needs of humans these lakes have been constantly declining. According to the BWSSB’s records Bangalore generates 1400 Million litres of sewage per day but the treatment capacity in Bangalore is only of about 721 MLD of which 520 MLD get treated on average, therefore majority of the remaining sewage and the industrial waste get dumped into the lakes which leads to the lake water pollution and degradation of water bodies. There is a need to study the quality of water in order to specify the level of treatment required and also know the status of the respective lakes. The method adopted in this study is the Weighted arithmetic index method. By determining the water quality index thereby classifying the water into classes of Excellent to poor.
1.1 Study Area.
Bengaluru urban, the district headquarter is located approximately at mid-south-eastern part of Karnataka with the latitude of Bangalore, Karnataka, India is 12.97, and the longitude is 77.58. Bangalore, Karnataka, GPS coordinates of 12° 58' 20.79'' N and 77° 34' 50.315'' E. Bangalore, Karnataka India elevation is 924 meters height.
The waterbodies taken for study is K.r Lake and Varthur lake. The location of the K.R Lake is at 13°01'00.7"N 77°41'52.0"E (DMS) with an area of 40 acres, whereas the location of Varthur Lake is at 12°56'55.2"N 77°44'20.5"E (DMS), with an area of 445.8 acres.
2. METHODOLOGY
The methodology adopted in this case study is the Weighted arithmetic index method. A total of 15 parameters are considered in this work they are namely pH, Turbidity, Electrical conductivity Total hardness, Chlorides, Sulphate Total alkalinity, DO, BOD, Magnesium, Calcium, Iron, TSS, Nitrates, TDS.
Water Quality Index (WQI): It indicates a single number which represents the overall quality of water by evaluating the individual parameters.
For calculating the WQI, Relative weight(Wn) is determined by assigning each parameter a unit weight based on the significance on the quality of water and computed with the formula below.
∑ ⁄
Where,
Wn = Relative weight n = Number of parameters wi = Weightage of each parameter
Once Wn is computed next A quality rating (Qn) is computed. Ci is the concentration of each physicochemical parameter in each water sample in mg/L, and Si is the Indian drinking water standard for each chemical parameter in mg/L according to the guidelines of the Bureau of India Standards 10500, 2012. The equation is as follows,
⁄
Where,
Qn = Quality rating.
Ci = Concentration of each parameter. Si = Indian drinking water standards.
Finally after determining Qn, Subindex is determined for the nth parameter(SIn).
© 2018, IRJET | Impact Factor value: 7.211 | ISO 9001:2008 Certified Journal | Page 2598
∑
3. RESULT AND DISCUSSION.
The below mentioned physicochemical parameter study is most essential to determine to get literal idea of water quality index or quality of water. Quality of water is determined based on characteristics such as physical (temperature, color, taste, odor) chemical, biological characteristics and compare with standard value for drinking water which is recommended by WHO(world health organization) and BIS(bureau of Indian standards). The quality of water is also determined based on Chemical parameters. 15 Chemical parameters are pH, turbidity, total dissolved solids, total suspended solids, nitrates, sulphates, iron, total hardness, Calcium carbonate, magnesium, Dissolved Oxygen, Biochemical Oxygen Demand, total alkinity, electrical conductivity, chlorides. These test conducted on two water bodies are K.R lake and Vartur lake. The water collected for two different season such as winter and summer season. By using the grab sampling method. The water quality index calculation is done for two seasons as shown in table 1 and 2. The obtained value of each lake is compared.
Table 1: Data of K.R puram lake water quality.
SI no Chemical parameters Unit Season
Pre-monsoon Post-monsoon
1 pH - 6.79 8.04
2 Electrical conductivity Mmhos 1.9 1.4
3 Total dissolved solids mg/L 333 411
4 Total alkalinity mg/L 125 87.5
5 Total hardness mg/L 320 261.1
6 Total suspended solids mg/L 317 541
7 Calcium carbonate mg/L 220 211.1
8 Magnesium mg/L 100 50
9 Chloride mg/L 219.99 185
10 Nitrates mg/L 21 25.5
11 Sulphates mg/L 20.5 32.5
12 Dissolved oxygen mg/L 1.7 2.58
13 Bod mg/L 4 4.5
14 Iron mg/L 0.2 0.1
[image:2.595.305.567.104.343.2]15 Turbidity NTU 31.9 9.7
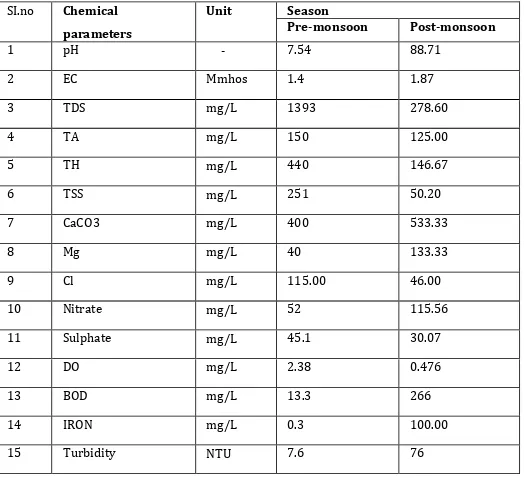
Table 2: Data of Vartur lake water quality.
SI.no Chemical
parameters
Unit Season
Pre-monsoon Post-monsoon
1 pH - 7.54 88.71
2 EC Mmhos 1.4 1.87
3 TDS mg/L 1393 278.60
4 TA mg/L 150 125.00
5 TH mg/L 440 146.67
6 TSS mg/L 251 50.20
7 CaCO3 mg/L 400 533.33
8 Mg mg/L 40 133.33
9 Cl mg/L 115.00 46.00
10 Nitrate mg/L 52 115.56
11 Sulphate mg/L 45.1 30.07
12 DO mg/L 2.38 0.476
13 BOD mg/L 13.3 266
14 IRON mg/L 0.3 100.00
15 Turbidity NTU 7.6 76
For calculating water quality index weighted arithmetic index. There are 3 steps. First step is calculating relative weight using following formula
[image:2.595.32.559.410.727.2]∑ ⁄
Table 3: Calculation of relative weight (Wi).
SI
no Chemical parameters Unit Indian standard
s
Weigh t (w1)
Relative weight (Wi)
1 pH - 6.5-8.5 4 0.091
2 Electrical conductivity Mmhos 75 1 0.023
3 Total dissolved solids mg/L 500-200 4 0.091
4 Total alkalinity mg/L 120 2 0.046
5 Total hardness mg/L 300-600 2 0.046
6 Total suspended solids mg/L 500 1 0.023
7 Calcium carbonate mg/L 75 2 0.046
8 Magnesium mg/L 30-100 2 0.046
9 Chloride mg/L 250-100 3 0.068
10 Nitrates mg/L 45 5 0.161
11 Sulphates mg/L 150 4 0.091
12 Dissolved oxygen mg/L 5 3 0.068
13 Bod mg/L 5 4 0.091
14 Iron mg/L 0.3-1 4 0.091
15 Turbidity mg/L 10 3 0.068
Total = Ʃw1 =44
© 2018, IRJET | Impact Factor value: 7.211 | ISO 9001:2008 Certified Journal | Page 2599
⁄
Where,
Qn = Quality rating.
Ci = Concentration of each parameter. Si = Indian drinking water standards.
Finally after determining Qn, Subindex is determined for the nth parameter(SIn).
With the computation all the required values the WQI is determined from the equation below,
∑
Table 4: Water quality calculation for K.R Puram Lake for summer season
SI no Chemical parameters Si Wi Ci Qi SIi
1 Ph 6.5-8.5 0.091 7 79.88 7.27
2 Electrical conductivity 75 0.023 1.9 2.53 0.06
3 Total dissolved solids 500-200 0.091 333 66.60 6.06
4 Total alkalinity 120 0.046 125 104.17 4.79
5 Total hardness 300-600 0.046 320 106.67 4.91
6 Total suspended solids 500 0.023 317 63.40 1.46
7 Calcium carbonate 75 0.046 220 293.33 13.49
8 Magnesium 30-100 0.046 100 333.33 15.33
9 Chloride 250-100 0.068 219.99 88.00 5.98
10 Nitrates 45 0.161 21 46.67 7.51
11 Sulphates 150 0.091 20.5 13.67 1.24
12 DO 5 0.068 1.7 34 2.312
13 BOD 5 0.091 4 80.00 7.28
14 Iron 0.3-1 0.091 0.2 66.67 6.07
15 Turbidity 10 0.068 31.9 319 6.596
Water quality index = ƩSIi = 90.37
Table 5: Water quality calculation for K.R Puram Lake for Winter season
SI no Chemical parameters Si Wi Ci Qi SIi
1 Ph 6.5-8.5 0.091 8.04 94.59 8.61
2 Electrical conductivity 75 0.023 1.4 1.87 0.04
3 Total dissolved solids 500-200 0.091 411 82.20 7.48
4 Total alkalinity 120 0.046 87.5 72.92 3.35
5 Total hardness 300-600 0.046 261.1 87.03 4.00
6 Total suspended solids 500 0.023 541 108.20 2.49
7 Calcium carbonate 75 0.046 211.1 281.47 12.95
8 Magnesium 30-100 0.046 50 166.67 7.67
9 Chloride 250-100 0.068 185 74.00 5.03
10 Nitrates 45 0.161 25.5 56.67 9.12
11 Sulphates 150 0.091 32.5 21.67 1.97
12 DO 5 0.068 2.58 51.6 3.51
13 BOD 5 0.091 4.5 90 8.19
14 Iron 0.3-1 0.091 0.1 33.33 3.03
15 Turbidity 10 0.068 9.7 97 6.60
Water quality index = ƩSIi = 84.05
Table 6: Water quality calculation for Varthur Lake for Summer season.
SI no Chemical parameters Si Wi Ci Qi SIi
1 Ph 6.5-8.5 0.091 7.54 88.71 8.07
2 Electrical conductivity 75 0.023 1.4 1.87 0.04
3 Total dissolved solids 500-200 0.091 1393 278.60 25.35
4 Total alkalinity 120 0.046 150 125.00 5.75
5 Total hardness 300-600 0.046 440 146.67 6.75
`6 Total suspended solids 500 0.023 251 50.20 1.15
7 Calcium carbonate 75 0.046 400 533.33 24.53
8 Magnesium 30-100 0.046 40 133.33 6.13
9 Chloride 250-100 0.068 115.00 46.00 3.13
10 Nitrates 45 0.161 52 115.56 18.60
11 Sulphates 150 0.091 45.1 30.07 2.74
12 DO 5 0.068 2.38 0.476 0.03
13 BOD 5 0.091 13.3 266 24.21
14 Iron 0.3-1 0.091 0.3 100.00 9.10
15 Turbidity 10 0.068 7.6 76 5.17
© 2018, IRJET | Impact Factor value: 7.211 | ISO 9001:2008 Certified Journal | Page 2600
Table 7: Water quality calculation for Varthur Lake for Winter season
SI no
Chemical parameters Si Wi Ci Qi SIi
1 Ph 6.5-8.5 0.091 6.99 82.235
29
7.4834 12
2 Electrical conductivity 75 0.023 1 1.3333
33
0.0306 67
3 Total dissolved solids 500-200 0.091 987.12 197.42
4
17.965 58
4 Total alkalinity 120 0.046 111.11 92.591
67
4.2592 17
5 Total hardness 300-600 0.046 440 146.66
67
6.7466 67
6 Total suspended solids 500 0.023 340 68 1.564
7 Calcium carbonate 75 0.046 350 466.66
67
21.466 67
8 Magnesium 30-100 0.046 40 133.33
33
6.1333 33
9 Chloride 250-100 0.068 100.3 40.12 2.7281
6
10 Nitrates 45 0.161 48 106.66
67
17.173 33
11 Sulphates 150 0.091 35.5 23.666
67
2.1536 67
12 DO 5 0.068 3.5 70 4.76
13 BOD 5 0.091 15.01 300.2 27.318
2
14 Iron 0.3-1 0.091 0.35 116.66
67
10.616 67
15 Turbidity 10 0.068 7.2 72 4.896
Water quality index = ƩSIi = 135.3
4. Graph of results from K.R lake and Vartur lake
Chart 1: Graph plotted with the chemical parameter values of K.R. Lake.
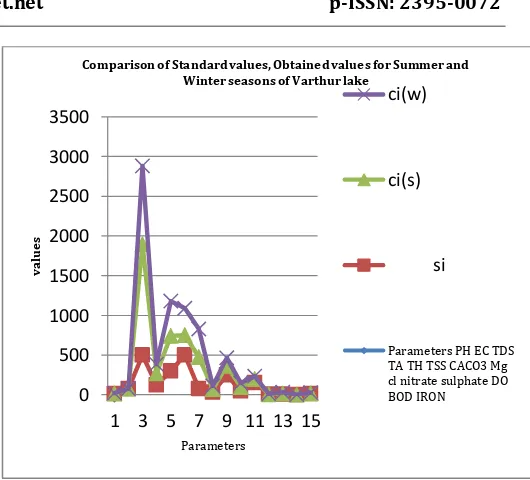
Chart 2: Graph plotted with the chemical parameter values of varthur lake.
Where,
Ci(S) = Concentration of each chemical parameters in summer season.
Ci(W) = Concentration of each chemical parameters in winter season.
Si = Indian standard drinking water for each chemical parameter in mg/L according to guidelines of the BIS 10500.
TABLE 8: Final water quality rating and the applications.
Obtained water quality index of two different lakes of different seasons (summer and winter) are shown in following table and also it is representing the characteristics and applications of lake water.
0
200 400 600 800 1000 1200 1400 1600
1 3 5 7 9 11 13 15
va
lu
es
parameters
Comparison of Standard values, Obtained values for Summer and Winter seasons of K.R Lake
ci(w)
ci(s)
si
Parameters PH EC TDS TA TH TSS CACO3 Mg cl nitrate sulphate DO BOD IRON
0 500 1000 1500 2000 2500 3000 3500
1 3 5 7 9 11 13 15
va
lu
es
Parameters
Comparison of Standard values, Obtained values for Summer and Winter seasons of Varthur lake
ci(w)
ci(s)
si
Parameters PH EC TDS TA TH TSS CACO3 Mg cl nitrate sulphate DO BOD IRON
Lake Season WQI Value Quality rating Applications
Vengaihnakere lake
Summer 90.37 Good water Domestic, Irrigation
and industrial uses.
Winter 84.05 Good water Domestic, Irrigation
and industrial uses. Varthur
lake
Summer 140.76 Poor water Irrigation
[image:4.595.30.292.120.436.2]© 2018, IRJET | Impact Factor value: 7.211 | ISO 9001:2008 Certified Journal | Page 2601
3. CONCLUSIONS
Water quality index is helpful in assessment and management of water quality.
The present investigation represents the water quality of KR lake and varthur lake, bangalore.
The case study provides valuable insight into the status of overall suitability of the lake water based on WQI values. It highlights the salient features of various important
physico-chemical parameters acting upon the general water quality of the river.
Obtained water quality index of K.R puram lake (Summer) is 90.37 which is good water which can be used for domestic uses, irrigation and industrial purposes.
Obtained water quality index of K.R puram lake (Winter) is 84.05 which is good water which can be used for domestic uses, irrigation and industrial purposes.
Obtained water quality index of Varthur lake (Summer) is 140.76 which is poor water which can be used for irrigation and industrial purposes after secondary level treatment with trickling filter or activated sludge process and secondary sedimentation tank.
Obtained water quality index of Varthur lake (Winter) is 135.30 which is poor water which can be used for irrigation and industrial purposes after secondary level treatment with trickling filter or activated sludge process and secondary sedimentation tank.
REFERENCES
[1] K. Yogendra and E.T. Puttaiah, “Determination of Water Quality Index and Suitability of an Urban Waterbody in Shimoga Town, Karnataka”, Taal2007: The 12th World Lake Conference ,Vol 342-346, July 2008.
[2] C. R. Ramakrishnaiah , C. Sadashivaiah and G. Ranngana “Assessment of Water Quality Index for the Groundwater” in Tumkur Taluk, Karnataka State, Journal of chemistry (ECJHAO) India, Vol 523-530, Dec 2009.
[3] M. Vasanthavigar, K. Srinivasamoorthy, K. Vijayaragavan, R. Rajiv Ganthi,S. Chidambaram, P. Anandhan, R. Manivannan, S. Vasudevan, “Application of water quality index for groundwater quality assessment: Thirumanimuttar sub-basin, Tamilnadu, India” Environmental Monitoring and Assessment, vol 595-609, April 2010.
[4] 4. Kosha A. Shah and Geeta S. Joshi, “Evaluation of water quality index for River Sabarmati”, Gujarat, India, Applied Water Science, Vol 1349–1358 ,26 july 2015.
[5] Minakshi Bora and Dulal C. Goswami, “Water quality assessment in terms of WQI:case study of the Kolong River”, Assam, India, Applied Water Sciences, Vol 7 3125–3135, 18 July 2016.
[6] Sridhar K, Lakshman A, “Assessment of water quality index for the groundwater in vaddeswaram, Andhra Pradesh”, International Journal of Civil Engineering and Technology (IJCIET), Vol 8, April 2017.
BIOGRAPHIES
Naveen S.
U.G Civil Engineering student, Cambridge Institute of technology Bangalore.
Aishwarya J.
U.G Civil Engineering student, Cambridge Institute of technology Bangalore.
Mrs. Rashmishree K N. Asst. Professor,