Modeling of Reusability of Procedure based Software
Components using Naive Bayes Classifier Approach
Priyanka Kakkar
Mtech(CSE)* SSCET, Pathankot
Meenakshi Sharma
HOD(CSE) SSCET, Pathankot
Parvinder Sandhu,
PhD. Rayat-Bahra, MohaliABSTRACT
We have developed a highly flexible module to evaluate and access the reusability of software components. The purpose of this model is to do pattern recognition by discovering supervised features which can help us to measure the intangible aspects of software components in terms of reusability. There were several function based applications which were given due diligence for identifying their various degrees of reusability of their components. Once these projects were analyzed their software components were measured in terms of software metrics including (Volume, Coupling, Complexity, Reuse frequency, Regularity and Reusability). These measured metrics were carefully allocated a particular set of label which was based on the principals of software engineering and objectives to be achieved for doing the due research. Therefore, in this research work we are studying the degree of reusability by using six classes Naïve Bayes Classification method which was able to give high precision value as compare to previous methods.
1. INTRODUCTION
1.1 Software Reusability
Software reusability more specifically refers to design features of a software element (or collection of software elements) that enhance its suitability for reuse. In software engineering, reusability is the likelihood a segment of source code that can be used again to add new functionalities with slight or no modification. Reusable modules and classes reduce implementation time, increase the likelihood that prior testing and use has eliminated bugs and localizes code modifications when a change in implementation is required. Reusability is often a required characteristic of platform software. Reusability brings several aspects to software development that does not need to be considered when reusability is not required.
For a software component to become reusable, it has to be generalized from the situation at hand, thoroughly documented and tested, incorporated in a library and classification scheme, and maintained as a separate entity. The software industry is moving toward large-scale reuse, resulting in savings of time and money. To develop a new system from scratch is very costly. This has made custom software development very expensive. It is generally assumed that the reuse of existing software will enhance the reliability of a new software application. This concept is almost universally accepted because of the obvious fact that a product will work properly if it has already worked before. A component can be considered an independent replaceable part of the application that provides a clear distinct function. A component can be a coherent package of software that can be independently developed and delivered as a unit, and that offers interfaces by which it can be connected unchanged with other components to compose a larger system.
1.2 Methodology
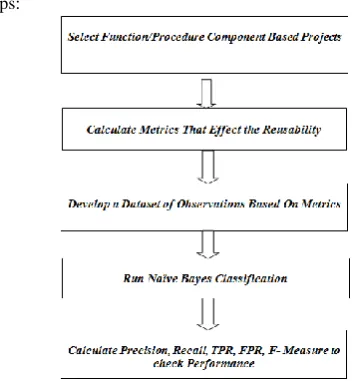
[image:1.595.326.504.243.434.2]Reusability evaluation System for function/procedure Based Software Components can be framed using following steps:
Figure 4.1 Methodology of Function Based Software Components.
Naïve Bayes Classifier
It is a simple probabilistic classifier based on applying Bayes' theorem with strong (naive) independence assumptions. A more descriptive term for the underlying probability model would be "independent feature model".
In simple terms, a Naive Bayes classifier assumes that the presence (or absence) of a particular feature of a class is unrelated to the presence (or absence) of any other feature, given the class variable.
The Naïve Bayes Probabilistic Model:
Abstractly, the probability model for a classifier is a conditional model
over a dependent class variable with a small number of outcomes or classes, conditional on several feature variables through . The problem is that if the number of features is large or when a feature can take on a large number of values, then basing such a model on probability tables is infeasible. We therefore reformulate the model to make it more tractable.
The proposed five metrics for function Oriented Paradigm is as follows:
The proposed metrics for Function Oriented Paradigm are as follows:
According to Mc Cabe, the value of Cyclometric Complexity (CC) can be obtained using the following equation:
2. Cyclometric Complexity Using Mc
Cabe’s Measure
1
Number
of
predicate
nodes
CC
(1)
2. Software Science Indicator
According to this metric volume of the source code of the software component is expressed in the following equation:
)
2
1
(
2
log
2
1
N
N
Volume
(2)3. Regularity Metric
The notion behind Regularity is to predict length based on some regularity assumptions. As actual length (N) is sum of N1 and N2. The estimated length is shown in the following equation:
` (3)
The closeness of the estimate is a measure of the Regularity of Component coding is calculated as:
N
N
N
N
N
gularity
1
{(
)
/
]
/
Re
(4)4. Reuse-Frequency Metric
Reuse frequency is calculated by comparing number of static calls addressed to a component with number of calls addressed to the component whose reusability is to be measured. Let N user defined components be X1, X2 … XN in
the system, where S1, S2 … SM are the standard environment
components e.g. printf in C language, then Reuse-Frequency is calculated as:
M i iS
M
C
Frequency
Reuse
0)
(
1
)
(
(5)5. Coupling Metric
[image:2.595.317.551.360.490.2] [image:2.595.318.556.594.728.2]Functions/methods that are loosely bound tend to be easier to remove and use in other contexts than those that depend heavily on other functions or non-local data. Different types of coupling effects reusability to different extent.
Table 4.1: Confusion Matrix of Prediction Outcomes. Real Data Value of Reusability
Predicted Value of
Reusability 1 0
1 TP FP
0 FN TN
With help of the confusion matrix values the precision and recall values are calculated described below:
Precision
The Precision is the proportion of the examples which truly have class x among all those which were classified as class x. The technique having maximum value of probability of
detection and lower value of probability of false alarms is chosen as the best fault prediction technique.
Precision = TP / (TP + FP) (1)
Recall
Recall in this context is defined as the number of true positives divided by the total number of elements that actually belong to the positive class (i.e. the sum of true positives and false negatives, which are items which were not labeled as belonging to the positive class but should have been) [8]. The recall can be calculated as follows:
Recall=TP (TP+FN)
Accuracy
The percentage of the predicted values that match with the expected values of the reusability for the given data. The best system is that having the high Accuracy, High Precision and High Recall value.
4.2 Results and Discussion
The proposed Naïve Bayes based methodology is implemented in WEKA. WEKA environment is one such facility which lends a high performance language for technical computing.
The function oriented dataset considered have the output attribute as Reusability value. The graphical representation of the count of the number of examples of certain reusability label is shown below in the Figure 4.2
Figure 4.2: Screen shot at coupling, volume, complexity, regularity, reuse frequency and reusability
The given data with six input attributes i.e. Coupling, Volume, Complexity, Regularity, Reuse Frequency, Reusability and Output attributes is loaded in Weka environment. First, the Naïve Bayesian Classification ignores Reusability output attribute.
[image:2.595.47.286.602.685.2]In the Figure 4.3 using Naive Bayes we read the data from the source file. Here, data reads the source file from reusability .arff in drive E as illustrated in the above screen shot. This is actual screenshot of the code which declare the file associated resource for the various output like Precision, Recall, True Positive Rate, F- measure, False Positive Rate etc. .
Figure 4.4: Snapshot of WEKA libraries implemented through Net Beans
The above Figure 4.4 explains the library and and its associated class for installation of Weka through Net Beans. The above figure contains the description of all implemented libraries and associated class used for the Naïve Bayes algorithm
Net Beans IDE is an open-source integrated development environment. Net Beans IDE supports development of all Java application types (Java SE (including JavaFX), Java ME, web, EJB and mobile applications) out of the box. When we compile and run the program using Naïve Bayes classifier in Net Beans we find the various outputs like True Positive Rate, F- measure, True Negative, Recall, Precision etc. as follows:
[image:3.595.54.280.144.270.2]Figure 4.5: True Negatives
The figure 4.5 mainly explains the effects of true negatives at certain instance of true positive rate.
[image:3.595.318.546.276.413.2]Fig 4.6: False Positive Rate
Fig 4.7: True Positive Rate
[image:3.595.54.265.451.583.2]The values of true positive rate is quiet favorable of the environment of the relevant data and desired algorithm which we can see from the figure 4.7 through smooth straight line. The value is quiet relevant for the whole environment and can be considered as an optimist one.
Figure 4.8: F-Measure
The above figure 4.11 clears the effect of F- measure with respect to true positive rate.
The output of the Naïve Bayes is as follows: === Run information ===
Scheme: weka.classifiers.bayes.NaiveBayes Relation: Reusability_Cdata
Instances: 104
Attributes: 6: Coupling, Volume, Complexity, Regularity, Reuse_Frequency, Reusability
Test mode: 10-fold cross-validation
Figure 4.9: Screen Shot Of Results Using Naïve Bayes Algorithm in Weka
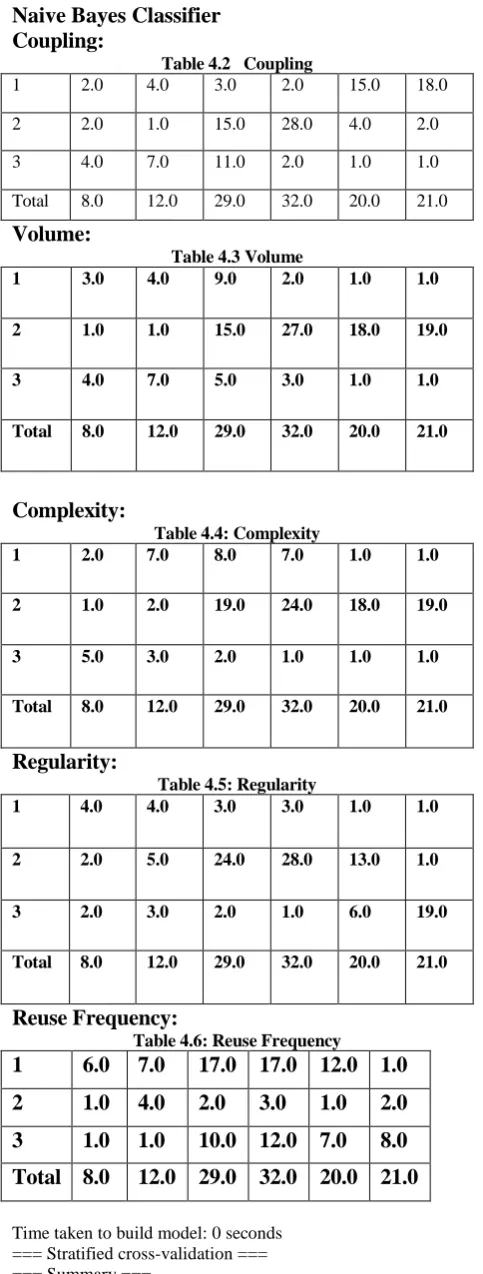
[image:3.595.316.554.547.684.2] [image:3.595.55.269.632.757.2]Naive Bayes Classifier
Coupling:
Table 4.2 Coupling
1 2.0 4.0 3.0 2.0 15.0 18.0
2 2.0 1.0 15.0 28.0 4.0 2.0 3 4.0 7.0 11.0 2.0 1.0 1.0 Total 8.0 12.0 29.0 32.0 20.0 21.0
Volume:
Table 4.3 Volume
1 3.0 4.0 9.0 2.0 1.0 1.0
2 1.0 1.0 15.0 27.0 18.0 19.0
3 4.0 7.0 5.0 3.0 1.0 1.0
Total 8.0 12.0 29.0 32.0 20.0 21.0
Complexity:
Table 4.4: Complexity
1 2.0 7.0 8.0 7.0 1.0 1.0
2 1.0 2.0 19.0 24.0 18.0 19.0
3 5.0 3.0 2.0 1.0 1.0 1.0
Total 8.0 12.0 29.0 32.0 20.0 21.0
Regularity:
Table 4.5: Regularity
1 4.0 4.0 3.0 3.0 1.0 1.0
2 2.0 5.0 24.0 28.0 13.0 1.0
3 2.0 3.0 2.0 1.0 6.0 19.0
Total 8.0 12.0 29.0 32.0 20.0 21.0
Reuse Frequency:
Table 4.6: Reuse Frequency
1
6.0
7.0
17.0 17.0 12.0 1.0
2
1.0
4.0
2.0
3.0
1.0
2.0
3
1.0
1.0
10.0 12.0 7.0
8.0
Total 8.0
12.0 29.0 32.0 20.0 21.0
Time taken to build model: 0 seconds === Stratified cross-validation === === Summary ===
Correctly Classified Instances 74 71.1538 % Incorrectly Classified Instances 30 28.8462 % Kappa statistic 0.6344
Mean absolute error 0.1446 Root mean squared error 0.2731
[image:4.595.309.537.132.255.2]Relative absolute error 54.4404 % Root relative squared error 75.0099 % Total Number of Instances 104
Table 4.7 Detailed Information of various parameters and their accuracy by class
TP
Ra
Te
FP
Ra
Te
Prec
ision
Re
call
FMea
sure
ROC
Area
Cla
ss
0.2 0.01 0.5 0.2 0.286 0.961 1 0.778 0.063 0.538 0.77 0.636 0.958 2 0.462 0.064 0.706 0.46 0.558 0.78 3 0.862 0.187 0.641 0.86 0.735 0.831 4 0.647 0.011 0.917 0.64 0.759 0.806 5 1.0 0.035 0.857 1.0 0.923 0.969 6
=== Confusion Matrix ===
Table 4.8 Confusion Matrix
A B C D E F ClassifiedAs
1 3 1 0 0 0 A=1
1 7 1 0 0 0 B=2
0 3 12 11 0 0 C=3
0 0 3 25 1 0 D=4
0 0 0 3 11 3 E=5
0 0 0 0 0 18 F=6
[image:4.595.368.488.433.557.2]
Comparative Study :
Figure 4.10: Comparative study Of Reusability of class 1
Figure 4.11: Comparative study Of Reusability of class 2
Higher will be the value of class higher will be the precision value . This actually means with increase in the value in the class there will be the increase in the value of precision for both schemes.
Figure 4.12: Comparative study Of Reusability of class 3
It is apparent from the graph that the value of precision for EM algorithm is 0.5 which is far less as compare to NB algorithm which is 0.706.
Figure 4.13: Comparative study Of Reusability of class 4
[image:5.595.364.495.73.204.2]In the above figure the value of precision of old scheme which is EM cluster is shown through pink bar and the value of precision of proposed scheme which is based on NB classification is shown by green bar
.
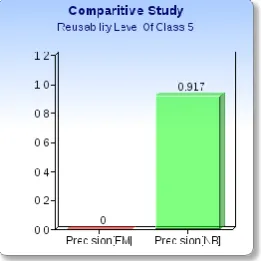
Figure 4.14: Comparative study Of Reusability of class 5
It is apparent from the above figure 4.21 the Precision value of EM is lowest which is 0 in the class 5 of reusability and the Precision value of NB is highest which is 0.917.
Figure 4.15: Comparative study Of Reusability of class 6
It is clear that in the last class of reusability the value of Precision due to EM algorithm is low which is 0.78 as compare to Precision due to Naïve Bayes Classification which is 0.857.
5.1 Conclusion
In this study Naïve Bayes based classification approach is evaluated for Reusability Prediction of Function based Software systems. Here, the metric based approach is used for prediction. Reusability value is expressed in the six linguistic values. Six input metrics are used as Input and classifiers are formed using Naïve Bayes algorithm, thereafter 10 fold cross validation performance of the system is recorded. As deduced from the results it is clear that Precision and Recall values of reusability class in the level, it means the system is able to detect the “Excellent” components precisely. Similarly, through Precision and Recall values of the reusability class for the second best, this is able to detect the “Non-Reusable” components with good precision.
The proposed technique is showing Accuracy value approximately equal to 71%, so it is satisfactory enough to use the Naïve Bayes based classification technique for the prediction of the function based reusable modules from the existing reservoir of software components.
5.2 Future scope
of component at fine grain level (functions) can be achieved in future as further implementation of assessment model
Intelligent Component Mining or Extraction algorithms can be developed
Early prediction of the quality of component based system
Characterization of Software Components for easy retrieval
REFERENCES
[1] Basili, V. R. and Rombach, H. D. (1988) “The TAME Project: Towards Improvement Oriented Software Environments”, IEEE Trans. Software Eng., vol. 14, no. 6, June 1988, pp. 758-771.
[2] Selby, R. W. (1988) “Empirically Analyzing Software Reuse in a Production Environment”, Software Reuse: Emerging Technology, W. Tracz, ed, IEEE Computer Society Press, 1988.
[3] Basili, V.R. (1989) “Software Development: A Paradigm for the Future”, Proceedings COMPAC’89, Los Alamitos, California, IEEE CS Press, 1989, pp. 471-485. [4] Arnold, R.S. (1990) “Salvaging Reusable Parts From
Ada Code: A Progress Report”, SPC Technical Report, SALVAGE_ADA_PARTS_PR-90048-N, September 1990.
[5] Arnold, R.S. (1990) “ Heuristics for Salvaging Reusable Parts From Adav Code”, SPC Technical Report, ADA_REUSE_HEURISTICS-90011-N, March 1990. [6] Esteva, J. C. and Reynolds, R. G. (1991)
“Identifying Reusable Components using Induction”, International Journal of Software Engineering and Knowledge Engineering, Vol. 1, No. 3 , 1991, pp. 271-292
[7] Mayobre, G. (1991) “Using Code Reusability Analysis to Identify Reusable Components from Software
Related to an Application Domain,” Proceeding of the Fourth Workshop on Software Reuse, Reston. VA, November, 1991, pp. 87-96.
[8] Stender (1994) “Introduction to genetic algorithms”, IEEE Colloquium on Genetic Algorithms, Volume 2, March 15, 1994 pp. 1-4.
[9] Jang, J-S. R. a n d Sun, C.T. (1995) “Neuro-fuzzy Modeling and Control”, Proceeding of IEEE, March 1995, pp. 123-135.
[10]Klir, G. J. and Yuan, B. (1995) “Fuzzy Sets and Fuzzy Logic” Prentice-Hall, New Jersey.
[11]Kartalopoulos, S. V. (1996) “Understanding Neural Networks and Fuzzy Logic-Basic Concepts and Applications”, IEEE Press, 1996, pp. 153-160.
[12]Jerome Feldman (1996) “Neural Networks - A Systematic Introduction” Berlin, New-York, 1996. [13]Succi, G., Benedicenti, L., and Vernazza, T., “Analysis
of the Effects of Software Reuse on Customer Satisfaction in an RPG Environment”, IEEE Trans. Software Eng., vol. 27, no. 5, May 2001, pp. 473-479. [14]Anderson, J.A (2003) “An Introduction To Neural
Networks”, Prentice Hall of India.
[15]Frakes, W.B. and Kyo Kang (2005) “Software Reuse Research: Status and Future”, IEEE Trans. Software Engineering, vol. 31, issue 7, July 2005, pp. 529 - 536. [16]Parvinder Singh and Hardeep Singh (2005)