Distributing Graphic Rendering using Grid Computing
with Load Balancing
El-Sayed M. T. El-kenawy
Dep. of Comp. and Sys. Eng.,
Faculty of Engineering,
Mansoura University, Egypt
Ali Ibraheem El-Desoky
Dep. of Comp. and Sys. Eng.,
Faculty of Engineering,
Mansoura University, Egypt
Mohamed F. Al-rahamawy
Dep. of Computer scienecs,
Faculty of Computer and Info.,
Mansoura University, Egypt
ABSTRACT
Graphic rendering is expensive in terms of computation. We investigate distributing it by applying the powerful computing technique called grid computing, and showing how this technology has a great effectiveness and high performance.
The paper shows how to develop a java drawing framework for drawing in the distributed environment by dividing the work upon nodes in grid computing and selecting the best nodes for job assignments to have the jobs executed in the least amount of time. Schedulers are limited in individual capability, but when deployed in large numbers can represent a strong force similar to a colony of ants or swarm of bees.
The paper also presents a mechanism for load balancing based on swarm intelligence such as Ant colony optimization and Particle swarm Optimization.
General Terms
Graphic Rendering, Grid Computing, Load Balancing.
Keywords
Rendering, Grid computing, swarm intelligence, Ant colony optimization, Particle swarm Optimization
1.
INTRODUCTION
This section reviews the basic concepts such as graphic rendering, grid computing and load balancing.
1.1
Grid distributing environment
We enjoy increasing network bandwidth, powerful computers, software, and user acceptance. These elements are currently converging and enabling a new global infrastructure called "The Grid", originally derived from the electrical "Power Grid" which provides electricity to every wall socket. A computational or data grid is hardware and software infrastructure that provides dependable, consistent, pervasive, and inexpensive access to computational capabilities, as described in Foster and Kesselman [1]. It connects distributed computers, storage devices, mobile devices, instruments, sensors, data bases, and software applications.
Grids provide many more benefits such as:
Access: Seamless, transparent, remote, secure, wireless access to computing, data, experiments, sensors, etc.
Virtualization: Access to compute and data services without caring about the infrastructure.
On Demand: Get the resources you need, when you need them, at the quality you need.
Sharing: Enable collaboration of teams over the Internet, to work on one complex task.
Failover: In case of system failure, migrate and restart applications automatically, on another machine.
Heterogeneity: In large and complex grids, resources are heterogeneous.
Utilization: Grids can increase average utilization from some 20% towards 80% and more. For example, our own Sun Enterprise Grid to design Sun’s next-generation processors is utilized at over 95%, on average.
Several of these benefits are present already in small compute cluster environments, often called Mini-Grids, or Cluster Grids, or Department Grids, or simply “managed clusters”. In many of our early grid projects, since about 1998, our partners and customers started building mini-grids, see for example some 20 customer reports at [2]. In fact, today (January 2003), over 7,000 cluster grids are in production, running the distributed resource management software Sun Grid Engine [3], or its open source version Grid Engine [4]. A few hundred of those early adopters already implemented the next level, so-called Campus or Enterprise Grids, connecting resources distributed over the university campus or the global enterprise, using the Sun Grid Engine Enterprise Edition [3]. And a few dozen of them are currently transitioning towards Global Grids, connecting resources distributed beyond university or enterprise firewalls, and using global grid technology like Globus [5] and Avaki [6], integrated with Sun Grid Engine.
Many research papers are done to investigate the design of the grid environment and to characterize the underlying requirements from the network and the operating systems ([7], [8],[9], [10]).
1.2
Graphic rendering
There are two types of computer graphics: Vector graphics such as Flash and Bitmap graphics such as Photoshop. Whether the image is a bitmap graphic or vector graphic both are displayed on a modern monitor by going through a process known as rendering. Monitors are made of a number of small dots called pixels. To display an image on the monitor the program must set each pixel to appropriate color or shade of grey. The computer keeps a memory based model of the image that will be displayed on the screen. In this model it keeps the information about the picture to be displayed. Then it lightens the needed pixels from this model and this process is called rendering, i.e. The process of generating a pattern of pixels from a model is called rendering.[11]
technologies have extended the range of possible applications, ( [12], [13], [14]), and new algorithms have improved the ability to cope with problems inherent to laser scanning, ([15], [16], [17], [18]). Passive methods usually concern the task of generating a 3D model given multiple 2D photographs of a scene. In general they do not require a very expensive equipment, but quite often a specialized set-up, ( [19], [20], [21]). Passive methods are commonly employed by Model-Based Rendering techniques.
1.3
Load balancing using swarms
One of the main components of a distributed system is the distributed process scheduler that manages the resources. A distributed process scheduler manages the resources of the whole system efficiently by distributing the load among the processors to maximize the overall system performance [22]. The distributed scheduler must perform the load distributing operations transparently, which means the whole system is viewed as a single computer by the users of it [23].
[image:2.595.317.540.233.599.2]Swarms provide the possibility of enhanced task performance, high reliability (fault tolerance), low unit complexity and decreased cost over traditional robotic systems. They can accomplish some tasks that would be impossible for a single robot to achieve. Swarms can dynamically change their structure to match environmental variations[24]. Ants , bees and termites are beautifully engineered examples of this kind of software in use. These insects do not use centralized communication; there is no strict hierarchy, and no one in charge. However, developing swarm software from the “top down”, i.e., by starting with the group application and trying to determine the individual behaviors that it arises from, is very difficult. Instead a “group behavior building blocks” that can be combined to form larger, more complex applications are being developed. [25]
Figure 1: Leaf Cutter Ants [26]
2.
METHODOLOGY
Our task is to draw a curve formed by rolling a smaller circle of radius r inside a larger circle or radius R. If the pen offset of the pen point in the moving circle is a, then the equation of the resulting curve at time t is
x = (R+r)*cos(t) - (r+a)*cos(((R+r)/r)*t)
y = (R+r)*sin(t) - (r+a)*sin(((R+r)/r)*t)
The serial task implementation is [27] :
public class Spirograph {
public static void main(String[] args) {
double R = 180; //Double.parseDouble(args[0]);
double r = 40; //Double.parseDouble(args[1]);
double a = 15; //Double.parseDouble(args[2]);
StdDraw.setXscale(-300, +300);
StdDraw.setYscale(-300, +300);
StdDraw.clear(StdDraw.BLACK);
for (double t = 0.0; t < 100; t += 0.01) {
double x = (R+r) * Math.cos(t) - (r+a) * Math.cos(((R+r)/r)*t);
double y = (R+r) * Math.sin(t) - (r+a) * Math.sin(((R+r)/r)*t);
double degrees = -Math.toDegrees((R+r)/r)*t;
StdDraw.picture(x, y, "earth.gif", degrees);
// StdDraw.rotate(+Math.toDegrees((R+r)/r)*t);
StdDraw.show(20);
}
}
[image:2.595.66.265.434.631.2]}
Figure 2: running of the task
To distribute it we will use java Grid [28]. The Project Implementation is put forth into real world using Image rendering concepts and the toolkit used for rendering.
In a Java Grid there is only one Server that receives work requests from clients and forwards the requests to the workers.
It collects work results from the workers and sends back the results to the clients. The Server receives any file required for completing the work request from the client and stores it.
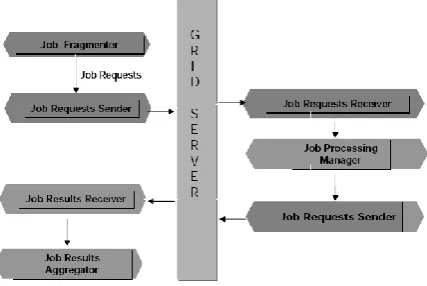
There can be as many workers. The worker fulfils work request received by the server and send back the work results. In a Java Grid there can be as many clients as needed. The clients split the work in several work requests and collects work results. The technical architecture is shown in figure 3:
Figure 3: technical Architecture
Next we give a summary of the methodology needed. Main techniques are Ant colony optimization (ACO) and Particle swarm Optimization (PSO).
ACO is a Meta heuristic optimization algorithm that can be used to find approximate solutions to difficult combinatorial optimization problems. In ACO artificial ants build solutions by moving on the problem graph and they, mimicking real ants, deposit artificial pheromone on the graph in such a way that future artificial ants can build better solutions. ACO has been successfully applied to an impressive number of optimization problems [29].
PSO is a global optimization algorithm for dealing with problems in which a best solution can be represented as a point or surface in an n-dimensional space. Hypotheses are plotted in this space and seeded with an initial velocity, as well as a communication channel between the particles. Particles then move through the solution space, and are evaluated according to some fitness criterion after each time step. Over time, particles are accelerated towards those particles within their communication grouping which have better fitness values. The main advantage of such an approach over other global minimization strategies such as simulated annealing is that the large numbers of members that make up the particle swarm make the technique impressively resilient to the problem of local minima [30].
ACO is the most used so we will focus on it, by discussing the concept of Pheromone Control ([31] – [38]).
Pheromone control adopts several approaches to reduce the influences from past experience and encourages the exploration of new paths or paths that were previously non-optimal. The approaches as follows:
1. Evaporation
2. Aging
3. Limiting and Smoothing Pheromone
4. Pheromone-Heuristic Control
Now let us discuss them in depth.
2.1
Evaporation
To reduce the effect of past experience, an approach called evaporation is typically used in conjunction with ACO. Evaporation prevents pheromone concentration in optimal paths from being excessively high and preventing ants from exploring other (new or better) alternatives. In each iteration, the pheromone values Tij in all edges are discounted by a
factor such that Tij Tij (1 - p)
Suppose that at some iteration ti, all ants converge to a path
Ri, and deposit a very high concentration of pheromone
(represented with larger triangles). In the next iteration ti+1,
the pheromone concentration along Ri is reduced by some
factor (represented by smaller triangle), and at ti+2, the
pheromone concentration is further reduced.
Implementation of Evaporation
For i = 0 To ptop - 1
pstrength(i) = pstrength(i) * 0.9
Next
2.2
Aging
Additionally, past experience can also be reduced by controlling the amount of pheromone deposited for each ant according to its age. This approach is known as aging . In aging, an ant deposits lesser and lesser pheromone as it moves from node to node.
Aging is based on the rationale that “old” ants are less successful in locating optimal paths since they may have taken longer time to reach their destinations. Both aging and evaporation include recency as a factor of routing preference, hence, if a favorable path is not chosen recently, its preference will be gradually eliminated. By making existing pheromone trail less significant than the recent pheromone updates, both aging and evaporation encourage discoveries of new paths that were previously non-optimal.
Implementation of Aging
agefactor = 0.9
updted = 0
For I = 0 To ptop - 1
If ppath(I) = path Then
updted = 1
pstregth(I) = pstrength(I) + agefactor ^ hops
End If
Next
If updted = 0 Then
ppath(ptop) = path
pstrength(ptop) = agefactor ^ hops
ptop = ptop + 1
End If
2.3
Limiting and Smoothing Pheromone
Stagnation is done by limiting the amount of pheromone in every path. By placing an upper bound Tmax on the amount of
A variant of such an approach is pheromone smoothing. Using pheromone smoothing, the amount of pheromone along an edge is reinforced as follows:
Tij (new) = Tij (old) + δ * ( Tmax - Tij (old))
where δ is a constant between 0 and 1.
It can be seen that as Tij (old) Tmax a smaller amount of
pheromone is reinforced along an edge (i , j). Although not totally identical, pheromone smoothing also bears some resemblance to evaporation. While evaporation adopts a uniform discount rate for every path, pheromone smoothing places a relatively greater reduction in the reinforcement of pheromone concentration on the optimal path(s). Consequently, pheromone smoothing seems to be more effective in preventing the generation of dominant paths.
Implementation of Limiting and Smoothing Pheromone
tmax = 100
smoothing = 0.33
Private Sub updperval(path As String)
updted = 0
For i = 0 To ptop - 1
If ppath(i) = path Then
updted = 1
pstrength(i) = pstrength(i) + smoothing * (tmax - pstrength(i))
End If
Next
If updted = 0 Then
ppath(ptop) = path
pstrength(ptop) = smoothing * (tmax)
List4.AddItem pstrength(ptop)
ptop = ptop + 1
End If
2.4
Pheromone-Heuristic Control
To configure ants so that they do not solely rely on sensing pheromone for their routing preferences, this can be accomplished by configuring the probability function Pij for
an ant to choose an edge (i , j) using a combination of both pheromone concentration Tij and heuristic function ηij. As
noted , an ant selects an edge probabilistically using Tij and ηij
as a functional composition for Pij. In network routing, ηij is a
function of the cost of edge (i , j).
αand βrepresent the respective adjustable weights of Tij and
ηij. Consequently, the routing preferences of ants can be
altered by selecting different values of αand β. If α> βants favor paths with higher pheromone concentrations, and a higher value of β directs ants to paths with more optimistic heuristic values. In general, different values of αand β are suitable to be applied at different states of a network. A lower value of α is generally preferred when pheromone concentration along paths may not necessarily reflect their optimality. Examples of such situations include the initial stage after a network reboots, and when there are frequent and abrupt changes in network status due to either link (or node) failure or introduction of new paths (nodes). However, as a
network stabilizes, a higher value of α is preferred. Furthermore, recent research demonstrated that dynamically altering the values of αand β in response to changes in network status may increase the performance of ants.
Implementation of Pheromone-Heuristic Control
For i = 0 To List2.ListCount - 1
If Left$(List2.List (i), 13) = stringparse (b, "DEST=") Then
commaparse1 (List2.List (i))
reddo1:
l = Int (Rnd * iptop1 + 1)
If l = 0 Then GoTo reddo1
tosys = ips1 (l)
End If
Next
i = Int (Rnd * iptop1)
i = i + 1
pher:
small = Len (ppath(0))
locn = 0
For i = 0 To ptop - 1
If Len (ppath (i)) < small Then
small = Len (ppath(i))
locn = i
End If
Next
pstrength (locn) = pstrength (locn) + 1
3.
RESULTS
By running the algorithm, we get the following results
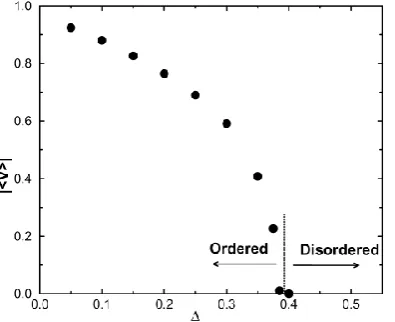
Between the magnitude of average velocity (|v|) and the ordering factor (Δ) . Where V= ∑ vi /N
And vi is the velocity of ant number i and N is the total
[image:4.595.315.535.608.764.2]number of ants. The ordering factor (Δ) can be measured by dividing the number of ants matching the desired topology over the total number of ants.
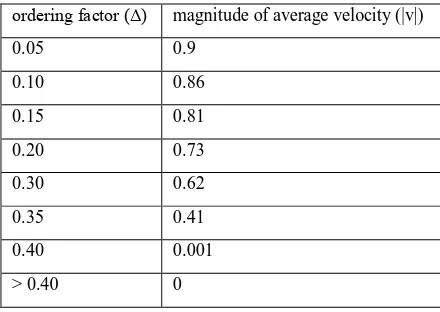
Table 1: relation between ordering factor (Δ) and magnitude of average velocity (|v|)
ordering factor (Δ) magnitude of average velocity (|v|)
0.05 0.9
0.10 0.86
0.15 0.81
0.20 0.73
0.30 0.62
0.35 0.41
0.40 0.001
4.
DISCUSSION
Figure 6 shows the relation between ordering factor (Δ) and magnitude of average velocity (|v|).
Figure 6: relation between ordering factor (Δ) and magnitude of average velocity (|v|)
We recommend avoiding increasing the desired ordering factor over 40% of the desired architecture, as the scheduler will suddenly stop.
5.
CONCLUSION
In this paper, we investigate image rendering by applying the powerful computing technique called grid computing, and showing how this technology has a great effectiveness and high performance.
We also are developing a java drawing framework for drawing in the distributed environment by dividing the work upon nodes in grid computing and selecting the best nodes for job assignments to have the jobs executed in the least amount of time.
Schedulers are limited in individual capability, but when deployed in large numbers can represent a strong force similar to a colony of ants or swarm of bees.
We present a mechanism for load balancing based on swarm intelligence such as Ant colony optimization and Particle swarm Optimization
REFERENCES
[1] R. Butler, D. Engert, I. Foster, C. Kesselman, S. Tuecke, J. Volmer, V. Welch, 2000, A National-Scale Authentication Infrastructure, IEEE Computer
[2] B. M. Chapman, B. Sundaram, K. Thyagaraja, EZGrid system: A Resource broker for Grids, http://www.cs.uh.edu/~ezgrid
[3] K. Czajkowski, S. Fitzgerald, I. Foster, C. Kesselman, 2001, Grid Information Services for Distributed Resource Sharing.
[4] K. Czajkowski, I. Foster, N. Karonis, C. Kesselman, S. Martin, W. Smith, S. Tuecke, 1998, A Resource Management Architecture for Metacomputing Systems, Proc. IPPS/SPDP '98 Workshop on Job Scheduling Strategies for Parallel Processing
[5] I. Foster and C. Kesselman, 1997, Globus: A metacomputing infrastructure toolkit," International Journal of Supercomputer Applications, Summer
[6] I. Foster and C. Kesselman, 1999, The GRID: Blueprint for a new Computing Infrastructure, Morgan Kauffman Publishers.
[7] Browne, J.C.; 2004, Grid computing as applied distributed computation: a graduate seminar on Internet and Grid computing, Cluster Computing and the Grid, 2004. CCGrid 2004. IEEE International Symposium .
[8] Darema, F.; 2005, Grid computing and beyond: the context of dynamic data driven applications systems, Proceedings of the IEEE, Volume 93, Issue 3, pp 692 - 697
[9] Wang, L.; Kunze, M.; 2006, On the Design of Virtual Environment Based Workflow System for Grid Computing, Grid and Cooperative Computing Workshops, 2006. GCCW '06. Fifth International Conference, pp 212 - 218
[10] Ali, A.; McClatchey, R.; Anjum, A.; Habib, I.; Soomro, K.; Asif, M.; Adil, A.; Mohsin, A.; 2006, From Grid Middleware to a Grid Operating System, Grid and Cooperative Computing, 2006. GCC 2006. Fifth International Conference, pp. 9 - 16
[11] Frank Klawonn, 2008 , Introduction to Computer Graphics: Using Java 2D and 3D (Undergraduate Topics in Computer Science), Springer Publishing Company
[12] Levoy M., 2002, The digital michelangelo project: 3d scanning of large statues, Dept. Computer Science, University of Standford.
[13] Hogg D., 1999, The resolv project, Dept. Computer Studies, University of Leeds., eu-project.
[14] Fisher R.B. 2001, Div. Informatics, University of Edinburgh. The camera project (cad modelling of built environments from range analysis), eu tmr-project. .
[15] U. Castellani, S. Livatino, and R.B. Fisher., 2002, Improving environment modelling by edge occlusion surface completion. In 1st International Symposium on 3D Data Processing Visualization and Transmission (3DPVT), Padova, Italy.
[16] U. Castellani and S. Livatino., 2001, Scene reconstruction: Occlusion understanding and recovery. In Robert B. Fisher, editor, CVonline: The Evolving, Distributed, Non-Proprietary, On-Line Compendium of Computer Vision. School of Informatics, University of Edinburgh.
[17] F. Stulp. , 2001, Completion of Occluded Surfaces. , PhD thesis, Rijksun Universiteit, Groningen, Holland.
[18] J. Davis, S.M. Marschner, M. Garr, and M. Levoy. , 2002, Filling holes in complex surfaces using volumetric diffusion. In 1st International Symposium on 3D Data Processing Visualization and Transmission (3DPVT), Padova, Italy.
[19] T. Kanade, P. Narayanan, and P. Rander. , 1995, Virtualized reality: Concepts and early results. In IEEE Workshop on Representation of Visual Scenes, pp 69-76.
[image:5.595.61.259.117.278.2][21] B. Tseng and D. Anastassiou, 1994. Compatible video coding of stereoscopic sequences using mpeg-2's scalability and interlaced structure. In International Workshop on HDTV'94, Torino, Italy.
[22] Singhal M., Shivaratri N., 1994, Advanced Concepts In Operating Systems, McGraw Hill
[23] Tanenbaum, A., 1995, Distributed Operating Systems, Prentice Hall
[24] Yang X. S., 2008, Nature-Inspired Metaheuristic Algorithms. Frome: Luniver Press
[25] Karaboga, Dervis, 2010, Artificial bee colony algorithm Scholarpedia, , volume 5. Pages 6915
[26] Driving Lessons from Leafcutter Ants at http://www.autoevolution.com/news/driving-lessons-from-leafcutter-ants-3950.html
[27]Spirograph
http://www.wordsmith.org/~anu/java/spirograph.html
[28]
http://www.theserverside.com/news/thread.tss?thread_id =48681
[29] Vladimir G. Ivancevic,Tijana T. Ivancevic
, 2007, Computational mind: a complex dynamics perspective, page 251[30] Parsopoulos, K. E.; Vrahatis, M. N. , 2002, Recent Approaches to Global Optimization Problems Through Particle Swarm Optimization. Natural Computing, volume 1, pages 235–306.
[31] A. Colorni, M. Dorigo, V. Maniezzo, M. Trubian, 1994, Ant system for job-shop scheduling, Belgian Journal of Operations Research, volume 34, pp.39–53.
[32] P.R. McMullen, 2001, An ant colony optimization approach to addressing a JIT sequencing problem with multiple objectives, Artificial Intelligence, in Engineering, vol. 15, pp. 309–317.
[33] V. T’kindt, N. Monmarche, F. Tercinet, D. Laugt, 2002, An ant colony optimization algorithm to solve a 2-machine bicriteria flowshop scheduling problem, European Journal of Operational Research, volume 142 , pp 250–257.
[34] M. Gravel, W.L. Price, C. Gagne, 2002, Scheduling continuous casting of aluminum using a multiple objective ant colony optimization metaheuristic, European Journal of Operational Research, volume 143, pp 218–229.
[35] K.-C. Ying, C.-J. Liao, 2004, An ant colony system for permutation flow-shop sequencing, Computers and Operations Research, volume 31, pp 791–801.
[36] T. Stützle, 1998, An ant approach to the flow shop problem, in: Proceedings of the 6th European Congress on Intelligent Techniques & Soft Computing, EUFIT’98, Aachen, Germany, pp. 1560–1564.
[37] S.J. Shyu, B.M.T. Lin, P.Y. Lin, 2004, Application of ant colony optimization for no-wait flowshop scheduling problem to minimize the total completion time, Computers and Industrial Engineering, volume 47, pp 181–193.