Munich Personal RePEc Archive
Household Demand and Welfare
Implications of Water Pricing in Cyprus
Pashardes, Panos and Koundouri, Phoebe and Hajispyrou,
Soteroula
2002
Household Demand and Welfare
Implications of Water Pricing in Cyprus
Panos Pashardes
∗University of Cyprus, Nicosia 1678, Cyprus (p.pashardes@ucy.ac.cy)
Phoebe Koundouri
University of Cyprus, Nicosia 1678, Cyprus (ec&vi@ucy.ac.cy)
Soteroula Hajispyrou
University of Cyprus, Nicosia 1678, Cyprus (shspyros@ucy.ac.cy)
September 2000
Abstract
This paper considers a model of household demand for water in a theoretical framework consistent with funtamendal principles of comsumer behaviour. It ap-plies this model to individual household data to estimate the price and income elasticities of residential demand for water in Cyprus and evaluate the welfare ef-fects associated with changes in the water pricing system. We &nd that the current regionally heterogeneous increasing block pricing system in the island introduces gross price distortions that are not justi&ed either on efficiency or equity grounds. A shift towards uniform marginal cost pricing will eliminate the deadweight loss of the current system. However, its bene&ts will be distributed in favour of the better offhouseholds. Overall, price can be an effective tool for residential water demand management, however, it may also lead to socially undesirable distributional effects on households.
JEL Classi&cation:
Keywords: Residential water demand, increasing block pricing, consumer welfare, water management.
∗We would like to thank the University of Cyprus for &nancial support and the Central Statistical
1
Introduction
The use of price as a water consumption management tool has been an issue of growing concern among private and public utilities in Europe and the United States. Water utilities often choose among three types of pricing schemes, uniform, decreas-ing and increasdecreas-ing block rates (or some combination of them) to in! uence water use. Economists have attempted to shed some light on the consequences of this choice by paying attention to demand estimation. However, opinions concerning the appropriate methodology for estimating water demand models differ. This paper considers demand for water in the context of a theoretical framework consistent with fundamental prin-ciples of consumer behaviour. It then applies this model to individual household data drawn from the Cyprus Family Expenditure Survey (1996-97) to estimate the price and income elasticities of residential demand for water and evaluate the welfare effects associated with potential changes in the current water pricing system.
Given that consumers in Cyprus are metered, there are strong efficiency arguments for prices to re! ect the (long-run) marginal social cost of water scarcity. At the moment water pricing in Cyprus follows an increasing block structure. In general, increasing block (progressive) tariffs are becoming more common in developed as well as devel-oping economies. The rational for the popularity of this pricing system relates to the perception that it can be used as a tool for social justice and conservation of a scarce natural resource. Strictly speaking, there are no obvious efficiency arguments for an increasing block water tariffstructure and the evidence in favour of the argument that this pricing structure has a psychological effect helping water demand management is ambiguous: OECD (1987) reports evidence in favour of this argument in Japan, Italy, Denmark and Switzerland (Zurich) while other studies (e.g. the UK metering trials in the Thames and Yorkshire water authorities) prove inconclusive.
Maré (1982), Hansen (1996), Höglund (1999), Nauges and Thomas (2000) and Martinez-Espieneira (2000). A summary of the &ndings of some of these studies is provided by Herrington (1987). Overall the existing empirical results suggest that the price elasticity of demand for water is signi&cantly different from zero and lie somewhere under -0.3.
Earlier studies of water demand ignore the peculiar features of alternative water pricing policies, such as the presence of block rates, and perform empirical estimation using ex post-calculated average prices (Gottlieb1963; Young1973; Foster and Beattie
1979, 1981a, 1981b). Taylor (1975), studying electricity demand, suggests that under a block pricing scheme the explanatory variables should include marginal and average price. Subsequently, Nordin (1976) demonstrated that Taylor s speci&cation should be modi&ed to include a difference variable represents the income effect imposed by the tariffstructure by accounting for the effects of &xed and intra-marginal rates. In the case of multiple tariffs (and those cases where &xed quota and/or a free allowance is used) the difference variable is the difference between the total bill and what the user would have paid if all units were charged at the marginal price. More recently, investigators combine marginal price and Nordin s difference variable in empirical models of residential water demand.1
In this paper we follow a different approach to modelling residential demand for water. The novelty of our approach is mainly in terms of exploiting the cost and indirect utility functions underlying the consumer theory framework to derive a most general (rank-3) integrable demand model (Lewbel 1991). This enable us to obtain empirical results that conform to the fundamentals of consumer theory (such as adding-up, price homogeneity and symmetry) and have meaningful behavioural and welfare interpretation. We consider the ability to evaluate the welfare implications of alternative water pricing policies particularly important, given the signi&cance attached to equity and the strong political objections to water price reform based on political economy arguments (Dinar 2000). In the empirical analysis we treat the measurement error problem arising from the increasing block pricing structure by using an instrumental
1Estimating water demand under a block pricing structure requires an appropriate modelling to
variables (IV) estimation method. Moreover, unlike most other studies, here we use individual household data and this allows us to study the behavioural and welfare effects of alternative pricing policy on households grouped by income and other interesting policy characteristics. The empirical analysis in the paper focuses on the comparison between the effects of the increasing block and the uniform pricing systems on household demand and welfare. The former is the prevailing structure of water pricing in Cyprus and the latter is the pricing structure generally considered to be most efficient on the basis of the standard marginal cost pricing criterion.
In the next section we describe the current water tariffstructure applied to domestic users and examine its regional and income distribution aspects. In the same section we also compare the existing water tariffstructure with a hypothetical situation where all water authorities in the island adopt a uniform &xed price policy. All calculations in this section are based on the assumption that water demand for domestic use does not respond to change in prices. This assumption is relaxed in the subsequent two sections where &rst an integrable demand for water model is derived (Section 3) and then applied to individual household data for the estimation of income and price elasticities and for the calculation of the welfare of a switch to a uniform &xed price policy (Section 4). The main conclusions of the paper are summarised in Section 5.
2
The structure and distribution of water tari
ff
s in Cyprus
The government controlled part of Cyprus is divided into 37 water authorities each having its own tariffstructure, as shown in Table A1in the Appendix. The adoption of an increasing block tariffstructure and differences in the application of this pricing policy across water authorities give rise to a substantial water price heterogeneity in the island. The effects of differences in water tariffs on households are examined in this paper using information on water consumption contained in the Family Expenditure Survey (FES)
Using the FES 1996/97 standard geographical code we were able to allocate house-holds to water authorities areas and calculate the level of annual water consumption for each household and the average price paid per cubic meter (pcm) of water.2 As shown in Diagram 1, there is substantial variation in the average price paid pcm of water for domestic consumption in Cyprus. At the extreme bottom and top ends of the distribution there is a small number of households paying10 cents and over one Cyprus pound pcm of water, respectively. Most households pay between 20 and 90 cents per cubic meter for their water consumption.3
Diagram 1: Distribution of the average water price
0% 2% 4% 6% 8% 10% 12% 14% 16% 18%
10 16 27 36 50 60 70 80 90 100 More
Average price
Fr
e
q
ue
n
c
y
2The average price of water pcm for each household is de&ned as the water charges paid divided by
the cubic meters of water consumed over one year. The water bill of theht h houshold is W B i l lh =
f i xed+ p1q1+ p2q2+ ...+ pIqI whereh = 1, ..., H denotes households andi = 1, ..., I tariffs. The quantity
purchased and the marginal price paid by each household in the &rst tariff-block was calculated using the formula
wb1 = f i xed + p1(10)
q1 = (W B i l l−f i xed)/ p1
M Ph = p1 ifW B i l lh > f i xedandW B i l lh < wb1
and for the subsequent tariff-blocks,
wbi = wbi−1+ pi(5)
qi = (W B i l l−wbi)/ pi
M Ph = pi ifW B i l l≤wbi andW B i l l > wbi−1
i = 1, ..., 23
The marginal price is the charge made for the last cubic meter of water used.
3
We have also used the FES 1996/97 data to calculate the marginal price pcm of water for each household, an important piece of information as it shows how households would be affected by a water price reform. Given the increasing block tariff structure, the marginal price pcm of water is higher than the average one in all water authorities. As seen in Diagram 2, the frequency distribution of the marginal price pcm of water is skewed to the left, indicating that moving up the price scale the proportion of households paying the corresponding price for an additional cubic meter of water increases.
Diagram 2: Distribution of the marginal water price (cents)
0% 5% 10% 15% 20% 25% 30%
10 21 30 41 50 62 71 82 91 102 111 More
Marginal price
Fr
e
que
nc
y
According to the Water Development Department (WDD), the average cost of sup-plying one cubic meter of water for domestic consumption (including distribution costs) is currently around 70 cents in Cyprus. Looking at the above frequency distributions, one can conclude that over 20% of the households are paying above average cost for their domestic water consumption. Furthermore, as seen from Diagram 2, more households are burdened rather than subsidised. at the margin of their water consumption.
2.1
Price heterogeneity between regions
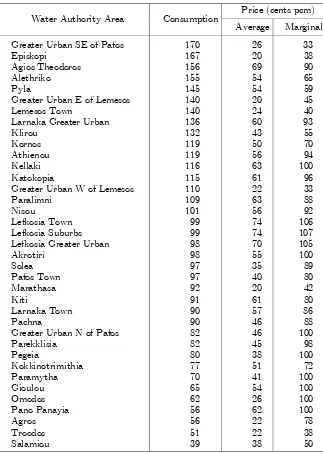
[image:7.595.130.486.279.463.2]Table 1: Consumption and price pcm of water by region (in cents)
Price (cents pcm) Water Authority Area Consumption
Average Marginal Greater Urban SE of Pafos 170 26 33
Episkopi 167 20 38
Agios Theodoros 156 69 90
Alethriko 155 54 65
Pyla 145 54 59
Greater Urban E of Lemesos 140 20 45 Lemesos Town 140 24 40 Larnaka Greater Urban 136 60 93
Klirou 132 43 55
Kornos 119 50 70
Athienou 119 56 94
Kellaki 116 63 100
Katokopia 115 61 96
Greater Urban W of Lemesos 110 22 33
Paralimni 109 63 88
Nisou 101 56 92
Lefkosia Town 99 74 106 Lefkosia Suburbs 99 74 107 Lefkosia Greater Urban 98 70 105
Akrotiri 98 55 100
Solea 97 35 89
Pafos Town 97 40 80
Marathasa 92 20 42
Kiti 91 61 80
Larnaka Town 90 57 86
Pachna 90 46 88
Greater Urban N of Pafos 82 46 100 Parekklisia 82 45 98
Pegeia 80 38 100
Kokkinotrimithia 77 51 72
Paramytha 70 41 100
Gioulou 65 54 100
Omodos 62 26 100
Pano Panayia 56 62 100
Agros 56 22 78
Troodos 51 22 38
Salamiou 39 38 50
more and better quality groundwater resources for their domestic needs. Therefore, their water consumption may not be as low as suggested by the &gures in Table 1.
Regarding differences in average and marginal price, the range of variation shown in Table 1 is striking considering the size of (the non-occupied part of) Cyprus. Some households purchase water from their local authority at an average price of 20 cents pcm (e.g. Episkopi and Greater Urban Area East of Lemesos) whereas in other water authority areas pay an average price of 74 cents pcm of water (Nicosia Town and its suburbs). Even more striking are differences in the price paid by households for the last cubic meter of water purchased from their local water authority area: from 33 cents in Greater Urban Area South-East of Paphos and Greater Urban Area West of Lemesos going up to over105 cents in Nicosia Town and its suburbs.
As said earlier in this section, the observed regional differences in the price of water can be due to differences in the water pricing policies followed by the various water authorities, and the application of an increasing block tariff system resulting in large water users paying a higher average price than small water users. Looking at the &gures reported in Table1, it appears that regional differences in water pricing policies is more likely to the cause of the observed price differences. For instance, households is Lemesos and its suburbs consume, on average, between 40% and 70% more water per annum yet, on average, they pay around 60% less pcm of water than households in Nicosia Town and its suburbs.
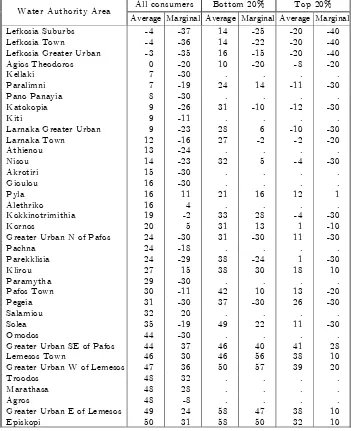
To consider the implications of the regional heterogeneity in water prices we have calculated the extent to which water consumption is subsidised. (or burdened) by the current water pricing system.4 More speci&cally, we have compared the amount paid by each household under the present water tariffsystem with the amount which the same household would pay for the same water consumption under a system of uniform price where all households in all water authorities were charged 70 cents pcm of water, i.e. the amount corresponding to the average cost of supplying one cubic meter of water for domestic consumption. The results of this calculation are given in Table 2.
4
The subsidy (or burden) associated with water consumption is calculated for each household as the difference between the average supply cost pcm of water (estimated by the WDD to be 70 pence pcm of water) times the quantity of water consumed, minus the water bill paid. The average subsidy is the total subsidy divided by the cubic meters of water consumed by the household; and themargi nal
Table 2: Subsidies by region and consumption level (cents)5
All consumers Bottom 20% Top 20% Water Authority Area
Average Marginal Average Marginal Average Marginal
Lefkosia Suburbs -4 -37 14 -25 -20 -40
Lefkosia Town -4 -36 14 -22 -20 -40
Lefkosia Greater Urban -3 -35 16 -15 -20 -40
Agios Theodoros 0 -20 10 -20 -8 -20
Kellaki 7 -30 . . . .
Paralimni 7 -19 24 14 -11 -30
Pano Panayia 8 -30 . . . .
Katokopia 9 -26 31 -10 -12 -30
Kiti 9 -11 . . . .
Larnaka Greater Urban 9 -23 28 6 -10 -30
Larnaka Town 12 -16 27 -2 -2 -20
Athienou 13 -24 . . . .
Nisou 14 -23 32 5 -4 -30
Akrotiri 15 -30 . . . .
Gioulou 16 -30 . . . .
Pyla 16 11 21 16 12 1
Alethriko 16 4 . . . .
Kokkinotrimithia 19 -2 33 28 -4 -30
Kornos 20 5 31 13 1 -10
Greater Urban N of Pafos 24 -30 31 -30 11 -30
Pachna 24 -18 . . . .
Parekklisia 24 -29 38 -24 1 -30
Klirou 27 15 38 30 18 10
Paramytha 29 -30 . . . .
Pafos Town 30 -11 42 10 13 -20
Pegeia 31 -30 37 -30 26 -30
Salamiou 32 20 . . . .
Solea 35 -19 49 22 11 -30
Omodos 44 -30 . . . .
Greater Urban SE of Pafos 44 37 46 40 41 28
Lemesos Town 46 30 46 56 38 10
Greater Urban W of Lemesos 47 36 50 57 39 20
Troodos 48 32 . . . .
Marathasa 48 28 . . . .
Agros 48 -8 . . . .
Greater Urban E of Lemesos 49 24 58 47 38 10
Episkopi 50 31 58 50 32 10
Looking at the &rst column, under the heading All consumers , we can see that,on the basis of the average price paid pcm of water, only households in the Lefkosia and its suburbs have annual water bills above what they would have had under the uniform (70 cents pcm of water) pricing policy. Furthermore, even in these few water authority where households would bene&t from a move to uniform water pricing, the gain is very small, around 4 cents pcm of water. In contrast, households in all other water authority
5A dot indicates that the number of obsrvations in the corresponding cell were less than 5 and no
areas would be worse off under the uniform pricing system, especially those living in water authority areas where the average price pcm of water is very low, e.g. the Lemesos and its suburbs and some Troodos mountain areas.
The picture, however, is completely different when we look at themarginal bene&t to households from switching to the uniform price policy. In this case under the uniform water pricing system households in most water authority areas would pay less for an extra cubic meter of water than the amount they pay under the current system. In some areas the gain derived from switching to the uniform price system is very high, 35-37 pcm of water for households living in Lefkosia and its suburbs. At the same time, however, even at high levels of water consumption, households living in Lemesos and its suburbs would loose from switching from the current to the uniform price system. This is seen more clearly in the columns under the heading Bottom 20% and Top 20% , showing the change in subsidy (or burden) which would result from switching from the current to a uniform price system for the 20% of households with the lowest and highest water consumption, respectively.
Assuming that the uniform price system considered here represents the true cost of supplying a cubic meter of water to households, the results above suggest that under the present water tariff system in Cyprus domestic water consumption in some water authorities (Lemesos and its suburbs in particular) is heavily subsidised. even in the case of the very large water users. In contrast, large users in other areas (especially in Nicosia and its suburbs) are heavily burdened by the current pricing system.
2.2
Price heterogeneity between income groups
minimum amount of water consumption is required for hygienic purposes, subsidising water up to a certain level can be justi&ed on efficiency grounds too.
[image:12.595.142.478.404.543.2]Table 3 shows the average annual consumption (cubic meters) and the average and marginal price paid pcm of water by households in different income groups. Water is a normal good, i.e. its level of consumption increases with income (second column in Table 3) and a necessity, i.e. its share in income decreases with income (third column in Table 3).6 The average price pcm of water increases as we move from lower to higher income groups, indicating that the current water pricing structure in Cyprus is progressive. For example, households in the lowest 10% of income distribution pay 42 cents whereas those at the top 10% of income distribution pay 59 cents pcm of water. Also progressive, albeit by a lower rate, is the marginal price pcm of water, rising from 70 cents for households in the lowest 10% of income distribution to 85 cents pcm of water for households in the top10% of income distribution.
Table 3: Consumption level and prices by income group
Income
group Consumption(Pounds) incomeShare in price (cents)Average price (cents)Marginal
0%-10% 81 1.6% 42 70 11%-25% 95 0.9% 47 76 26%-50% 110 0.6% 50 79 51%-75% 116 0.4% 54 82 76%-90% 123 0.3% 54 83 Top 10% 130 0.2% 59 85
It follows from the points above that making the same assumption about water tariff
reform as in the previous subsection (i.e. switching from the regionally heterogeneous increasing block pricing system to a homogeneous one where everyone pays a ! at rate of 70 cents pcm of water) will not be advantageous to the low income households. The effects of this water price reform on households grouped by income are shown in Diagram 3.
6
On average, households in all income groups would end up paying more for their current water consumption if the existing increasing block pricing system is replaced by a uniform pricing system. Again, assuming that the uniform price system considered here represents the true cost of supplying a cubic meter of water to households, this means that the water consumption of all income groups is subsidised. The largest subsidy (28 cents pcm of water) is enjoyed by households in the lowest 10% and the smallest (11
cents) by the top 10% of income distribution.
The picture, again, is very different in the case of themarginal bene&ts from switch-ing to a uniform pricswitch-ing system: all income groups would pay either the same (lowest income group) or less (all other income groups) for an additional cubic meter of water consumption under the uniform price system compared to the existing system. This means that marginal water consumption is not subsidised for any income group under the existing water tariff system. Those at the lowest 10% of income distribution, on average, purchase their last cubic meter of water at supply cost (70 cents pcm). As we move up the income scale households pay more for their marginal water consumption, with those in the top10% of income distribution paying 15 cents pcm of water above the supply cost.
Diagram 3: Average and marginal subsidy by income group
-20 -15 -10 -5 0 5 10 15 20 25 30
0% -10% 11% -25% 26% -50% 51% -75% 76% -90% Top 10%
The tables and diagrams above compare the current consumption and increasing block tariff system with the hypothetical uniform pricing system on the assumption that water demand for domestic use is the same under the two price regimes. This assumption however is not realistic because household demand for water is likely to change in opposite direction to the change in price. The extent to which this will happen is determined by the price elasticity. In the next section we consider consumer demand for water in the context of a theoretical model satisfying the fundamental principles of consumer theory. This enables us to not only estimate the price elasticity of demand for water in a theoretically consistent manner but also integrate this demand back to the underlying cost and (indirect) utility functions to evaluate the welfare implications of the two price regimes.
3
Modelling tari
ff
e
ff
ects on consumer demand and welfare
We assume that preferences over goods are separable from leisure and public goods and can be expressed in terms of the Quadratic Logarithmic cost function (Lewbel1990)
lnC(p, uh) =a(p) + b(
p)uh
1−g(p)uh
, (1)
where uh is the utility of the hth household (consumer) and p the vector of market
prices of goods (p1, p2, ...., pI). Also a(p), b(p)and g(p) are linearly independent and
homogeneous functions the parameters of which can be allowed to vary with observable household characteristics (family size and composition, the education and occupation of household members etc) as shown in the empirical analysis described the next section.
The three price indices in (1) are assumed to have the Quadratic Almost Ideal Demand System (QUAIDS) form proposed by Banks, Blundell and Lewbel (1997),
a(p) = ao+Σiailnpi+.5ΣiΣjγijlnpjlnpi,
b(p) = Πipβii, (2)
g(p) = Σiλilnpi,
yielding Marshallian demands in budget shares form,
wih=ai+Σjγijlnpj+βi[lnyh−a(p)] + λi
Πip
βi
i
where yh is the budget of the hthhousehold.7 The parameters obey the restrictions:
Σiai = 1,Σiβi=Σiλi = 0andΣiγij = 0for adding-up;Σjγij= 0for homogeneity; and γij =γji for symmetry.
Here we concentrate on consumer demand for a single commodity, water for domestic use, and assume that all other goods can be grouped in a Hicksian composite good. Therefore, the ith subscript is dropped for convenience so that the QUAIDS budget
share of water is written,
whr =a+γln(p/P) +βlnYh+ λ
P(p/P)β (lnYh)
2, (4)
whereP is the price (index) summarising the cost of all the goods other than water and
lnYh =lnyh−ao−.5γln(p/P)2−lnP−aln(p/P).
We de&ne the market price of water aspr=p∗srwherep∗is the producer s price, the
subscriptr= 1, ..., Rdenotes the water tariffarea andsr = (1 +tr),where−1< tr<0
is the tax paid and 0< tr <1 the subsidy received by consumers in the rth tariff area
as proportion of the producer s price. When the latter and the prices of all goods other than water for domestic consumption are &xed we may normalise topr =sr and P = 1
so that the (4) becomes
whr = a+γlnsr+β
h
lnxhr−alnsr−.5γ(lns)2r
i
+λ
sβr
h
lnxh−alnsr−.5γ(lnsr)2
i2
, (5)
where lnxh is consumer expenditure measured from some minimum ao.8 The variable
srin (5) is a price index re! ecting the tax paid (ifsr>1)or subsidy received (ifsr<1)
by the consumer.
Knowledge of the parameters in (5) enable one to consider the implications of al-ternative water pricing policies on consumer behaviour and welfare. The behavioural
7The QUAIDS demand system belongs to the family of Rank-3 demand systems, the most general
empirical representation of consumer preferences that satis&es integrability (Gorman1980 and Lewbell
1991). In the context of our analysis integrability is vital for considering the welfare implications of alternative water pricing policies.
8The parametera
ois difficult to identify in empirical application and is set at a value corresponding
effects can be summarised by the budget elasticity
1
whr
µ
β+2λ
sβr
h
lnxh−alnsr−.5γ(lns)2hr
i
+ 1 (6)
and the (compensated) elasticity with respect tosr
1 whr
γ−β(a−γlns) +2λ
sr (a−
γlns)hlnxh−alnsr−.5γ(lns)2hr
i
− λ
sβr+ 1
h
lnxh−alnsr−.5γ(lns)2hr
i2 − 1 (7)
of consumer demand for water. Evaluated at sr = 1 the budget and tax (or subsidy)
elasticity formulas simplify to
(1/whr) (β+ 2λlnxh) + 1 (8)
and (1/whr) [γ−βa−(2λa+λβ)lnxh]−1, (9)
respectively. The parameters estimates required for the evaluation of these elasticities are obtained from &tting the water demand equation (5) to the data.
The effects of alternative water pricing policies on consumer welfare can be evalu-ated using the indirect utility function corresponding to the quadratic logarithmic cost function (1)
V(xh,p) =
lnxh−a(p)
g(p) [lnxh−a(p)] +b(p)
. (10)
For thehth household to obtain the same utility level under the reference price vector
p∗ and some other price regimep, the following equality must hold,
lnxh−a(p)
g(p) [lnxh−a(p)] +b(p)
= lnx
∗
h−a(p∗)
g(p∗)£lnx∗
h−a(p∗)
¤
+b(p∗), (11)
where lnx∗
h is the household expenditure under the reference price regime. At p∗ = 1
(11) can be written as the logexpenditure index
lnXh≡ln
µ
xh
x∗
h
=a(p) + [b(p)−1]lnx
∗
h
1−lnx∗
hg(p)
, (12)
showing the change in log expenditure required by the household facing prices p to obtain the same level of utility as at reference pricesp∗. Assumingp are the increasing
block tariffandp∗ the uniform price system,lnXhcan be interpreted as the consumer s
Given the functional form of the QUAIDS demand system and the assumption that goods other than water can be grouped as one composite item, at p∗
i = 1 all i, (12)
becomes
lnXhr= (a+.5γlnsr)lnsr+
³
sβr −1
´
lnx∗
h
1−lnx∗
hλlnsr
(13)
and, like the budget and tax (or subsidy) elasticity, can be computed for each household in the sample using the parameter estimates obtained from &tting the water demand equation (5) to the data as described in the next section. The only difficulty here is that the expenditure index depends onlnx∗
h, a well known problem in the consumer welfare
literature arising from the dependence of the expenditure index on the base utility level. In the empirical analysis below we compute the expenditure index at x∗
h = 1. This is
equivalent to evaluating the cost of the price change at subsistence utility level, in which casewhr =a+γlnsr and (5) can be written as
lnXhr= (whr−.5γlnsr)lnsr. (14)
Furthermore we compute the deadweight loss index associated with a change in the price regime. We de&ned this index as the change in (indirect) log utility caused by a change in price regime with total expenditure remaining at its base period level,
lnWh=
ln[x∗
h(p)]−a(p)
g(p)£lnx∗
h(p)−a(p)
¤
+b(p)−
lnx∗
h−a(p∗)
g(p∗)£lnx∗
h−a(p∗)
¤
+b(p∗), (15)
where, usingqih to denote quantities,
ln[x∗
h(p)] =ln(Σiqih∗ pi) =ln[x∗hΣiw∗ih(pi/p∗i)]'lnx∗h+Σiw∗ihln(pi/p∗i)
is the expenditure in the base period spent under the current price regime.
Normalising at x∗
h = 1 and p∗i = 1 all i, and using the same assumptions as before
(i.e. the functional form of the QUAIDS demand system with goods other than water grouped as one composite item),
lnWh =
w∗
hrlnsr−(a+.5γlnsr)lnsr λlnsr
£
w∗
hrlnsr−(a+.5γlnsr)lnsr
¤
+sβr
= −.5γ(lnsr)
2
−.5γλ(lnsr)3+sβr
(16)
This effectively re! ects the substitution effect caused by changes in relative prices, as de&ned by −.5γ(lnsr)2 in (16); the denominator simply adjusts this effect to account
4
Empirical analysis
The analysis in the previous section ignores two fundamental issues pertaining to empirical application based on individual household data: (i) demand for water is af-fected not just by the consumer s budget and prices but also by many demographic, housing and other characteristics and (ii) under increasing block pricing the subsidy (or burden) depends on the amount of water used by the individual household.
We take account of household heterogeneity by allowing the intercept in the demand for water equation (5) to depend on a large number of characteristics drawn from the FES1996/97 and found to affect consumer behaviour in other consumer demand studies based on individual household data (e.g. Blundell, Pashardes and Weber1993). These household characteristics are shown in Table A2 in the Appendix.
The dependence of tax/subsidy on the amount of water used is accounted for by replacing sr in (5), calculated on the basis of the actual quantity of water used (as
explained in Section 2) with bshr, its value corresponding to the predicted quantity of
water used.The latter is obtained from the reduced form equation,
qhr=εo+ΣmεmZmhr+vhr (17)
where Zmhr is the mth exogenous variable corresponding to the hth household in the
rthregion andv
hr a random error. Among theZ, sare all the household characteristics
and other variables included in the demand for water equation below (except sr) plus
dummies for the water tariffarea, capturing differences in unit cost and other differences in water consumption between water tariffareas in the island. The full list of variables included in (17) is reported in Table A3 in the Appendix. The same table also reports the parameter estimates and diagnostic statistics obtained from &tting (17) to data.
Incorporating in (5) the modi&cations required to account for household heterogene-ity and increasing block pricing (i.e. the endogeneheterogene-ity ofsr) we obtain
whr = a+Σkδklnzkh+β
h
lnxh−(a+Σkδklnzkh)lnbshr−.5γ(lnbs)2hr
i
(18)
+γlnbshr+ λ
b
sβhr
h
lnxh−(a+Σkδklnzkh)lnsbhr−.5γ(lnbs)2hr
i2
+uhr,
dependent variable is de&ned as the share of water in household expenditure on non-durable goods.
The parameters in (18), estimated by Maximum Likelihood, are reported together with their standard errors (and some system diagnostic statistics) in Table A2 in the Appendix. The price and budget (income) elasticities corresponding to these parameter estimates have been calculated for each household in the sample using the formulas (8) and (9) in Section 3. The elasticities, grouped by household income, are shown in Table 4.
As one would expect, water appears to be a necessity, with a budget elasticity ranging between 0.25 for the lowest income group to 0.48 for the highest income group. The increasing budget elasticity with income, suggesting that water is more of a necessity to households with lower rather than higher income, is a puzzle to us. A possible explanation of this phenomenon can be the fact that water is a complement to large houses with lawned gardens, swimming pools, jacuzzis and other luxury goods purchased by the rich.9 Another possible explanation for the increase in budget elasticity with
income is the fact that under the current increasing block tariffsystem rich people tend to be large water users and pay more for a given quantity of water. Therefore a given proportional change in their demand means more to them in terms of income than the same proportional change in the consumption of low income households. The average budget elasticity of demand for water for the population as a whole is 0.32.
Table 4: Price and budget elasticities by income group
Income group
Elasticity
0%-10%
11%-25%
26%-50%
51%-75%
75%-90%
Top
10%
Budget 0.25 0.22 0.23 0.30 0.35 0.48
Price -0.79 -0.69 -0.60 -0.56 -0.50 -0.39
9As seen in Table A2 in the Appendix, although we conditon demand for water on certain durable
[image:19.595.104.471.544.657.2]The price elasticity of demand for water declines with income: it starts from -0.79 for the worse offand decreases (in absolute size) to -0.39 for the better offhouseholds. This means that low income households are more sensitive to changes in the price of water than high income households. One possible reason for this result is that, as said earlier, high income households tend to consume water in conjunction with expensive durables goods; therefore, their demand is less responsive to water price changes.
One could point to the decline in the price elasticity of demand for water as income increases, as evidence against the argument in favour of using price as a water demand management tool. At the same time, however, the same argument is strengthened by the empirical evidence here, in the sense that the price elasticities of demand for water reported in Table 4 are probably among the highest ever estimated.
Turning to the welfare effects we calculate the expenditure index (14) and the dead-weight loss index (16) by region and income group, by comparing the present water price system with the uniform price one. Furthermore, we express the results in Cyprus pounds per annum (in1997 prices) to show (i) in the case of the expenditure index the amount the various household groups are willing to pay (be paid) to accept a switch from the current to the uniform price system and (ii) in the case of the deadweight loss index the loss in pounds due the price distortion created by the regional variation and the increasing block tariffsystem.
The results of these calculations are shown in Diagrams 4 and 5. Commending &rst on the results by region (Diagram 4)10, as one would expect from the analysis in Section
2, those willing to pay the highest amount, households living in the Greater Urban area SE of Pafos, Lemesos and its suburbs are the most willing to pay (up to 47 Cyprus pounds) to avoid a change from the current to the uniform pricing system. Notably, the Greater Urban area SE of Pafos fares badly here due to the large price subsidies maintained at high levels of water consumption in this water authority area. In contrast households in Nicosia and its suburbs and in Larnaca are the most willing to pay (up to 33 Cyprus pounds) for the replacement of the current increasing bloc tariffwith a uniform water pricing system.
10
Diagram 4: Welfare effects by region (in Cyprus pounds p.a.)
-50 -40 -30 -20 -10 0 10 20 30 40
Athienou Lefkosia Town Lefkosia Gr Urb Lefkosia Suburbs Larnaka Gr Urb Agios Theodoros Katokopia Kellaki Paralimni Nisou Akrotiri Pachna Solea Parekklisia Kiti Larnaka Town Pano Panayia Gioulou Greater Urb N of Pafos Pyla Greater Urb E of Lemesos Episkopi Greater Urb W of Lemesos Lemesos Town Greater Urb SE of Pafos
Expenditure effects Deadweight loss
deadweight loss here one can say that it re! ects the amount households would be able to forgo if hey were able to replace the water subsidy with a cash payment. It therefore shows the waste associated with the current pricing system.
Diagram 5: Welfare effects by income (in Cyprus pounds p.a.)
-4 -2 0 2 4 6 8 10 12 14 16 18
0% -10% 11% -25% 26% -50% 51% -75% 75% -90% T op 10%
Expenditure effect Deadweight loss
The welfare effects by income in Diagram 5 show that all household groups, on average, would be willing to pay to move to the uniform water pricing system except those in the lowest income group which would pay to avoid such a move. Furthermore, given the inherent progressivity of the current increasing block pricing system, the amount households would be willing to pay for a change from the current to the uniform pricing system increases with income, up to16 Cyprus pounds p.a for those in the top
5
Conclusions
In this paper we investigate the effects of switching from the current regionally het-erogeneous increasing block water pricing system to a regionally homogeneous uniform pricing one. We &nd that the current system is progressive but inefficient in the sense that it introduces gross price distortions resulting in deadweight loss. The regional differences, in particular, introduce a substantial price heterogeneity that cannot be justi&ed on the basis of efficiency or equity criteria. It cannot be justi&ed on efficiency grounds because it is difficult to imagine that in a small island like Cyprus such large regional differences in price can re! ect differences in supply costs. The regional price heterogeneity cannot also be justi&ed on equity grounds because we found that users of large quantities of water pay substantially less per cubic meter of water than users consuming much smaller amounts of water.
Our empirical analysis suggests that the price elasticity of demand for water ranges between -.4 for households in the lowest and -.8 for households in the highest 10% of income distribution. This means that, in the case of residential water use, price can play a role in the context of a demand management scheme designed to tackle the growing fresh water problems in Cyprus. Such an approach, however, should take into account the distributional impact of alternative price regimes. Any major water price reform is bound to have effects on the welfare of individual consumers. In other words there will be winners and losers, and therefore there will also be a need to consider how to deal with potential hardship caused by the water price reform.
References
Banks J., Blundell R. and Lewbel A., 1997, Quadratic Engel Curves and Consumer Demand,Review of Economics and Statistics, 4,527-539.
Blundell, R., Pashardes, P., and Weber, G., 1993, What do we Learn about Consumer Demand Patterns from Micro-data, American Economic Review,83, 570-597.
Billings, B., 1982. Speci&cation of block rate price variables in demand models. Land Economics, 58(3), 386-393.
Chicoine, D. and Ramamurthy, G.,1986. Evidence on the speci&cation of price in the study of domestic water demand. Land Economics, 62(1), 26-32.
Dinar, A., 2000, The political economy of water pricing reforms, in Dinar A (ed) The political economy of water pricing reforms, Oxford University Press.
Dandy, G., Nguyen, T. and Davies, C., 1997. Estimating residential water demand in the presence of free allowances. Land Economics, 73(1), 125-139.
Foster, H. S. Jr., and Beattie B., 1979. Urban residential demand for water in the United States. Land Economics, 55 (Feb.), 43-58.
Foster and Beattie, 1981a. Urban residential demand for water in the United States: Reply. Land Economics, 57 (May), 257-265.
Foster and Beattie,1981b. On the speci&cation of price in studies of consumer demand under block price scheduling. Land Economics, 57 (Nov.), 624-29.
Gibbons, D. C., 1986. The economic value of water. Washington, DC, Resources for the Future.
Gorman, T., 1981, Some Engel curves, in Essays in the Theory and Measurement of Consumer Behaviour in Honor of Richard Stone, ed. A. Deaton, Cambridge University Press.
Gottlieb, M., 1963. Urban domestic demand for water: A Kansas case study. Land Economics, 39 (May): 204-210.
Hanke, S., and de Maré, L., 1982. Residential water demand: a pooled time series cross-section study of Malmö, Sweden. Water Resources Bulletin,18(4), 621-625. Hansen, L.,1996. Water and energy price impacts on residential water demand. Cope-naghen. Land Economics, 72(1), 66-79.
Herrington, P. R.,1987. Pricing of water services. OECD Publication.
Höglund, L., 1999. Household demand for water in Sweden with implications of a potential tax on water use. Water Resources Research, 35(12), 3853-3863.
Lewbel, A., 1990, Full Rank Demand Systems, I nternational Economic Review, 31, 289-300.
Lewbel, A., 1991, The Rank of Demand Systems: Theory and Nonparametric Estima-tion,Econometrica, 59, 711-730.
Martinez-Espieneira, 2000. Residential water demand in the Northwest of Spain. Paper presented in the10th annual conference of the European Association of Environmental and Resource Economists (EAERE 2000).
negotiation, and estimation of residential water demand: The case of France. Forth-coming in Land Economics, 76(1).
Nieswiadomy, M., and Cobb, S.,1993. Impact of pricing structure selectivity on urban water demand. Contemporary Policy I ssues,11(6), 101-113.
Nieswiadomy, M. L., and Molina, D. G., 1989. comparing residential water estimates under decreasing and increasing block rates using household data.
Nordin, J., 1976. A proposed modi&cation on Taylor s demand supply analysis: com-ment. Bell Journal of Economic Management and Science, 7(2), 719-721.
OECD, 1987. Pricing of water services, organization of economic co-operation and development, Paris.
Renwick, M., and Archibald, S.,1998. Demand side management policies for residential water use: Who bears the conservation burden? Land Economics, 74(3), 343-359. Schefter, J., and David, E., 1985. Estimating residential water demand under multi-tariffs using aggregate data. Land Economics, 61(3), 272-80.
Taylor, L. D.,1975. The demand elasticity a survey. The Bell Journal of Economics, 6 (Spring), 74-110.