Comparison of ANN Controller and PID Controller for
Industrial Water Bath Temperature Control System using
MATLAB Environment
Yuvraj V. Parkale
Department of Electronics and Telecommunication College of Engineering, Malegaon (Bk)
Maharashtra, India
ABSTRACT
Artificial Neural Network is an effective tool for highly nonlinear system. With the advent of high-speed computer system, there is more increased interest in the study of non-linear system. Neuro control algorithm is mostly implemented for the application to robotic systems and also some development has occurred in process control systems. Process Control systems are often nonlinear and difficult to control accurately. Their dynamic models are more difficult to derive than those used in aerospace or robotic control, and they tend to change in an unpredictable way. This paper gives an example where a multilayered feed forward back propagation neural network is trained offline to perform as a controller for a temperature control system with no a priori knowledge regarding its dynamics. The inverse dynamics model is developed by applying a variety of input vectors to the neural network. The performance of neural network based on these input vectors is observed by configuring it directly to control the process. In this paper, we have compared the performance of PID controller with ANN [1] based upon Set point change, Effect of load disturbances and Processes with variable dead time. The result shows that ANN outperforms the PID controller.
Keywords
Artificial Neural Network (ANN); PID controller
1. INTRODUCTION
An Artificial Neural Network (ANN) is an information processing paradigm that is inspired by the way biological nervous systems, such as the brain, process information. The key element of this paradigm is the novel structure of the information processing system. It is composed of large number of highly interconnected processing elements (neurons) working in unison to solve specific problems. ANNs, like peoples, learning by examples. An ANN is configured for a specific application, such as pattern recognition or data classification, through a learning process. Learning in biological systems involves adjustment to the synaptic connections that exist between the neurons. This is true ANN as well. It offers very large capabilities concerning complex system modeling, prediction, control and performance [2, 3, 4].
PID control systems are widely used as a basic control technology for industrial control systems today [5, 6], due to its well-known simple PID control structure. However, the tuning of the PID control systems is not always easy, because of its simple control structure for wide class of process characteristics. While they are applicable to many control
problems, they can perform poorly in some applications. Highly nonlinear system control with constrained manipulated variable can be mentioned as an example.
Following are the limitations of the PID controller.
PID has the overshoot and undershoots in the output of temperature controlled system.
PID gives late response and takes less number of iterations for derived period of time.
PID not stables over the entire controlling process, it deviates the output slightly.
It has to be retuned if the load disturbances occur. It has poor recovery rate.
PID controllers are widely used in industry these days due to their useful properties such as simple tuning or robustness. The point is to string together convenient qualities of conventional PID control and progressive techniques based on Artificial Intelligence. Proposed control method should deal with even highly nonlinear systems [7]. Historically, research in ANNs was inspired by the desire to produce artificial systems capable of sophisticated ‘intelligent’ processing similar to human brain. The science of ANN made its first significant appearance in 1943 when Warren McCulloch and Walter Pitts published their study in this field.
Neuro-control originated as a special branch of adaptive control. Originally, neural networks were employed as adaptive control agents to model the dynamics of a plant. However, neural networks are much broader than the specific modes of traditional adaptive control and their use quickly spread to other aspects of control theory.
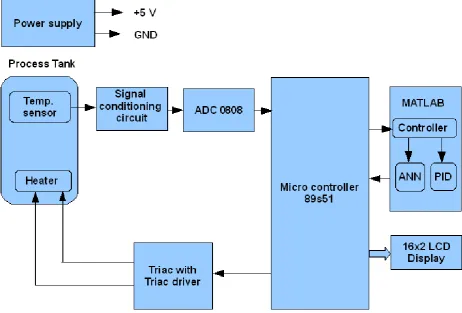
2. SYSTEM BLOCK DIAGRAM
Figure 1 shows the system block diagram. It consists of following main blocks: Microcontroller 89c51, process, Temperature system, Signal conditioning circuit, ADC0808, TRIAC, Computer and LCD display.
2.1 Process Tank
Mainly the process is a tank- heater system with single feed stream and single output stream.
2.2 Temperature Sensor
within a narrow range of temperatures; certain chemical reactions, biological processes, and even electronic circuits perform best within limited temperature ranges. When these processes need to be optimized, control systems that keep temperatures within specified limits are often used.
[image:2.595.75.538.143.456.2]Temperature sensors provide inputs to those control systems.As we are dealing with neural network to control the temperature, thermistor is selected as a temperature sensor. Thermistor output is highly nonlinear so that neural network will be effectively proved.
Figure 1. Block diagram of system
2.3 Signal Conditioning Circuit (LM358)
The output of temperature sensor has to be modified so that it becomes usable and satisfactory to drive next stage i.e. ADC 0808.
2.4 ADC0808
The analog output from the signal conditioning block needs to be converted to digital form so that it can be given to the microcontroller. This is done by using an ADC0808.
2.5 Microcontroller (89S51)
It is heart of the system which controls all necessary actions. Microcontroller measures the temperature from water tank and send to PC. Also it controls the heater actions.
2.6 PC
In PC, algorithm of PID and ANN is written in MATLAB. Here comparison between the outputs of PID and ANN is done [8]. The output of PC is then given to microcontroller which generates Pulse Width Modulation (PWM) to control heater actions.
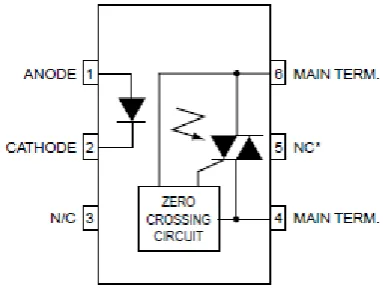
2.7 Opt isolators triac driver output
The opt isolator is an integrated circuit that is specifically design to connect low voltage DC controls to high voltage AC triac. The opto in the triac output board is a 6 pin chip, but only 4 pins are used: 2 for the DC in and 2 for the AC out.
Internally opto has three major sections: a LED input, a zero crossing detector and a triac driver output.
LED input: Pin1 anode is a high side, which is connected to a pull up resistor, which is in turn connected to a DC supply voltage. Pin 2 cathode is a low side, which acts as DC control. Ground this pin, the LED turns on.
Figure 2. Circuit diagram of opto triac driver
Triac driver output: This is essentially a mini-triac that switches AC on/off, with a little power, enough to trigger a triac.
2.8 Triac (BTA12)
The triac is a three-terminal device similar in construction and operation to the SCR.
Figure 3. Triac
The triac controls and conducts current flow during both alternations of an ac cycle, instead of only one. A triac is a bilateral switch that can be triggered into conduction regardless of its polarity. It is modeled by using two NPN/PNP transistors pairs connected back to back.
2.9 LCD display
16x2 LCD display is used to display set point temperature values and measured temperature values from water tank.
3.
WORKING OF SYSTEM MODEL
The process considered here is one of the most widely used processes in the process industry, a water bath temperature control system. The water bath is heated and measured temperature is given to Artificial Neural Network controller and PID controller. Desired temperature is provided to both controllers for comparison with measured temperature. Depending on magnitude of error, PWM signal is generated using microcontroller.
As PWM changes, the ratio ON-time to OFF-time is varied. This is continued till the desired temperature is achieved. Based on the observations, the neural network that gives the
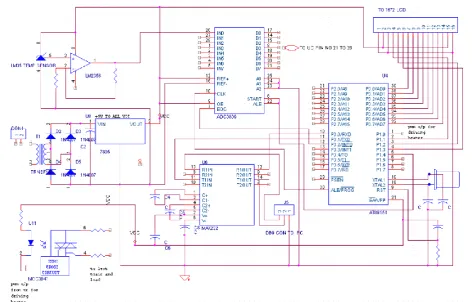
best performance is then compared to a conventional feedback controller, namely, a proportional-plus-integral-plus derivative controller (PID), in controlling the same process. Direct output comparisons are made with respect to set-point changes, effect of load disturbances, and variable dead time. The comparison shows that ANN controller out-performs PID in the extreme range of non-linearity. Figure 5 shows the circuit diagram of system model.
[image:3.595.311.523.174.537.2]4.
SYSTEM FLOWCHART
Figure 4 shows the system flowchart.
Figure 4. Shows the system flowchart.
4.1 Algorithm for the Artificial Neural
Network
1. Display “BEGIN”.
2. Create serial port object (ser)
3. Configure serial port object (ser) properties like baud rate, data bits, stop bits, parity and flow control.
4. Connect interface object (ser) to the instrument (microcontroller) for a read or write operation.
5. Train the Artificial Neural Network.
[image:3.595.122.215.354.434.2]Figure 5. Circuit diagram of system model
7. The maximum number of values to read is specified by size (here 1).
8. Create an array save the value read from the microcontroller.
9. Calculate an error using formula given be1ow
(1) Where, S.P. = Set point
PV= Process Variable (Here temperature t) 10. Simulate the neural network formed at the time of
training nine and return the Outputs to a variable K. 11. Convert the array K that contains positive integers
representing character codes into a MATLAB character array (the first 127 codes are ASCII) and re output value to a variable n.
12. Add to variable n a number 48 to convert it into ASCII. (Ranging from 48 for 0 to a 58 for 10) and return the output value to a variable m.
13. Conditionally execute the following statements using expressions in if else loop.
If m = = 58, write ‘A’ to a microcontroller Else write m to a microcontroller. 14. End if else loop and for loop.
15. Divide the figure into an m by n matrix of rectangular planes.
16. Plot columns of the variables t, e, P, m versus their index i.
17. Display the number of bytes available in the input buffer. 18. Remove data from the input buffer.
19. Disconnect a serial port object (Ser) from the device (microcontroller).
20. Display “STOP”.
4.2 Algorithm for PID controller
1. Display “BEGIN”.
2. Create serial port object (ser).Configure serial port object (ser) properties like baud rate, data bits, stop bits, parity and flow control.
3. Connect interface object (ser) to the instrument (microcontroller) for a read or write operation.
4. Set the constants for first two iterations as integral (in) =0 and derivative (d) =0.
5. Read binary data from the device connected to object (ser), and return the data to a variable’s. The maximum number of values to read is specified by size (here 1). 6. Create an array save the value read from the
microcontroller.
7. Calculate an error using formula given be1ow
(2)
Where, S.P. = Set point
PV= Process Variable (Here temperature t) 8. Conditionally execute the following statement using
expressions in if else loop
9. If i > 2 then only calculate integral and derivative term.
(3)
(4)
Where, in= integral term d= derivative term And End if loop.
10. Calculate output of PID controller using following equation
(5)
return the value to variable bb. Multiply each element in array bb with 10 and return the output to ans.
12. Convert the array (ans) that contains positive integer representing character codes into a MATLAB character array (the first 127 codes are ASCII) and re output value to a variable n.
13. Add to variable n a number 48 to convert it into ASCII. (Ranging from 48 for 0 to a 58 for 10) and return the output value to a variable m.
14. Conditionally execute the following statements using expressions in if else loop.
If m = = 58, write ‘A’ to a microcontroller Else write m to a microcontroller. 15. End if else loop and for loop.
16. Divide the figure into an m by n matrix of rectangular planes.
17. Plot columns of the variables t, e, P, m versus their index i and plot PK.
18. Display the number of bytes available in the input buffer. 19. Remove data from the input buffer.
20. Disconnect a serial port object (Ser) from the device (microcontroller).
21. Display “STOP”.
5.
RESULT
[image:5.595.315.539.45.659.2]Table 1. Shows the comparison of PID controller and AAN controller.
Figure 5. Ideal result of PID controller for (i) Temperature (t) Vs Time (ii) Error (e) Vs Time
[image:5.595.322.541.71.177.2]Table 1. Comparison of PID controller & AAN controller.
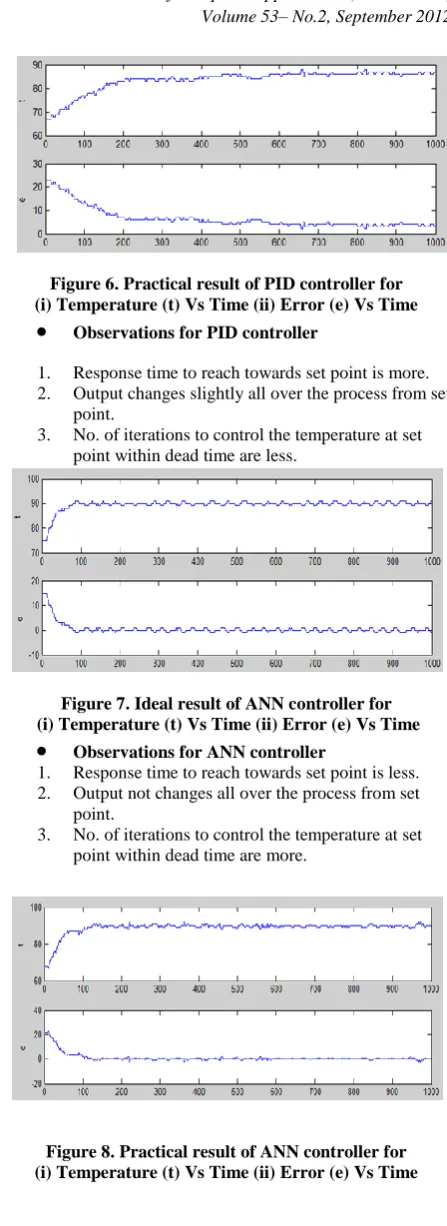
Figure 6. Practical result of PID controller for (i) Temperature (t) Vs Time (ii) Error (e) Vs Time
Observations for PID controller1. Response time to reach towards set point is more. 2. Output changes slightly all over the process from set
point.
3. No. of iterations to control the temperature at set point within dead time are less.
Figure 7. Ideal result of ANN controller for (i) Temperature (t) Vs Time (ii) Error (e) Vs Time
Observations for ANN controller1. Response time to reach towards set point is less. 2. Output not changes all over the process from set
point.
[image:5.595.55.272.375.494.2]3. No. of iterations to control the temperature at set point within dead time are more.
Figure 8. Practical result of ANN controller for (i) Temperature (t) Vs Time (ii) Error (e) Vs Time
6. CONCLUSION
ANN is studied along with it various network topologies and learning rules. We have used feed-forward back propagation network in our system. A neural network controller has implemented on a real time temperature control system without the use of knowledge regarding its dynamics. The resolution of the system is 0.5C. The self learning ability based on its input vector has been observed.
Features PID ANN
Set point change
No generalization property
has to be returned and depend upon open loop response
very good generalization property need to be
trained only once Effect of
load disturbances
poor rate of recovery has to be returned
very fast recovery adapts quickly to
changes in inputs Processes
with variable dead time
No improvements with time as output oscillates adversely
[image:5.595.48.282.536.710.2]The performance of neural network controller with the PID controller is compared to evaluate the system performance. We conclude that the ANN Controller totally overcomes the following disadvantages of PID Controller like Set Point Changes, Effect of load disturbances, Processes with variable Dead Time.
REFERENCES
[1]
Liu He, Nie Ling ; Huang Huanpao,“ Superheated Steam Temperature Control Based on Active Disturbance Rejection Control & Neural Network”, Asia-Pacific Power and Energy Engineering Conference (APPEEC), 2010
[2] M. Azizur Rahman, Fellow, IEEE, and M. Ashraful Hoque, “On-Line Self-Tuning ANN-Based Speed Control of a PM DC Motor”, IEEE/ASME Transactions On Mechatronics, Vol. 2, No. 3, September 1997
[3] Aleksandar M. Stankovi C and Andrija T. Sari6, “An Integrative Approach to Transient Power System Analysis with Standard and ANN-Based Dynamic Models”, 2003 IEEE Bologna PowerTech Conference, June 23-26, Bologna, Italy
[4] Pravat K.Singh and Pankaj Rai, “An ANN Based X-PC Target Controller for Speed Control of Permanent
Magnet Brushless DC Motor”, Proceedings of the 2005 IEEE Conference on Control Applications Toronto, Canada, August 28-31, 2005
[5] Noor Hayatee Abdul Hamid, Mahanijah Md Kamal and Faieza Hanum Yahaya, “Application of PID Controller in Controlling Refrigerator Temperature”.
[6] Daogang Peng, Hao Zhang, Conghua Huang, Fei Xia, Hui Li , “Immune PID cascade control based on neural network for main steam temperature system”, Intelligent Control and Automation (WCICA), 2011 9th World Congress, 21-25 June 2011
[7] Nazaruddin, Y.Y.; Aziz, A.N.; Priatna, O., “ Improving performance of PID controller using artificial neural network for disturbance rejection of high pressure steam temperature control in industrial boiler”, International Conference on Control, Automation and Systems, 2008.
[8] U. Yolac T. Yalcinoz, “Comparison Of Fuzzy Logic