http://dx.doi.org/10.4236/as.2015.65050
How to cite this paper: Islam, A.F.M.S., Islam, M.M. and Hasan, M.M. (2015) Effect of Gamma Irradiation Doses on Mor-phological and Biochemical Attributes of Grape Saplings. Agricultural Sciences, 6, 505-512.
http://dx.doi.org/10.4236/as.2015.65050
Effect of Gamma Irradiation Doses on
Morphological and Biochemical
Attributes of Grape Saplings
A. F. M. Saiful Islam
*, M. Muzahedul Islam, Md. Mehedi Hasan
Department of Crop Botany & Tea Production Technology, Sylhet Agricultural University, Sylhet, Bangladesh Email: *[email protected]
Received 26 March 2015; accepted 21 May 2015; published 27 May 2015
Copyright © 2015 by authors and Scientific Research Publishing Inc.
This work is licensed under the Creative Commons Attribution International License (CC BY).
http://creativecommons.org/licenses/by/4.0/
Abstract
The demand of grape in Bangladesh is fulfilled through import from foreign countries. The fruits of local cultivars of grapes are sour and seeded. Development of seedless grape varieties having increased sweetness, higher yield with better nutritional quality is necessary to reduce the import dependency. The present research activities are the part of a grape improvement project. A pot experiment was conducted at the Bangladesh Institute of Nuclear Agriculture (BINA), Mymensingh, during June to November 2011 to determine the suitable gamma irradiation doses on growth, leaf area and biochemical characters of grape saplings. Three vegetative bud stages viz. bud initiation stage, 4-leaf stage and 8-leaf stage, and four doses of gamma irradiation viz. 0, 5, 10, and 15 Gy were used as treatments. The experiment was laid out in a Randomized Complete Block Design with four replications. Different irradiation doses and vegetative bud stages showed significant variations in respect of plant growth characters, leaf area, soluble protein and total sugar content. Interaction effects also had significant variations on most of the parameters studied. Higher doses of gamma irradiation had showed detrimental effect on grape saplings. Generally, increased in ir-radiation doses showed decreased and detrimental effects on most of the parameters under study. Maximum numbers and length of roots, total dry matter, leaf area and chlorophyll-a and chloro-phyll-b content were found at 5 Gy irradiation dose. Total soluble protein and sugar content of leaf were found maximum at no irradiation and 15 Gy, respectively. Higher number of roots and length, total dry matter, leaf area, chlorophyll-a, and b and soluble protein content of leaf were observed at bud initiation stage while 8-leaf stage showed maximum total sugar of leaf. In the combined ef-fect of gamma irradiation and vegetative bud stages, all parameters showed best results in 5 Gy with bud initiation stage except total sugar content of leaf.
Keywords
Protein
1. Introduction
Grape (Vitis vinifera L.) belongs to the family Vitaceae distributed widely all over the world [1] and originated in West Asia [2]. Grape occupies the first position among the fruits in the world in terms of area and production [3]. The world area occupied by grape is 7.63 million hectares producing 64.29 million tons per annum [4]. But in Bangladesh, the requirement of grape was fulfilled through the import from other countries using hard earned foreign currencies as the demand is increasing with the increase in population. Though the grape plants can grow well in Bangladesh environmental conditions, the quality of fruits was not good at all. The cultivation of grape in Bangladesh is a new approach. Recent studies showed that grape could be successfully grown if good variety is chosen and cultural practices are followed [5]. In Bangladesh, it was seen that grape vine variety “Jakkao” produces fruit twice a year and each vine produces minimum average 4 kg edible fruit a year. Grape is one of the exotic and expensive fruits of Bangladesh and its consumption is mainly limited to a section of people. The minimum per capita dietary requirement of fruits day−1 is about 100 g, whereas fruit availability in Bangla-desh is only 30 - 50 g [6]. There exists a great shortage of fruit production to fulfill the requirement of the coun-try. In such a situation the production of grapes in the country will help to minimize the fruit shortage as well as to reduce the wastage of foreign currency required to import this highly demanded fruit. The demand of fruits can be met in a shorter time by increasing the yield and quality. Recently, Bangladesh Agricultural Development Corporation (BADC) introduced a genotype named as “Jakkao” which is successfully grown under the soil and climatic condition of Bangladesh with profuse flowering and fruiting. But berries in all cases are found seeded and not sweet as imported ones. Bangladeshi grape is sour and tasteless due to heavy rainfall in summer season [7]. Sweetness of grape berries depend on various factors such as grape variety [8], maturation degree, cultural practices [9] [10] and environmental factors such as soil [11] and climate [12]. So, using different types of tech-niques such as nuclear techtech-niques, fertilizer management, hormonal treatment and even conventional breeding methods can improve desirable target for its good quality and yield as well as other expected features in our en-vironmental conditions. Therefore, attempt has been taken to improve grape cultivars for higher yield with better physiological characters and quality. In the present study different doses of gamma irradiation were applied to grape saplings at different growth stages of saplings to determine the suitable gamma irradiation doses on the growth characteristics and better leaf area and biochemical features of grape vines.
2. Materials and Methods
completely with a piece of transparent polythene sheet. The wrapping material was then tied up thoroughly at both the ends with rope. The layers were separated from the mother plant when the rooting medium was fulfilled with newly developed roots. It was observed through the upper surface of the polythene sheet. After detachment of the layers from the mother plant they were replaced in polybags and kept under shade for established of plants. Three stages such as bud initiation stage, 4-leaf stage and 8-leaf stage before applying gamma irradiation were prepared by detopping the branches several times. The nitrogenous, phosphatic, and potassic fertilizers were ap-plied in the experimental pots following recommended doses viz. Cowdung 10 t, Urea 550 kg, TSP 450 kg and MP 250 kg∙ha−1. After irradiation by gamma radiation source, plants were planted in each pot. Weeds were uprooted by hand pulling when appeared. Irrigation was given as and when needed. With the advancement of growth, support was provided to the plants by bamboo sticks. Necessary data were recorded on the morphologi-cal, growth, and biochemical parameters. Total leaf area of the plant was measured with leaf area meter (Auto-matic electronic leaf area meter, model LI-3000, USA). Chlorophyll content of leaf was estimated following the standard procedure [14]. The statistical analysis of variance was done using computer package program MSTAT-C [15]. The mean difference of the morphological, physiological and biochemical parameters among the treatments was adjusted by Duncan’s Multiple Range Test [16].
3. Results and Discussion
3.1. Growth Characteristics
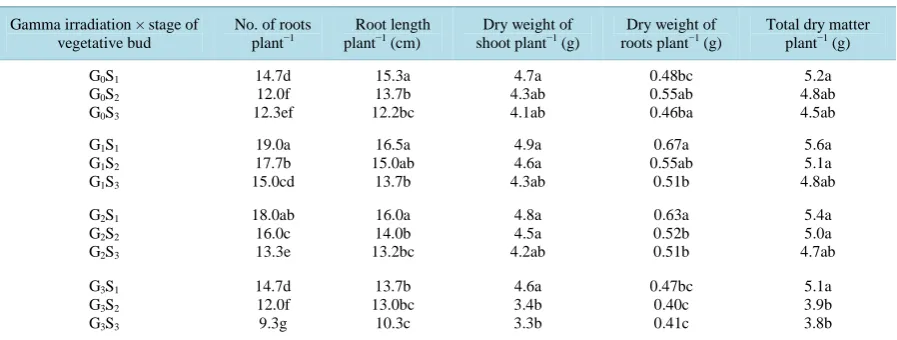
3.1.1. Number of Roots Plant−1A marked variation was observed in the number of roots plant−1 due to the influence of different levels of gam-ma irradiation (Table 1(a)). The highest number of roots plant−1 (17.2) was found in (G1) 5 Gy which varied significantly from other doses. The lowest number of roots plant−1 (12.0) was found in (G3) 15 Gy. Researchers [17] reported that the number of roots plant−1 increased with low dose (5 Gy) of irradiation in grape. The number of roots plant−1 showed highly significant variation in respect of different vegetative bud stages (Table 1(b)). The highest number of roots plant−1 (16.6) was found in (S1) bud initiation stage which varied significantly from other stages while the lowest number of roots plant−1 (12.5) was found in (S3) 8-leaf stage. The interaction effect of different vegetative bud stages and different gamma irradiation doses in respect of number of roots plant−1 was found significantly different (Table 1(c)). The maximum number of roots plant−1 (19.0) was found in the treatment combination of G1S1 and the minimum number of roots plant−1 (9.3) was found in G3S3 (Table 1(c)).
3.1.2. Root Length Plant−1
A significant variation in length of root plant−1 was observed due to the influence of different gamma irradiation doses (Table 1(a)). The maximum root length per plant−1 (15.1 cm) was observed in G1 and the minimum (12.3 cm) was found in G3. Root length increased with low doses (5 Gy) of irradiation which was supported by others [17].
The root length was highly significant in respect of vegetative bud stages (Table 1(b)). The maximum root length plant−1 (15.4 cm) was observed in S1 and the minimum (12.3 cm) was found in S3. The maximum root length (16 cm) was found in G1S1 followed by G2S1 and minimum (10.3 cm) was found in G3S3 (Table 1(c)).
3.1.3. Total Dry Matter Plant−1
A highly significant variation in total dry matter plant−1 was found in respect of different gamma irradiation doses (Table 1(a)). The maximum total dry matter plant−1 (5.2 g) was produced by G1 due to greater dry matter production in shoot and root and minimum dry matter (4.3 g) was produced in G3. The amount of total dry mat-ter plant−1 increased at low doses (5 Gy) of irradiation which was supported by other researchers [17]. A marked variation in total dry matter plant−1 was found in respect of vegetative bud stages (Table 1(b)). Maximum amount of total dry matter plant−1 (5.3 g) was observed in S1 due to higher dry matter production in shoot and root and the minimum total dry matter plant−1 (4.4 g) was produced in S3. In the interaction effects, the maxi-mum total dry matter plant−1 (5.6 g) was found in G1S1 followed by G2S1, G0S1, G3S1 and minimum (3.8 g) was found in G3S3.
3.1.4. Leaf Area Plant−1
Table 1. (a) Effect of gamma irradiation on different growth parameters of grape saplings. (b) Effect of different vegetative bud stages on different growth parameters of grape saplings. (c) Interaction effect between gamma irradiation and different
vegetative bud stages on different growth parameters of grape saplings.
(a)
Gamma irradiation
No. of roots plant−1
Root length plant−1 (cm)
Dry weight of shoot plant−1 (g)
Dry weight of root plant−1 (g)
Total dry matter plant−1 (g)
G0 G1 G2 G3 13.0c 17.2a 15.8b 12.0d 13.7c 15.1a 14.4b 12.3d 4.4b 4.6a 4.5ab 3.8c 0.46d 0.58a 0.55b 0.47c 4.8b 5.2a 5.0ab 4.3c
Same letter(s) in a column do not differ significantly at 5% level according to DMRT.
(b)
Stage of vegetative bud
No. of roots plant−1
Root length plant−1 (cm)
Dry weight of shoot plant−1 (g)
Dry weight of roots plant−1 (g)
Total dry matter plant−1 (g)
S1 S2 S3 15.6a 14.4b 12.5c 15.4a 13.9b 12.3c 4.7a 4.2b 4.0c 0.60a 0.50b 0.45c 5.3a 4.7b 4.4c
Same letter(s) in a column do not differ significantly at 5% level according to DMRT.
(c)
Gamma irradiation × stage of vegetative bud
No. of roots plant−1
Root length plant−1 (cm)
Dry weight of shoot plant−1 (g)
Dry weight of roots plant−1 (g)
Total dry matter plant−1 (g)
G0S1 G0S2 G0S3
14.7d 12.0f 12.3ef 15.3a 13.7b 12.2bc 4.7a 4.3ab 4.1ab 0.48bc 0.55ab 0.46ba 5.2a 4.8ab 4.5ab
G1S1 G1S2 G1S3
19.0a 17.7b 15.0cd 16.5a 15.0ab 13.7b 4.9a 4.6a 4.3ab 0.67a 0.55ab 0.51b 5.6a 5.1a 4.8ab
G2S1 G2S2 G2S3
18.0ab 16.0c 13.3e 16.0a 14.0b 13.2bc 4.8a 4.5a 4.2ab 0.63a 0.52b 0.51b 5.4a 5.0a 4.7ab
G3S1 G3S2 G3S3
14.7d 12.0f 9.3g 13.7b 13.0bc 10.3c 4.6a 3.4b 3.3b 0.47bc 0.40c 0.41c 5.1a 3.9b 3.8b
Same letter(s) in a column do not differ significantly at 5% level according to DMRT.
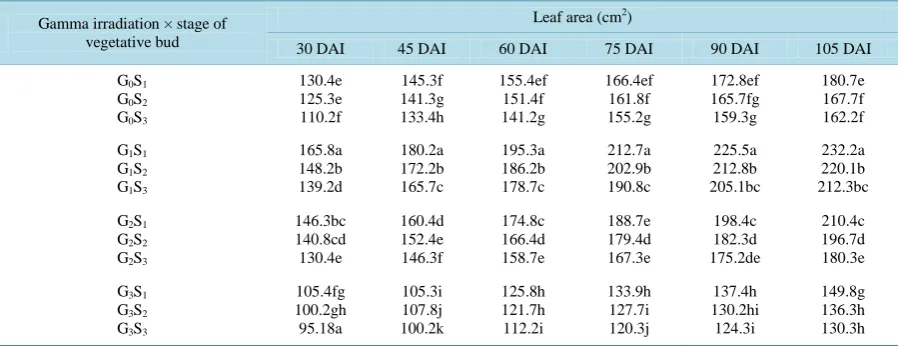
tion doses at different days after irradiation (DAI) (Table 2(a)). At 30 DAI, the maximum leaf area plant−1 (151.1 cm2) was observed in G1 and the minimum leaf area (100.2 cm2) was observed in G3. At 45 DAI, the maximum leaf area plant−1 (172.7 cm2) was observed in G1 and the minimum (107.7 cm2) was observed in G3. At 60 DAI, the maximum leaf area plant−1 (186.7 cm2) was observed in G1 and the minimum (119.9 cm2) was observed in G3. At 75 DAI, the maximum leaf area plant−1 (202.1 cm2) was observed in G1 and the minimum (127.3 cm2) was observed in G3. At 90 DAI, the maximum leaf area plant−1 (214.4 cm2) was observed in G1 and the minimum plant−1 (130.6 cm2) was observed in G3. At 105 DAI, the maximum leaf area plant−1 (221.7 cm2) was observed in G1 and the minimum plant−1 (138.8 cm
2
) was observed in G3 (Table 2(a)). The leaf area plant−1 increased in low doses of irradiation. The similar results were also obtained by others [17]. A highly significant variation was found in leaf area plant−1 at different DAIs due to different vegetative stages (Table 2(b)). The maximum leaf area plant−1 was observed in S1 and the minimum leaf area plant−1 was observed in S3. At 30 DAI, the maximum leaf area plant−1 (137.0 cm2) was observed in S1 while the minimum plant−1 (118.7 cm2) was ob-served in S3. At 45 DAI, the maximum leaf area plant−1 (150.3 cm2) was observed in S1 while the minimum plant−1 (136.4 cm2) was observed in S3. At 60 DAI, the maximum leaf area plant−1 (162.8 cm2) was observed in S1 while the minimum plant−1 (147.7 cm
2
Table 2. (a) Effect of gamma irradiation on leaf area plant−1 of grape saplings. (b). Effect of different vegetative bud stages on leaf area plant−1 of grape saplings. (c) Interactive effect between gamma irradiation and different vegetative bud stages on
leaf area plant−1 of grape saplings.
(a)
Gamma irradiation
Leaf area (cm2)
30 DAI 45 DAI 60 DAI 75 DAI 90 DAI 105 DAI
G0 G1 G2 G3 121.9c 151.1a 139.1b 100.2d 140.0c 172.7a 153.0b 107.7d 149.3c 186.7a 166.6b 119.9d 161.1c 202.1a 178.4b 127.3d 165.9c 214.4a 185.3b 130.6d 170.2c 221.7a 195.8b 138.8d
Same letter(s) in a column do not differ significantly at 5% level according to DMRT.
(b)
Stages of vegetative bud
Leaf area (cm2)
30 DAI 45 DAI 60 DAI 75 DAI 90 DAI 105 DAI
S1 S2 S3 137.0a 128.6b 118.7c 150.3a 143.4b 136.4c 162.8a 156.4b 147.7c 175.4a 167.9b 158.4c 183.5a 172.7b 165.9c 193.4a 180.2b 171.3c
Same letter(s) in a column do not differ significantly at 5% level according to DMRT.
(c)
Gamma irradiation × stage of vegetative bud
Leaf area (cm2)
30 DAI 45 DAI 60 DAI 75 DAI 90 DAI 105 DAI
G0S1 G0S2 G0S3
130.4e 125.3e 110.2f 145.3f 141.3g 133.4h 155.4ef 151.4f 141.2g 166.4ef 161.8f 155.2g 172.8ef 165.7fg 159.3g 180.7e 167.7f 162.2f
G1S1 G1S2 G1S3
165.8a 148.2b 139.2d 180.2a 172.2b 165.7c 195.3a 186.2b 178.7c 212.7a 202.9b 190.8c 225.5a 212.8b 205.1bc 232.2a 220.1b 212.3bc
G2S1 G2S2 G2S3
146.3bc 140.8cd 130.4e 160.4d 152.4e 146.3f 174.8c 166.4d 158.7e 188.7e 179.4d 167.3e 198.4c 182.3d 175.2de 210.4c 196.7d 180.3e
G3S1 G3S2 G3S3
105.4fg 100.2gh 95.18a 105.3i 107.8j 100.2k 125.8h 121.7h 112.2i 133.9h 127.7i 120.3j 137.4h 130.2hi 124.3i 149.8g 136.3h 130.3h
Same letter(s) in a column do not differ significantly at 5% level according to DMRT.
cm2) was observed in S1 while the minimum plant−1 (158.4 cm 2
) was observed in S3. At 90 DAI, the maximum leaf area plant−1 (183.5 cm2) was observed in S1 while the minimum plant−1 (165.9 cm2) was observed in S3. At 105 DAI, the maximum leaf area plant−1 (193.4 cm2) was observed in S1 while the minimum plant−1 (171.3 cm2) was observed in S3 (Table 2(b)).
cm2) was found in the treatment combination of G1S1 which was statistically different from others. The mini-mum leaf area plant−1 (124.3 cm2) was found in G3S3 followed by G3S2. At 105 DAI, the maximum leaf area plant−1 (232.8 cm2) was found in the treatment combination of G1S1 which was statistically different from others. The minimum leaf area plant−1 (130.3 cm2) was found in G3S3 followed by G3S2 (Table 2(c)).
3.2. Biochemical Characteristics
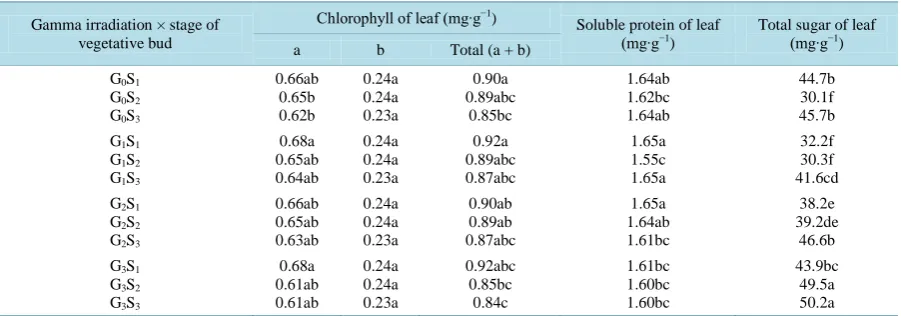
3.2.1. Chlorophyll Content in Leaves [image:6.595.88.539.549.707.2]There was no variation in chlorophyll content found due to different gamma irradiation doses (Table 3(a)). The effect of different vegetative bud stages was found significant in respect of chlorophyll content of leaf in grape saplings (Table 3(b)). The maximum amount of chlorophyll-a, chlorophyll-b, and total chlorophyll were 0.67, 0.24, & 0.91 mg∙g−1, respectively found in S1 followed by S2. The minimum amount of chlorophyll-a, chloro-phyll-b and total chlorophyll were 0.63, 0.22, & 0.85 mg∙g−1, respectively found in S3 (Table 3(b)). The interac-tion effect of different gamma irradiainterac-tion doses and different vegetative bud stages showed no variainterac-tion in re-spect of chlorophyll-a, chlorophyll-b and total chlorophyll content (Table 3(c)). Increase in irradiation doses decreased the amount of chlorophyll content also agreed by others [18].
Table 3. (a) Effect of gamma irradiation on the biochemical characters of grape saplings. (b) Effect of different vegetative bud stages on the biochemical characters of grape saplings. (c) Interaction effect between gamma irradiation and different
vegetative bud stages on the bio-chemical characters of grape saplings.
(a)
Gamma irradiation
Chlorophyll of leaf (mg∙g−1)
Soluble protein of leaf
(mg∙g−1) Total sugar of leaf (mg∙g−1) a b Total (a + b)
G0 G1 G2 G3 0.64a 0.66a 0.65a 0.63a 0.23a 0.24a 0.23a 0.23a 0.87a 0.90a 0.88a 0.86a 1.64a 1.62a 1.63a 1.60a 41.7b 34.7c 42.3b 45.4a
Same letter(s) in a column do not differ significantly at 5% level according to DMRT.
(b)
Stage of vegetative bud Chlorophyll of leaf (mg∙g −1)
Soluble protein of leaf
(mg∙g−1) Total sugar of leaf (mg∙g−1) a b Total (a + b)
S1 S2 S3 0.67a 0.64ab 0.63b 0.24a 0.24a 0.22b 0.91a 0.88a 0.85b 1.64a 1.60b 1.63ab 39.8b 36.6c 46.8a
Same letter(s) in a column do not differ significantly at 5% level according to DMRT.
(c)
Gamma irradiation × stage of vegetative bud
Chlorophyll of leaf (mg∙g−1)
Soluble protein of leaf
(mg∙g−1) Total sugar of leaf (mg∙g−1) a b Total (a + b)
G0S1 G0S2 G0S3
0.66ab 0.65b 0.62b 0.24a 0.24a 0.23a 0.90a 0.89abc 0.85bc 1.64ab 1.62bc 1.64ab 44.7b 30.1f 45.7b G1S1
G1S2 G1S3
0.68a 0.65ab 0.64ab 0.24a 0.24a 0.23a 0.92a 0.89abc 0.87abc 1.65a 1.55c 1.65a 32.2f 30.3f 41.6cd G2S1
G2S2 G2S3
0.66ab 0.65ab 0.63ab 0.24a 0.24a 0.23a 0.90ab 0.89ab 0.87abc 1.65a 1.64ab 1.61bc 38.2e 39.2de 46.6b G3S1
G3S2 G3S3
0.68a 0.61ab 0.61ab 0.24a 0.24a 0.23a 0.92abc 0.85bc 0.84c 1.61bc 1.60bc 1.60bc 43.9bc 49.5a 50.2a
3.2.2. Soluble Protein Content in Grape Leaves
Soluble protein of leaf was recorded at 105 DAI. A highly significant variation on soluble protein content was found in respect of different gamma irradiation doses (Table 3(a)). Gradual increase in gamma irradiation dose decreased the amount of soluble protein in leaf. The maximum amount of soluble protein of leaf (1.64 mg∙g−1) was found in G0 followed by G1 and G2. The minimum amount of soluble protein (1.60 mg∙g−1) was found in G3. There were significant variations on soluble protein of leaf in respect of different vegetative stages (Table 3(b)). The maximum amount of soluble protein of leaf (1.64 mg∙g−1) was found in S1 followed by S3. The minimum amount of soluble protein of leaf (1.60 mg∙g−1) was found in S2 (Table 3(b)). The interaction effect of gamma irradiation doses and different vegetative buds showed no variation in the amount of soluble protein content (Table 3(c)).
3.2.3. Total Sugar Content in Grape Leaves
A highly significant variation of total sugar of leaf was found in respect of gamma irradiation (Table 3(a)). With the gradual increase in gamma irradiation doses the total sugar of leaf increased. The maximum amount of total sugar of leaf (45.4 mg∙g−1) was found in G3 and minimum total sugar (34.7 mg∙g−1) was found in G1. The amount of total sugar varied significantly among the different vegetative bud stages (Table 3(b)). The maximum amount of total sugar of leaf (46.8 mg∙g−1) was found in S3 and minimum total sugar (36.6 mg∙g−1) was found in S2 (Table 3(b)). The interaction effect of different gamma irradiation doses and different vegetative bud stages differed significantly in respect of total sugar of leaf (Table 3(c)). The maximum amount of total sugar of leaf (50.2 mg∙g−1) was found in G3S3 followed by G3S2 and minimum total sugar (30.1 mg∙g−1) was found in G0S2.
4. Conclusion
It was evident from the results that higher doses had detrimental effect on the plant morphological and bio-chemical parameters. Among the irradiation doses, 5 Gy showed better morphological parameters in M1 genera-tion, however, it is difficult to say at this stage which dose and stage will show maximum mutability. In M2 gen-eration, the expression of mutagenicity will be observed. So, the research works done will push a step forward for further observation and selection of most desirable mutant in M2 and the following generations.
References
[1] Olmo, H.P. (1976) Origin and Distribution of Grapes. In: Simmonds, N.W., Ed., Evolution of Crop Plants, Longman, London and New York, 294-298.
[2] Wang, Y., Chen, J., Lu, J. and Lamikanra, O. (1999) Randomly Amplified Polymorphic DNA Analysis of Vitis Spe-cies and Florida Bunch Grapes. Scientia Horticulturae, 82, 87. http://dx.doi.org/10.1016/S0304-4238(99)00049-7
[3] Mondal, M.F. and Amin, M.R. (1990) Pholer Bagan. Club Building (1st Floor), BAU Campus, Mymensingh, 193-238. [4] FAO (2001) Food and Agriculture Organization of the United Nations, Rome, 2, 111-114.
[5] Nuruzzaman, M. (1996) Grape Production Technology (in Bengali). Deraj Printers. Arambagh, Dhaka, 1-43.
[6] Siddique, A.B. and Scanlan, F.M. (1995) Nutritive Values of Fruit. In: Fruit Production Manual. Horticulture Re-search Development Project. (FAO/UNDP/ASDB) Project: BGD 1871025, 1-286.
[7] Ahmed, K.U. (1976) Flowers, Fruit and Vegetable. 3rd Edition, Alhaj Kasimuddin Ahmed, Bungalow No. 2, Farm Gait, Dhaka-15, Bangladesh, 416 p.
[8] Perez-Magariño, S., Ortega-Heras, M., Cano-Mozo, E. and Gonzalez-Sanjose, M.L. (2009) The Influence of Oak Wood Chips, Micro-Oxygenation Treatment, and Grape Variety on Colour, and Anthocyanin and Phenolic Composi-tion of Red Wines. Journal of Food Composition and Analysis, 22, 204-211.
http://dx.doi.org/10.1016/j.jfca.2008.09.006
[9] Downey, M.O., Dokoozlian, N.K. and Krstic, M.P. (2006) Cultural Practice and Environmental Impacts on the Flavo-noid Composition of Grapes and Wine—A Review of Recent Research. American Journal of Enology and Viticulture, 57, 257-268.
[10] Petropoulos, S., Kallithraka, S. and Paraskevopoulos, I. (2011) Influence of Some Viticultural Practices on the Poly-phenolic Content of Wines Produced from cv. Agiorgitiko (Vitis vinifera L.). Journal of International des Sciences de
la Vigne et du Vin, 45, 235-243.
and Food Chemistry, 55, 779-786. http://dx.doi.org/10.1021/jf062446q
[12] Jackson, D.I. and Lombard, P.B. (1993) Environmental and Management Practices Affecting Grape Composition and Wine Quality—A Review. American Journal of Enology and Viticulture, 44, 409-430.
[13] UNDP and FAO (1988) Land Resources Appraisal of Bangladesh for Agricultural Report No. 2. Agro-Ecological Re-gion of Bangladesh. United Nations Development Program in Food and Agriculture Organization, 212-221.
[14] Arnon, D.I. (1949) Copper Enzymes in Isolated Chloroplasts. Poly Phenoloxidase iso Beta vulgaris. Plant Physiology, 24, 1-5. http://dx.doi.org/10.1104/pp.24.1.1
[15] Russel, D.G. (1986) MSTAT-C Package Program. Crop and Soil Science Department, Michigan State University, USA.
[16] Gomez, K.A. and Gomez, A.A. (1984) Statistical Procedures for Agriculture Research. 2nd Edition, John Wiley and Sons, New York, 640 p.
[17] Charbaji, T. and Nabulsi, I. (1999) Effect of Low Doses of Gamma Irradiation on in Vitro Growth of Grapevine. Plant
cell, Tissue and Organ Culture, 57, 129-132. http://dx.doi.org/10.1023/A:1006360513965
[18] Lima, D.S.A. and Doazan, J.P. (1995) Gamma Ray Mutagenesis on Grapevine Rootstocks Cultivated in Vitro. Journal