Taxonomy based Data Marts
Asiya Abdus Salam Qureshi
Syed Muhammad Khalid Jamal
ABSTRACT
The aim of this paper is to depict new approach called taxonomy based data marts which add a new layer for the categorization of the queries using data warehouse which is the database that contains data relevant to an organization information and respond quickly to multi dimensional analytical queries. The new algorithm is introduced here for more precise results and time saving consumption using data marts which collects data for specific set of users or knowledge workers. Data warehouses often adopt a three-tier architecture. The bottom tier is a warehouse database server, which is typically a relational database system. The middle tier is an OLAP server, and the top tier is a client that contains query and reporting tools. Another new layer is added for faster results. This is done with the help of query classification technique.
Keywords
Query Classification, Bridging Classifier, Category Selection, Data Marts, Taxonomy based data marts, Data warehouse, OLAP server
1.
INTRODUCTION
In order to survive in the today’s world, any organization needs to be trendy. It has to observe the modification within the organization and outside the organization. This gives rise to the need of the data warehousing. Data warehousing technology is the course by which the chronological data of a company is created and utilized. A data warehouse is the database that contains data appropriate to company information. On the basis of past performance, data is accessible in making right decisions.
To exploit the data warehousing expertise, organization can select Online Transaction Processing (OLTP) or Online Analytical Processing (OLAP). Data warehousing changes data to information and facilitates the organizations to monitor its operations and performances. This task is done by the staging and conversion of data from data sources. The data stores may be stored on disk or memory.
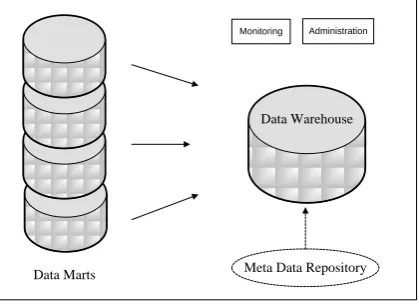
data warehousing appliance. Reports such as financial statements, accounts can be created easily with the data available in the data warehouse.Figure 1 shows the basic architecture of data warehouse. From external sources data is transformed at staging area and then moves to data warehouse.
The Data warehousing system uses backend tools to extract, clean and load data from Online Transaction Processing
(OLTP) and the repositories of data. Data warehousing contains the data storage area. This area is composed of the data warehouse, the data marts and the data store. It also provides tools like OLAP to categorize, partition and review data in the data warehouse and data marts. Mining, querying and reporting on data requires front end tools.
Most of the organizations implement the method of data warehousing as a management technique. Data warehousing
Data marts collect the data from the data warehouse and send to OLAP layer. Now data is ready to be used by end users as an accessible tool.
It is time consuming to create a consistent and compatible system of data collection for storage and retrieval. The most common issue in data warehousing is that it requires regular data cleaning, extraction and loading data in the system and it is also time consuming. This problem can be resolved by using the taxonomy algorithm.
Query taxonomy is the management of exploration which is clustered in hierarchical structure. This is an easy, suitable and widespread way for user to browse relevant web contents. The Query Classification algorithm structure bridges classifier on a mediator taxonomy in an offline mode and then usesit in online mode to map queries to target taxonomies. For improving the online classification, category selection method is used to pick categories in mediator taxonomy. There is no need for extra resource as well and the method proves to be more accurate.
Data warehousing system comprises of Data warehouse. It provides combined, handy and flexible collection of data for end user analysis and reporting. As the data collected by a warehouse gives information about a particular subject instead of about a company’s ongoing operation, so its subject oriented. Here the data is gathered from a variety of sources into the data warehouse and merged into logical lots.
Data is steady in a data warehouse. More data is added but data is never removed. Thus, the management can gain a constant cumulative picture of the business. Hence the data warehouse is long term storage.
We can also distinguish data warehousing and data warehouse. Data warehousing includes a complete structural design and provides tools for the end users to access gatheredand stored data whereas the data warehouse is data stored in the form of fact tables, aggregated fact tables, and lookup fact tables and it is a collection of data that maintain the decision making procedure of a management. This research paper is based on optimizing and adding efficiency to data warehouses by introducing taxonomy classification for Data Marts.
Data Mart is a subset of the collection of data of the company that is applicable to a specific set of users. It is generally leaning towards a particular point or a main data subject that may be shared to support business requirements. For instance, the sales division data mart may detain its subject to number and name of items sold, profits and loss. Data marts are characterized as one dimensional representation or a star schema with the fact table and multidimensional table. It is mainly designed to meet the immediate requirements. Its concepts can be applied to any type of data.
Data warehouse and data marts use Online Analytical Processing OLAP which is a tool used to organize, partition and summarize data. OLAP belongs to the category of business intelligence. Its an approach which respond quickly to multi-dimensional analytical queries and finds application
in business reporting for sales, marketing, budgeting and forecasting, management reporting, business process management, financial reporting and similar areas. The output of an OLAP query is presented as a matrix. The dimensions form the rows and columns of the matrix and the measures form the values. OLAP creates a hypercube of information. The cube metadata is usually created from a star schema or snowflake schema of tables in a relational database.
The data warehouse dealers and few other researchers have extracted a general definition for OLAP which is FASMI which stands for Fast, Analysis, Shared, Multidimensional, and Information. The ability of OLAP is to respond to the user requests in less than 5 seconds. The response time for a complex requests would probably take 20 seconds. The speed is achieved by using various techniques like specialized data storage, certain hardware components, pre-calculations and so on.
OLAP has the power of handling any business or statistical analysis for users. The most commonly used analysis techniques are slice and dice and drill down. When multiple write access is granted, the system has the ability to maintain confidentiality and lock simultaneous update. It also has the ability to provide multiple user access without letting the files to duplicate. Multidimensionality is the main feature of OLAP products. that requires managing data in the format as per the organization’s actual business dimension. OLAP must contain the data which the user requires and must provide efficient data analysis techniques.
Data warehouse’s metadata are data defining the warehouse objects. A metadata repository provides details regarding the warehouse structure, data history, the algorithms used for summarization, mappings from the source data to the warehouse form, system performance, and business terms and issues.
This paper is organized as follows. We begin with the introduction of the complete approach. In section 2, we discuss the architectural aspects and framework of our algorithm, Taxonomy based data marts. Section 3 presents Algorithm under taken. This is followed by section 4, which includes applicability of the algorithm proposed in this paper. Section 5 shows the related work of taxonomy and multi layered architecture, followed by the last section that gives the conclusion and the possibilities for future research work.
2.
MULTI
LAYERED
FRAMEWORK
With the merging of query classifier with three-tier architecture of data warehousing, integrating of multiple heterogeneous sources will become easier and results in consistency. Data stored for giving historical outcomes will be more focused. Recovery of lost data will be under control. Also data warehouse provide OLAP i.e. Online Analytical Processing which is a tool used for interactive analysis of multidimensional data. Both data warehousing and OLAP are important layers in the process of knowledge discovery.
2.1 Methodology
Figure 2 shows the multi layered architecture in which bottom up approach is pursued because the development and deployment of data marts grant flexibility low cost and rapid return. The architecture starts from data layer, where operational database and external sources feed data.
In Data Warehousing, to carry out regular operations of an organization, the Operational Database is accessed by an Operational System. Operational Databases usually use an OLTP Database that is used to optimize faster transaction processing: Inserting, Deleting, and Updating data. On the other side, DataWarehouses use an OLAP Database (Online Analytical Processing) which is optimized for faster queries.[19]
The process extract, clean, transform, load and refresh data and send to data warehouse server layer. The back end tools application is to populate and refresh the data to be used for data marts. The functions included in it are data extraction, data cleaning and data transformation. The basic work of data extraction is that it collect data from multiple, diverse and external sources. Data cleaning, cleans the data. It discovers error in the data and rectifies them. Data is converted from host format to warehouse format with the help of data transformation. Loading of data is the process of sorting, summarization, consolidation, viewing, checking of integrity and building indices and partitions. Refresh propagate the updates from the data sources to data marts. Data cleaning and data transformation are vital steps in improving the data quality.[01]
The layer in between the data layer and the bottom layer is Query classification layer in which bridging classifier is used to couple queries in between mediator and target taxonomies. Mediator taxonomy is used as bridge to link focused queries results. The mediator and target categories are associated together through query Classifier Bridge that yield result. Taxonomy bridging classifier is used to process against target taxonomy as shown in figure 2. Mediator taxonomy could be huge; therefore category selection mechanism is used to find out subsets of mediator categories related to target categories. The target queries will be send to data marts and then send to data warehouses which are now the most concurrent and concise.[07]
The bottom tier is the relational database system which is based on the relations between tables. It can be considered as the store of data stuff organized as set of properly described tables for easier accessibility of the data. Tables have the same structure repeated in each row (like a spreadsheet) and it is the relations between the tables that make it a "relational" table. The data obtained here will be merged into similar and unified formats and also load and refresh for updating the data warehouse. The internal Database management system supports doorway, which is the source of extraction of data. Doorway is an application program interface that generates SQL codes for the execution at server using client programs.
This layer also contain meta data repository which is constructed for defining data names and functionalities of given warehouse. Meta data will detain recording of any extracted data, source of extracted data and missing fields added by the data cleaning or integrating processes according to time. It will describe the structure of data warehouse plus data marts locations and contents. Data lineage which is the history of migrated data and sequence of transformation from the data layer , its currency and information of monitoring will be shown with the summarization algorithm. Mapping of data and system performance will make improvements.
OLAP server is the middle tier. OLAP server implementation involves extended relational database management system for mapping operations on multidimensional data or a special purpose server for direct implementation of multidimensional data and operations. Data in multidimensional form is obtained from data warehouse or data marts. The data is viewed in the form of data cube which permits data to be modeled and viewed in multiple dimensions. It includes all the perspectives or entities with respect to which an organization wants to keep records and facts which are numeric measures.[03]
The top tier is the final layer in this architecture. It is also known as front end client layer. It include query and reporting tools, analysis tools and / or data mining tools. These tools act as an interface between the user and the back end tools. The queries sent from the data warehouse and data marts are processed in the form of cube and then it serves the user. The results are enhanced.
3.
TAXONOMY
BASED
DATA
MARTS
ALGORITHM
From operational databases and some external sources extracted, cleaned, transformed, loaded and refreshed data is moved to next layer of Query Classification for the arrangement of categories of data. Query classification layer, with the help of bridging classifier, categorizes the queries with the selection method and thus creates taxonomies based data marts. This provide with efficient and fast result for data warehouses. OLAP server receives those taxonomies based categorized data marts and produces a fine result for end users.
Data
Query Classification
Layer
OLAP Server Taxonomy
Based Data Marts
Output
Figure 3 Block Diagram for Taxonomy based Data Marts
other mechanism. The combined results from these taxonomy based data marts are stored as cuboids for better outcome. Data can be summarized and stored in variety of ways as cubes of OLAP system.
[image:5.595.59.275.190.254.2]The final layer is the front end tools for users. It is in the form of data mining tools or tools for analysis and reporting.
Figure 3.1 Block Diagram for Query Classification Layer
Mediator Category
Category Selection
Bridging Classifier Taxonomy
Bridging Mechanism
Target Category
Figure 3.1 is the block diagram of query classification layer. In this figure, queries are categorized using bridging classifier.Even when target categories are different, classifiers need to be trained only once for future query classification responsibilities. [15]
[image:5.595.60.270.493.645.2]The working of this block diagram includes the usage of mediator category as a link to target category as bridging classifier. Whatever data is obtained from mediator category is sent to target category through bridging classifier for the target output. Category selection system is also applied to determine the subsets of huge mediator categories improving the usefulness and efficiency of online classification. This method also describes that the part of mediator category most relevant to target category is opted for use by the connector.
Figure 3.2 Block Diagram for Taxonomy based Data Marts Data Marts
Data Warehouse
Meta Data Repository
Monitoring Administration
Figure 3.2 shows the basics of taxonomy based data marts. Meta data repository stores information regarding the content of data marts and data warehouses. The categorized results from data marts are combined with meta data and resides as categories in the data warehouses. This taxonomy is then sent to OLAP server cuboids.
4.
DATA
MARTS
CATEGORIZATION
USAGE
FOR
INFORMATION
PROCESSING
There are broadcollection of application for data warehouse and data marts. By using data in data warehouse and data marts, business supervisory can perform data analysis and make strategic decision. Data marts are used as an essential part of “plan – execute – assess” feedback system in many enterprises for management. Services like banking and finance, end user goods, retail distribution sectors, demand based production and controlled manufacturing require the need of data marts.[05]
There are number of phases which help data marts to evolve. It include some tools for data warehousing. These tools categorizes into access and retrieval tools, database reporting tools, data analysis tools and data mining tools.
The initial phase include data warehouses which are used for generating reports and answering predefined queries. It is gradually used toexamine summarized and detailed data which contain the results presented in the form of reports and charts. Then the next phases is about using data marts for strategic purposes, refined slice and dice operations and performing multidimensional analysis. Lastly data mining tools can be used for knowledge discovery and strategic decision making.
5.
APPLICABILITY
OF
MULTILAYERED
ARCHITECTURE
The approach has its utilization in the early stage of business modeling and technology development. The expense is low and evaluation of technological benefits is significant. Another wide range of its application includes performance of data analysis their strategic decisions are more accurate and reliable due to the merging of taxonomies.[09]
If any data warehouse is in use, it will evolve more. It can easily answer predefined queries. Query classifier helps it to do this task mainly as the classification can make easy for short queries. No training data is required again and again. The taxonomy based data marts will help to access the contents of data warehouse and use analysis tools.[21] Information processing is one of the applications of data warehouse which is based on queries. These queries are categorized with the use of Query classifier and easily answerable to queries that reflect information stored in database directly. Data marts consist of huge volume of queries (which is only a subset of the data warehouse queries). [18]
large database from numerous, varied, autonomous and dispersed information source which could be managed efficiently by using query classifier.
A meta data dictionary on top of multiple database is used to transform the query into queries suitable for individual sites. With the help of taxonomy classifier, these queries can be categorized from different databases at client site and mapped for local processing. Placement of queries in huge amount of data can be a problem but taxonomy classifier simplifies the task by providing taxonomy based approach and results in high performance. [17]
Frequently needed data is easily accessed using data marts
taxonomies. It generates combined vision by a group of users
and hence improves end-user response time. It gives minor
cost than implementing a full data warehouse. Also potential
users are more clearly defined than in a full data warehouse
6.
RELATED
WORK
Previously, some work has been done on Query classification. Shen et al research on building bridges using web Query Classification that is a novel approach used to classify web users short and unclear queries into set of target categories. Query classification works on web search page ranking targeted advertisement and personalization. ACM KDD CUP 2005 competition solution is taken into consideration to classify 80,000 real users queries. Bridging classifier is build on an intermediate taxonomy in an offline mode and then used in an online mode to map user queries to target categories.[11] The advantage of this procedure is that bridging classifier needs to be trained only once. Category selection method is also used with the intermediate taxonomy for the selection of queries to be classified for efficient and effective classification. The problem of generating a ranked list of target categories of user queries is solved using QC approach. It provides different categories better user search result pages. KDDCUP 2005 classifies 80,000 real queries into 67 target categories.
Another related work is web supported query taxonomy classifier in which the algorithm for WSQ is combined with QC for better searching results. We will use here the only part of QC for improvement in the data marts performance.[10] Some others also proposed the categorization of queries according to their needs but their input data was not trained. Time factor and changes cause problems for them which wereovercome by Query Classification approach. Besides the categorization of queries, data marts working shown by Jiawi Han make use of the data warehouse. [07]
The three tier architecture of data warehouse includes three layers while we include one more layer in it which is the layer of Query Classification. Because of this, data marts start working faster. The bottom tier is a relational database system layer which sends data to middle layer after going through the
process of data extraction, data cleaning, data transformation, loading, refreshing and warehouse management. Meta data repository stores information related to data warehouse and its contents. The top tier is link with consumer as it contains tools like query and report analysis. [19]
A multidimensional data model is characteristically used for the corporate data warehouses and departmental data marts designing. These models could be star schema, snowflakes schema or fact constellation schema. An important point for this multidimensional model is the data cube, which consists of large set of measures and dimensions those are entities with respect to an organization that wants to maintain records.
Online analytical processing can be performed in data marts using these multidimensional data model. The operations include roll up and drill, slice and dice, pivot and statistical operation for the efficient implementation and usage of data cube structure. [12]
The query classification related work also includes the building bridges for web query classification. Here, submission of queries to the search engines is categorized using selection mechanism. It shows the relationship between the mediator category and target category.
7.
CONCLUSION
This research paper shows adding a new layer in between data layer and bottom layer named as query classification layer. The previous architecture was a three tier architecture containing data warehouse data server layer, OLAP server and client layer for end users. We proposed a new layer in which inhabited and refreshed data is supplied. Here the extracted, cleaned, transformed, loaded, refreshed and warehouse managed data is categorized.
Adding of new layer helps in storing large amount of data and upholds high performance of the system. It supports the concurrent processing of multiple transactions. Data warehouse queries are complex and involve calculation of large data groups at summarized levels. This requires use of particular data organization, access and implementation methods based on multidimensional views. Maintenance of historic data is easily done.
Data marts detain its matter to customer, item and sales. So this data tends to be summarized. It is implemented on low cost departmental servers. Data marts are used in wide range of applications like business execution making strategic decision.
8.
FUTURE
WORK
clustering with OLAP operations as well. Data dictionary may be extended further to hold taxonomy classifier for spatial time server based warehouse etc. As meta data repository provides details regarding the warehouse structure, data history, summarization algorithms, mapping of data, system performance and factors related to business terms and issues. So features like classifier on meta data could also be added. Also structure could be resolved to n-tier for the sake of flexibility.
9.
REFERENCE
[1]. AsiyaAbdusSalam Qureshi and Syed Muhammad Khalid jamal. 2012.Web supported query taxonomy classifier. In International Journal of Computer Application., August 2012.
[2]. S. M. Khalid Jamal, Naz. A., “Dual Encrypted Global Metadata:an approach to secure metadata”, Journal of Computer Science and Engineering, volume 14, issue 2, august 2012
[3]. Christian Platzer, Clemens Kolbitsch and Manuel Egele. 2011. Removing web spam links from search engine results. In Journal in Computer Virology, Volume 7 Issue 1, February 2011, Pages 51-62, Springer-Verlag New York, Inc. Secaucus, NJ, USA.
[4]. Alessandro marchetto, filipporicca and paolotonella. 2009. An empirical validation of a web fault taxonomy and its usage for web testing. In journal of web engineering, volume 8 issue 4, december 2009, pages 316-345, rinton press, incorporated.
[5]. FabrizioSilvestri. 2010. Mining Query Logs: Turning Search Usage Data into Knowledge. In Journal of Foundations and Trends in Information Retrieval, Volume 4 Issue 1—2, January 2010 , Pages 1-174, Hanover, MA, USA.
[6]. Jihie Kim, Peter Will, S. Ri Ling and Bob Neches. 2003. Knowledge-rich catalog services for engineering design. In Journal of Artificial Intelligence for Engineering Design, Analysis and Manufacturing, Volume 17 Issue 4, September 2003, Pages 349 – 366, Cambridge University Press New York, NY, USA.
[7]. Ying Li, Zijian Zhen and Honghua Dai. 2005. KDD CUP-2005 Report: Facing a Great Challenge. In SIGKDD Explorations Volume 7.
[8]. UtkasrshSrivastava, KameshMunagala, Jennifer Widom and Rajeev Motwani. 2006. Query Optimization over Web Services. In VLDB’06 September 12-15, 2006, Seol, Korea, ACM.
[9]. Pu-Jeng Cheng, Ching-Hsiang Tsai and Chen-Ming Hung. 2006. Query Taxonomy Generation for Web Search. In CIKM’06, November 5-11, 2006 Arlington, Virginia, USA, ACM.
[10]. Joseph M. Hellerstein, Jeffrey F. Naughton. 1996 Query Execution Techniques for Caching Expensive Methods. In SIGMOD’96 6/96 Montreal, Canada, ACM.
[11]. EvgeniyGabrilovich, Andrei broder, Marcus Fontoura, Amruta Joshi and VanjaJasifovski. 2007. Classifying Search Queries Using the Web as a Source of Knowledge. In ACM international Conference on Research and Development in Information Retrieval (SIGIR) Amsterdam, Netherlands.
[12]. S. Chaudhuri,U. Dayal and T. Yan. 1995. Join queries with external text sources: Execution and optimization techbiques. In Proc. of the ACM SIGMOD Intl Conference on Management of Data,San Jose, California.
[13]. Nikos Kirtsis and Sofia Stamou. 2011. Query Reformulation for Task Oriented web searches. In Proc. of IEEE/WIC/ACM Intl conference on Web Intelligence and Intelligent Agent Technology.
[14]. Shuai Ding, Josh Attenberg, Ricardo Baeza and TorstenSuel. 2011. Batch Query Processing for web search engines. In proc. of the fourth ACM intl conference on web search and data mining
[15]. Yuchen Liu, Xiaochuan Ni, Jian Tao sun and Zheng Chen. 2011. Unsupervised transactional query classification based on webpage form understanding. In proc. of 20th ACM intl conference on Information and knowledge management.
[16]. Xianghua Fu, Dongjian Chen, XuepingGuo and Chao Wang. 2011. Query classification based on index association rule expansion. In proc of intl conference on web information systems and mining volume part 2.
[17]. Edwards, J., McCurley, K. S., and Tomlin, J. A. 2001. An adaptive model for optimizing performance of an incremental web crawler. In Proceedings of the Tenth Conference on World Wide Web (Hong Kong: Elsevier Science
[18]. S. Dessloch and N. Mattos. 1997. Integrating SQL databases with content specific search engines. In proc. of 23rdintl conference on very large database, Greece. [19]. D.Florescu, A. Levy, I. Manolescu and D.Suciu. 1999.
Query optimization in the presence of limited access patterns. In proc. of ACM SIGMOD Intl conference on Management of Data, Pennsylvania.
[20]. L. Gravano, V. Hatzivassiloglou and R. Lichtenstein. 2003. Categorizing web queries according to geographical locality. In CIKM 03: Proc of 12thintl conference on Information and knowledge management.