Database Enhancement and Analysis of Spoken Hindi
Reduplicated Words using Endpoint Detection Algorithm
Deeksha Bhatnagar
M.tech. student Department of electronics andcommunication engineering
Vikash Singh
Assistant professor Department of electronics and
communication engineering
Sandip Vijay,
PhD.HOD & professor Department of electronics and
communication engineering
ABSTRACT
Speech recognition is basically pattern classification task. It is divided mainly into two major parts. The first part is speech signal processing and the second part is speech pattern recognition technique. This paper describes the database expansion & improvement of spoken Hindi Reduplicated words. The main focus is on the analysis of Spoken Hindi Reduplicated words by using endpoint detection algorithm. The improvement is done in the robust environment. Male and female speakers are selected from different age- group to explore the acoustical variation in their utterances. Various emotions such as normal, happy, anger and surprise are taken for analysis of speech signal. Endpoint detection algorithm is used for the analysis purpose of various parameters such as total duration of time, number of samples, root mean square value and mean power (intensity) in air of speech signal.
Keywords
Spoken Hindi Reduplicated words, duration, emotion, Endpoint Detection, mean power (intensity) in air, RMS. .
1. INTRODUCTION
Speech recognition by machine is one of the most fascinating areas for research. For last several decades human beings have tried to design technologies that could recognize correct speech. While humans appear to distinguish speech very easily, they in fact make use of much acoustic, linguistic and contextual information. The relationship between the physical signal and the corresponding words is complex and poorly understood and there are many obstacles to the recognition of ‘word-form’ speech by machine. Basically speech recognition is process of automatic extracting and formative linguistic information conveyed by a speech wave using computers [1]. People are trying for developing software which can easily perceive sound, recognize and converse to the users. So the hectic assignment of processing of speech signal can be classified into three relatively smaller tasks. Speech recognition to allow machine to understand words, phrases and sentences that we speak. Natural language processing allows the machine to understand what we need, Speech synthesis to allow machines to speak. It is obvious that speech signal is one the most complex signal to deal with. In addition to the natural physiological complexity of the human production system differs from one speaker to another. The speech signal being observed is different even produced by the same speaker every time, even for numerous utterances with the same sequence of word? When somebody speaks, the linguistic content, speaker characteristics (e.g. length of vocal
tract, gender, emotions, regional origin, and identity), speaking rate and acoustic environment simultaneously influence the acoustics of the resulting spoken productivity [2-4].further sources of variability include rate of elocution, prosodic prominence, and the phonetic context in which each word is pronounced. However, listenersare able to recognize acoustically different stimuli as instances of the same word, thus extracting the similarity that exists between these different tokens, and perceiving them as members of the same category. Speech signal not only hold the meaning of a word but it will also consist the emotions which will also plays a fundamental role in speech recognition. if we want to develop robust speech systems then there is a need to examine and differentiate the emotions present in speech. If we talk about the spoken words, then it is of different type’s short words, moderate words and long words, but spoken words have a periphery over short and long words in terms of misrecognition rate, preprocessing time, calculation time and necessity of large memory space for storing speech templates. Reduplicated words have space between two words, which act as aspeech code and can play significant role in recognition process [9].
Now if we talk about the isolated word example- double then in this word no gap is available here which is a major parameter of development of protection of speech signal, while in connected or paired words example- Dur-Dur we have one gap between these two words. so here in case of connected words we have used only Hindi language in the example although gap is their between words which will provide better security comparable to isolated words, but if we use one language comparable to two or more different language then this concept will gives birth to spoken Hindi reduplicated words in which we uses words from same one language in which one word is always from Hindi language and the other is repeated and also from same language. if we use noun headed paired word which is again categorized in four types such as copulative, reduplicated, partially duplicated and hybrid type. Since this gives birth to the reduplicated paired word. Reduplication in linguistics is a morphological process in which the root or stem of a word (or part of it) is repeated exactly. When both parts have same meanings and are meaningful, then reduplication is called a complete reduplication.
is being repeated and from same language the gap between these two words will act like a speech code and it is also same due to the use of only one language. There are several advantages of reduplicated words over other words such as information content is more, security level is high and recognition rate is high. Here we are also doing emotion analysis to see the acoustical discrepancy of utterances of male and female speakers from different age-group. Endpoint detection algorithm is used here for the analysis purpose. Endpoint detection is also called voice activity detection. In which we will focus on speech portion in a .wav file, basically we will remove the noise content in the particular file. Results comparing humans to machines are presented with four important goals. These are to encourage research in directions that will decrease the human-machine performance gap, to encourage further human-machine comparisons, to promote further experimental work with human listeners to understand how humans familiarize to speaker and environmental variability, and to encourage a multi-disciplinary dialog between machine recognition and speech awareness researchers [5-7].
The rest of the paper is organized as follows. Database development and proposed algorithm are explained in section II. Experimental results are presented in section III. Concluding remarks are given in section IV.
2. DATABASE DEVELOPMENT AND
PROPOSED ALGORITHM
Twenty-five words are used for the database purpose of spoken Hindi reduplicated words; some of them are Dur-Dur, Kaanv-Kaanv, Gaon-Gaon, Ghar-Ghar, Tukar-Tukar, Hi-Hi, Paas-Paas etc. four male speakers and four female speakers from different age-group participated in recording session. Male speakers and female speakers from different age groups between (10-20), (20-30), (30-40), (40-50), (50-60). Normal, happy, anger and surprise modes are taken for recording session. Stereo headset h 250 with frequency response 20 Hz-20 KHz, input impedance of headset is 32 ohm while input sensitivity of microphone is 2.2kohm.11025 Hz sampling frequency with 16bitPCM, mono selected for storing .wav files direct to the computer.
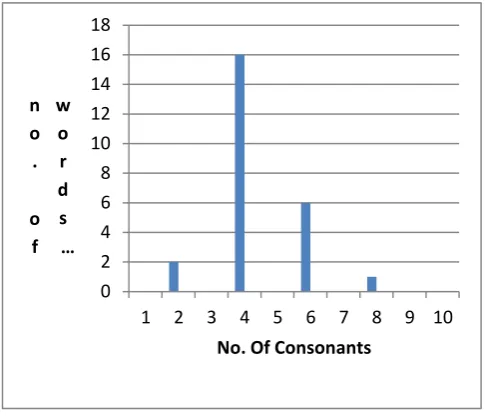
Fig-1 No. of Words versus No. of Consonants
Database contains 2000 utterances, simulated in 4 emotions by 8 speakers. This database is enough to analyze the emotions in view of speaker, gender, and text and session variability [8]. Broad acoustic classification has done on the basis of consonants and vowels; ex Dur-Dur contains CVC-CVC. Fig-1 illustrates the no. of consonants present in the word. There are 16 words which contain 4 consonants and they are majority in database comparable to other words. That’s why one word Dur-Dur picked up from that group of 16 words for analysis purpose [6].
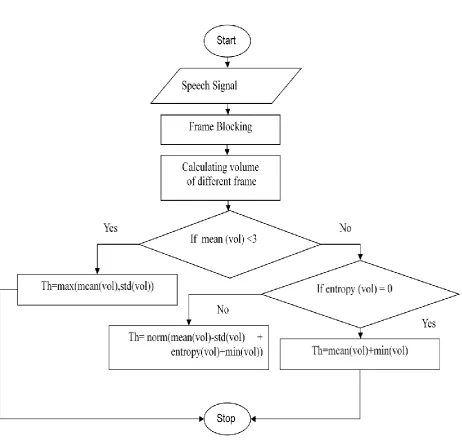
Figure-2 shows a block diagram of a usual endpoint detection process. Input speech signals are segmented into frames using window function and parameters such as energy and zero-crossing rates are extracted. During then on speech period of several milli-seconds, a few background thresholds are calculated, which are adjusted constantly using the following non speech frames. Each frame is classified into speech and non-speech using the background thresholds. then volume of each different frames is being calculated. Now if mean(volume) is less than numeric value 3 then threshold is calculated by taking maximum value of mean(volume) or standard deviation(volume). If its vice–versa than entropy is being calculated.now if entropy(volume) is equal to zero then threshold is calculated by adding mean(volume) and minimum(volume). if entropy(volume) is not equal to zero then threshold is calculated by taking normal of [subtracting standard deviation(volume) from mean(volume) and adding the entropy(volume) and minimum(volume)].
0 2 4 6 8 10 12 14 16 18
1 2 3 4 5 6 7 8 9 10
n o .
o f
w o r d s …
[image:2.595.315.558.71.279.2]Fig- 2 The block diagram of general endpoint detection algorithm
3. EXPERIMENTAL RESULTS
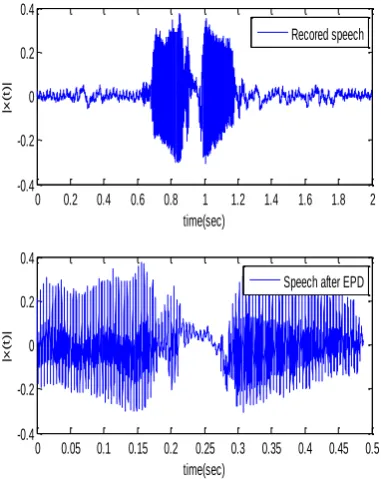
Matlab 7.9.0 and Pratt version 5.3 software platform is use to perform the experiment. figure 3(a) & figure 3(b) shows the normal speech waveforms and end point detected waveforms of male and female speakers in normal modes respectively.
Fig-3(a) male speaker 1 in normal mode, waveform of word Dur-Dur in original form and after end point
detection
Fig-3(b) female speaker 1 in normal mode, waveform of word Dur-Dur in original form and after end point
[image:4.595.314.547.130.347.2]detection
Table 1 Comparison of various parameters of male speakers in different emotions (average values)
S. N
Param eters
Without using End Point Detection
Using End Point Detection
Modes Modes
Nor mal Ha pp y An ger Sur pris e Nor mal Ha pp y An ger Sur pris e 1 Time
durati on(sec) 1.97 48 1.7 006 1.7 116 2.63 6
0.95 0.8 3
0.6 56
0.79 53
2 Numb
er of sample s 217 73 187 50 188 71 2906 3 104 32 915 2 72 32 8768
3 Root mean square (Pascal ) 0.01 77 0.0 198 0.0 331 0.05 3
0.07 0.0 74
0.1 33
0.09 28
4 Mean Power (intens ity) in air(dB ) 58.6 97 59. 395 63. 94 66.3 5
66.7 68. 25
75. 31
70.9 75
Table 2 Comparison of various parameters of female speakers in different emotions (average values)
S. N o Para meter s
Without using End Point Detection
Using End Point Detection
Modes Modes Nor mal Ha pp y An ger Sur pris e Nor mal Ha pp y An ger Sur pris e 1 Time
durati on (sec) 2.90 05 3.0 6 2.6 4 3.12 3
1.05 0.9 23
0.7 95
1.07 97
2 Numb
er of sampl es 319 89 337 34 29 09 3 3442 9 115 20 101 76 87 68 1190 4
3 Root mean squar e (in Pascal ) 0.02 3 0.0 24 0.0 33 0.02 6
0.05 0.0 48
0.0 56
0.05 05
4 Mean Power (inten sity) in air in db) 59.9 7 60. 51 63. 31
61.5 64.4 65. 28
67. 45
66.0 73
0 0.5 1 1.5 2 2.5 3
-0.4 -0.2 0 0.2 0.4 time(sec) |x ( t ) | Recored speech
0 0.1 0.2 0.3 0.4 0.5 0.6 0.7 0.8
-0.4 -0.2 0 0.2 0.4 time(sec) |x ( t ) |
Speech after EPD
0 0.2 0.4 0.6 0.8 1 1.2 1.4 1.6 1.8 2 -0.4 -0.2 0 0.2 0.4 time(sec) |x ( t ) | Recored speech
0 0.05 0.1 0.15 0.2 0.25 0.3 0.35 0.4 0.45 0.5 -0.4 -0.2 0 0.2 0.4 time(sec) |x ( t ) |
[image:4.595.64.261.153.411.2] [image:4.595.314.548.405.700.2] [image:4.595.68.259.483.723.2]Table 3) Increment (↑) and Decrement (↓) of all parameters after using end point detection in case of
Male speakers (all values are in percentages)
S.No Parameters MODES
NORMAL
52.093(↓) 51.194(↓) 61.677(↓) 69.831(↓)
2 No. of
samples
52.088(↓) 51.19(↓ 61.687(↓ 69.831(↓)
3 RMS (in
Pa.)
296.74(↑) 274.75(↑) 300.33(↑) 76.667(↑)
4 MPI(indb) 13.57(↑) 14.904(↑) 17.78(↑) 6.979(↑)
Table 4) Increment (↑) and Decrement (↓) of all parameters after using end point detection in case of
Female speakers (all values are in percentages)
S.No Parameters MODES
NORMAL HAPPY ANGER SURPRISE
1. TD (in sec) 63.976(↓) 69.834(↓) 69.86(↓) 65.42(↓)
2. No. of
samples
63.98(↓) 69.834(↓) 69.86(↓) 65.425(↓)
3. RMS (in
Pa.)
100.99(↑) 99.59 (↑) 65.90(↑) 96.73(↑)
4. MPI(indb) 7.39(↑) 7.88(↑) 6.539(↑)) 7.44(↑)
4.CONCLUSION
We describe the database development of Spoken Hindi Reduplicated Words and analysis of word Dur-Dur using EPD algorithm. The result shows average reduction of 58.70% and 58.69% in Time Duration and Number of samples, while average enhancement of 237.12% and 13.30% in RMS and MPI values respectively for Male speakers for all four emotions. For female speakers average reduction is 67.27% both for Time Duration and Number of samples and average enhancement is 90.80% and 7.37% for RMS and MPI values respectively for all four emotions. Average reduction is high in female speakers comparable to male speakers so it is a good result, but average enhancement is higher in male speakers comparable to female speakers. So processing time will be reduced because TD and No. of samples reduced more than 50% both for Male and Female speakers.
Information content increases due to the enhancement in RMS and MPI values for both speakers. So there is possibility to further reduce the TD and No. of
samples of male speakers
comparable to female
speakers and to enhance the RMS and MPI values of female speakers comparable to male speakers. It may be the future scope of work by using different voice activity detection algorithms and by increasing database.
5. REFERENCES
[1] D. K. Freeman, G. Cosier, C. B. Southcott, and I. Boyd, “The voice activity detector for the Pan-European digital cellular mobile telephonservice”, in Proc. Int. Conf. Acoust., Speech, Signal Processing, Glasgow, U.K., May 1989, pp. 369–372.
[2] M.J. Hunt, M. Lennig and P. Mermelstein, “Experiments in syllable-based recognition of continuous speech”, Proc. IEEE Intl.Conf. Acoustics, Speech & Signal Processing, Denver, 1980, pp.880-3.
[3] L.R. Rabiner and B.H. Juang, B. Yegnanarayana, Fundamentals of speech Recognition, 1st edition, Pearson education in south Asia, 2009.
[4] R. Cowie and R. R. Cornelius, “Describing the emotional states that are expressed in speech”, speech communication, vol. 40, Apr. 2003, pp. 5-32.
[5] L.R. Rabiner, R.W. Shafer, Digital Processing of Speech Signals, 3rd edition, Pearson education in south Asia, 2009.
[6] V. Kumar, “A statistical approach towards the recognition of Hindi language words”, inria 00114544, ver. 1, 2006, pp. 1–5.
[7] H. Özer, “Signal detection and estimation in nonstationary background”, M.S. thesis, Dept. Elect.
Electron. Eng., Bas¸kent Univ., Ankara,
Turkey,Aug1998.
[8] L. Yang, “The expression and recognition of emotions through prosody”, in Proc. Int. Conf.Spoken Language Processing, pp. 74–77, 2000.
[9] Dinesh Kumar Rajoriya, R.S. Anand, R.P. Maheshwari, “Spoken Paired Word Pattern Classification Using Whole Word Template”,TECHNIA- Intl. J. of Computing Science and Communication Technologies, vol.3, no.2,Jan. 2011, pp. 590-3.
[10] R. Tucker, “Voice activity detection using a periodicity measure”, Proc.Inst. Elect. Eng., vol. 139, pp. 377–380, Aug. 1992.