Data Warehouse Implementation of Examination
Databases
Muheet Ahmed Butt
Scientist Directorate of Information Technology & Support Systems, University ofKashmir, Srinagar, J&K, India
S. M. K. Quadri
Head & Director, PG Department of Computer Science, University of Kashmir,Srinagar, Srinagar, J&K, India
Majid Zaman
Scientist Directorate of Information Technology & Support Systems, University ofKashmir, Srinagar, J&K, India
ABSTRACT
A data warehouse is an asset for an enterprise and exists for the benefit of an entire enterpriseincluding business unit, individual customer, Student etc.Data in a data warehouse does not conform specifically to the preferences of any single enterprise entity. Instead, it is intended to provide data to the entire enterprise in such a way that all members can use the data in the warehouse throughout its lifespan [7]. This work explores using the star schema forAutomation of a Data Warehouse. An implementation of a data warehouse for an Examination Automation System is presented as an example.
General Terms
Data Warehouse, Star Schema, Examination Databases, Third Normal Form, Normalization, Dimension, Snowflake, Joins, Decision Support.
Keywords
Data Warehousing, Data Mining, Third Normal Form, Data Set.
1.
INTRODUCTION
A 'data warehouse' is a repository of an organization's electronically stored data. Data warehouses are designed to facilitate reporting and analysis [5].This classic definition of the data warehouse focuses on data storage. However, the means to retrieve and analyze data, to extract, transform and load data, and to manage dictionary data are also considered essential components of a data warehousing system [11]. These operations depend more on the way the data is stored..
There are two leading approaches to storing data in a data warehouse
i. Dimensional approach and ii. Normalized approach
In the dimensional approach, transaction data are partitioned into "facts", which are generally numeric transaction data, and"dimensions", which are the reference information that gives context to the facts [9]. A key advantage of a dimensional approach is that the data warehouse is easier for the user to understand and to use. The retrieval of data from the data warehouse also tends to operate very quickly. The main disadvantages of the dimensional approach are:
i. in order to maintain the integrity of facts and dimensions, loading of data from different operational systems is complicated, and
ii. it is difficult to modify the data warehouse structure if the organization adopting the dimensional approach changes the way in which it does business.
In the normalized approach, the data in the data warehouse are stored following, to a degree, the Codd normalization rule. Tables are grouped together by subject areas that reflect general data categories. The main advantage of this approach is that it is very easy to add information into the database. A disadvantage of this approach is that because of the number of tables involved, it can be difficult for both users to join data from different sources into meaningful information and then access the information without a precise understanding of the sources of data and of the data structure of the data warehouse.
2. SCHEMAS IN DATA WAREHOUSE
A schema is a collection of database objects, including tables, views, indexes, and synonyms. There is a variety of ways of arranging schema objects in the schema models designed for data warehousing. The main database Schemas are:
2.1 Star Schemas
The star schema is perhaps the simplest data warehouse schema. It is called a star schema because the entity-relationship diagram of this schema resembles a star, with points radiating from a central table [6]. The center of the star consists of a large fact table and the points of the star are the dimension tables.A star query is a join between a fact table and a number of dimension tables. Each dimension table is joined to the fact table using a primary key to foreign key join, but the dimension tables are not joined to each other. The optimizer recognizes star queries and generates efficient execution plans for them. It is not mandatory to have any foreign keys on the fact table for star transformation to take effect. A star join is a primary key to foreign key join of the dimension tables to a fact table. The main advantages of star schemas are that they:
Provide a direct and intuitive mapping between the business entities being analyzed by end users and the schema design.
Provide highly optimized performance for typical star queries.
Are widely supported by a large number of business intelligence tools, which may anticipate or even require that the data warehouse schema contain dimension tables.
Star schemas are used for both simple data marts and very large data warehouses.
3. SNOWFLAKE SCHEMAS
The snowflake schema is a more complex data warehouse model than a star schema, and is a type of star schema [6]. It is called a snowflake schema because the diagram of the schema resembles a snowflake. Snowflake schemas normalize dimensions to eliminate redundancy i. e., the dimension data has been grouped into multiple tables instead of one large table. While this saves space, it increases the number of dimension tables and requires more foreign key joins. The result is more complex queries and reduced query performance. The main advantages of Snowflake schemas are that they:
save memory space for data.
increases the number of dimension tables and requires more foreign key joins.
the result is more complex queries.
3.1Third Normal Form (3NF)
Third normal form modeling is a classical relational-database modeling technique that minimizes data redundancy through
Provide a neutral schema design, independent of any application or data-usage considerations
May require less data-transformation than more normalized schemas such as star schemas
4. DATA WAREHOUSE DESIGN
An example of a record in a fact table for an Examination Automation System for a University, on a single event,such as a result of a Student at a particular session of an Academic year at Under/Post Graduate Level, has been considered.
In addition to the fact tables Table 1, there are also dimension tables in the database. These dimension tables describe the options to "cut" or view the data in the fact table. The star and snowflake schemas all use more than one dimension table in their database [2][3]. The records in a single dimension table represent the levels or choices of aggregation for the given dimension [7][17]. The classic data warehouse example used is the Result dimension[10][12]. The records in the Result dimension table will indicate that the fact table data can be aggregated by Subjects assigned, Enrollment of Students, Marks Obtained etc. Another dimension would be date. Using the date dimension we would be able to analyze data by a single date or dates aggregated by month, quarter, fiscal year, calendar year, holidays, etc.
[image:2.595.303.551.431.674.2]For an Examination Automation System, a simple fact table would have the following column variables is show in table below.
Table 1: Fact Dimension Details fact_DIM
ROLLNO key Rollno Pertaining
to a Session Numeric REGNO key Registration No. of
Student Alphanumeric
RESULT Calculated Result Alphanumeric
TOTALM Total Marks Numeric
RESGAZ Showing Statue
Result Alphanumeric
Sesson_ID Key Session of
Examination FKey Alphanumeric college_id Key College Code FKey Alphanumeric dateID Key Date FKey Alphanumeric course_code Key Course Opted FKey Alphanumeric facultyID Key Faculty Opted
FKey Alphanumeric
groupID Key Subject Group
Table FKey Alphanumeric
key made up of the group of the dimensions. In addition, the fact table usually contains additional variables which typically are additive numbers, i.e., numericfacts. In our Examination Automation System example the individual dimension table would capture views by:
Enrollment containing registration no, name and parentage
Subjects taken by the student Student enrolled in the course Marks obtained in every subject Date of declaration, session, year College information
Course information Faculty details etc.
For the full star schema of Examination Automation System see Appendix 1 at the end of the paper.
6. USING THE STAR SCHEMA FOR
BUILDING DATASETS
Users of the Examination Automation System will want tolook at the data summarized to various levels. Joining selected dimension tables to the fact table will provide the user with a dataset on which to aggregate the needed information [1]. For example, to generate the result of the student would require a the join of five tables namely Fact Table, EnrollmentDimension Table, CourseDimension Table , subject_groupsDimension Table and marksDimension Table. The resultant data file will then be aggregated by using the Proc Summary step to produce a dataset for analysis. Below is a demonstration of this approach.
[image:3.595.305.549.147.345.2]An Examination Automation System of 2500000 records in the fact table with 12 column variables, totaling to 30 megabytes of space. The memory taken by the dimension tables are depicted in table below.
Table 2: Dimension Table records in Megabytes DIMENTION NAME SIZE
Enrollment 176.388 MB
Subject 0.056 MB
Marks 150.5 MB
Course 0.020 MB
College 0.008 MB
Date 0.015 MB
Faculty 0.012 MB
Group 0.095 MB
Session 0.010 MB
Total Space 327.10 MB
6.1 GENERATING THE FINAL RESULT
NOTIFICATION
An algorithm was devleloped and code implemented in SQL using SQL Server Management Studio Express as Front end and Microsoft SQL 2005 at the back end for testing the described schema. The results of the simulationare presented in table below.
Table 3: Client Statistics for the above query resulted in the following details.
Client Statistics Information Trial 3 Trial 2 Trail 1 Average
Client Execution Time 20:25:51 20:25:46 20:25:36
Query Profile Statistics
Rows returned by SELECT statements 27453 27453 27453 27453
Network Statistics
Number of server roundtrips 3 3 3 3
TDS packets sent from client 3 3 3 3
TDS packets received from server 1974 1974 1974 1974
Bytes sent from client 2220 2220 2220 2220
Bytes received from server 8074601 8074601 8074601 8074602
Time Statistics
Client processing time 551 568 817 645.3333
Total execution time 859 861 1127 949
[image:3.595.47.508.477.699.2]7. BUILDING THE DECISION SUPPORT
DATABASE
Similarly, other datasets could be generated for analysis. Using the building blocks of the fact table and the various dimension tables, one has thousands of ways to aggregate the data. For expedient analysis purposes, frequently needed aggregated datasets should be created in advance for the users [15][16]. Having data readily and easily available is a major tenet of data warehousing. For Examination Automation System, some aggregated datasets were:
Generating the Final Result Notification per Subject, College, Subject Groups, Year Wise, Gender etc.
Remuneration for Paper Checkers, Checking Assistants and other Officials.
Students Count by Age, Gender, Pass, Fail, Reappear in subject pertaining to per college, subject, year, group of subjects.
Interests of Various of Students in Courses, Colleges, Subjects etc and Improvements to be made in the Education System etc.
No of Students enrolled for a particular course, subject, college, courses within a college, subject within a college.
Students who have passed with and without statues. Percentage of result, subject wise, college wise,
course wise, group wise.
As one can see, the Star Schema lends itself well forCustom analysis.
8. OLAP AND DATA MINING
On-line Analytical Processing (OLAP) is theanalytical capabilities provided by the data warehouse or data mart. One can view granular data or variousaggregations of data for business analyses using graphical-user-friendly tools [4][18]. Data warehouse and data marts exist to answer questions and find business opportunities. There are many ways to analyze data using procedures such as ProcdecodeMks, ProcgetResult, Procfmaster, Procrollidx, Proc Tabulate. Finally, data mining is the name given to newer statistical techniques used to explore voluminous data stores. These techniques include decision trees and neural networks. These methods, like neural networks, can sometimes handle co-linearity better than the older statistical techniques.
9. COMPARISON WITH 3RD NORMAL
FORM
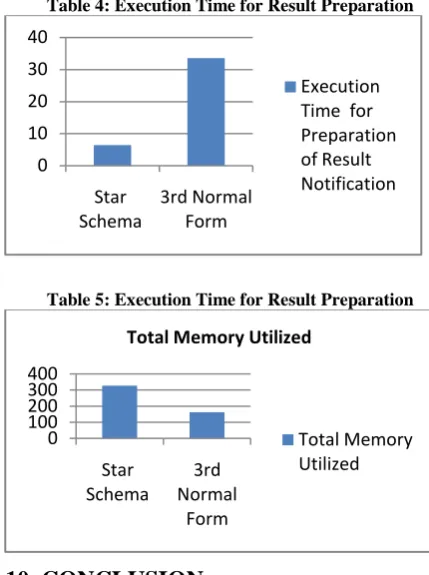
[image:4.595.313.528.76.364.2]A comparative study was also performed by taking same amount of test data and the observations were tabulated in the below mentioned table. It was observed that there was a big tradeoff between the memory and the speed in the implementation of 3rd Normal form and Star Schema.
Table 4: Execution Time for Result Preparation
Table 5: Execution Time for Result Preparation
10. CONCLUSION
The data warehousing technology i s gaining wide attention, and many organizations are building data warehouses (or, data marts) to help them in data analysis in decision for decision support. Data Warehousing is a newly emerged field of study in Computing Sciences. Due to its viz. multidisciplinary nature, it has overlapping area of studies in three different computing disciplines. This overlapping sometimes may cause contradictory definitions for a specific concept. To overcome this problem of data warehousing for Examination Automation System,it was considered for Star Schema Design. In this regard various functionaldimensions of the Examination System were designed and connected to a Fact Transaction Dimension. Furthermore the general issues like the Client Statistics and Query Design were taken up and various Decision Support Databases weredesigned and implemented using the same star Schema.
11. REFERENCES
[1] A. Gupta, V. Harinarayan, and D. Quass. Aggregatequery processing in data-warehousing environments. In Proc. 21th Int. Conf. on Very Large Data Bases, Zurich, Switzerland, 1995.
[2] ACM/ IEEE-CS Joint Task Force for Computing Curriculum 2005. “Computing Curriculum 2005”. The Over view report” 30 Sep, 2005
[3] C. Fahrner, and G. Vossen. A survey of database transformations based on the Entity-Relationship model. Data & Knowledge Engineering, vol. 15, n. 3, pp. 213-0
10 20 30 40
Star Schema
3rd Normal Form
Execution Time for Preparation of Result Notification
0 100 200 300 400
Star Schema
3rd Normal
Form
Total Memory Utilized
[6] Fon Silvers, “Building and Maintaining a Data Warehouse,” AN AUERBACH BOOK”, CRC Press is an imprint of the Taylor & Francis Group, an informa business
[7] Jeff Lawyer, ShamsulChowdhury, “ Best Practices in Data Warehousing to Support Business Initiatives and Needs”, Proceedings of the 37th Hawaii International Conference on System Sciences – 2004
[8] Jorge Bernardino, Pedro Furtado, Henrique Madeira,” A Cost Effective Approach for Very Large Data Warehouses”, Proceedings of the International Database Engineering and Applications Symposium, 2002 [9] Kimball, Ralph, “The Data Warehouse Toolkit: Practical
Techniques for Building Dimensional Data Warehouses”, John Wiley & Sons, Inc, 1996.
[10]Krishna. “Principles of Curriculum Design and Revision: A Case Study in Implementing Computing Curricula CC2001”. ITiCSE’05, June 27–29, 2005
[11]Larry, Greenfield, LGI Systems Inc., "The Data Warehousing Information Center," 1997 pp http://pwp.starnetinc.com/larryg/index.html.
[12]LIN Yu,etc, “The Principles and Applications of Data Warehouse [M]”, Posts & Telecommunications Press, 2003.1
[13]R. Barquin, and S. Edelstein. “Planning and Designing, the Data Warehouse”,. Prentice Hall, 1996.
[14]REN Jinluan, GU Peiliang, ZENG Zhenxiang, “Research on the Methods of Designing Data Structure of Data Warehouse [J]”. Computer Engineering and Applications, 2001.22.
[15]SvetlozarNestorov, NenadJukic, “Ad-Hoc Association-Rule Mining within the Data Warehouse”, Proceedings of the 36th Hawaii International Conference on System Sciences, 2002
[16]Syed Najam-ul-Hassan, MaqboolUddinShaikh, UzairIqbalJanjua,” Data Warehousing an Academic Discipline “Curriculum Development Approach, Methodologies and Issues”, 2006
[17]Wu Shuning, Cui Deguang, Cheng Peng ,”The Four-stage Standardized Modeling Method in Data
[18]Warehouse System Development” Proceedings of the IEEE International Conference on Mechatronics & Automation Niagara Falls, Canada • July 2005
Appendix 1
college_DIM
college_name college_id yearEstab street district contactno
course_DIM
course_code course_des noofyears
date_DIM
date_ID date FullDateDesc dayofWeek CalendarMonth
fact_DIM
ROLLNO REGNO RESULT TOTALM RESGAZ sesson_ID college_id dateID course_code facultyID groupID
faculty_DIM
facultyID faculty_desc
group_DIM
groupID group_des sub1 sub2
sess_DIM
session_id session_des year
subject_DIM
NAME CODE THMAX THMIN PRMAX PRMIN PRMINI PRMINE NTP
enroll_DIM
MM REGNO SNO COLLEGE NAME FNAME
mks_DIM