How single cells sense Smad3 signal
Thesis by
Christopher Lee Frick
In Partial Fulfillment of the Requirements for the Degree of
Doctor of Philosophy
CALIFORNIA INSTITUTE OF TECHNOLOGY Pasadena, California
2019
© 2019
Christopher Lee Frick ORCID: 0000-0001-6823-5920
iii
ACKNOWLEDGEMENTS
The list of people to thank is long, but I will hopefully keep this acknowledgement
short. I would first like to thank, Lea, who consistently inspires me to both think
bigger and be more concise. I would also like to thank the members of the lab
who offered provided frequent helpful discussions: Kibeom Kim, Harry Nunns, and Noah Olsman. I would like to thank the rest of the lab during my time here
(Mike Abrams, David Gold, Ty Basinger, Andrew Liu, and Mengsha Gong) for their
friendship and support. I would like to draw attention to the work done by Laura
Ratliff for this project as well. During her high school internship, Laura successfully
cloned CRISPR plasmids that were used in the generation of endogenous Smad3
clones.
A big thank you is deserved as well by the Caltech Flow Cytometery and Cell Sorting Facility. Rochelle Diamond, Diana Perez, Jamie Tijerina, and Patrick Cannon—
thank you for the hours of cell sorting. A big thanks as well to the many members of
many other Caltech labs who took time out of their busy research to help train me:
Zakary Singer, Eric Lubeck, and Long Cai for training in single molecule FISH;
Yaron Antebi for his time training me in developing cell tracking software; and
James Linton, for being a constant resource of scientific wisdom.
To my collaborators, Felix Dietrich and Yannis Kevrekidis, thank you for the
incred-ible hard work you have poured into this project. You have both been a joy to work with and never cease to teach me new things. I would also like to thank my thesis
committee for their support and direction, which I believe have greatly improved the
quality and presentation of the work herein described.
Finally, I would like to thank my friends and family for their continued support,
en-couragement and prayers. The last leg of this thesis has been particularly demanding
and would not have been possible without your help. Mom and Dad, thanks for your
love and support. To Courtney, my wife, thank you for cheering for me, for making
countless sacrifices for me during the last seven years, and for changing all of the diapers I missed while working long hours in lab. You are a constant source of joy
and courage. And to Eli and Charlotte, thank you for joy and love. Dad loves you
ABSTRACT
Animal cells possess the remarkable ability to send, receive, and respond to
molec-ular signals. Accurate processing of these signals is essential for the development
and maintenance of complex cell fates and organization. The regulation of cell
behavior in response to signal is mediated by signal transduction pathways, which are highly conserved protein-protein interaction networks. Recent work has shown
that the activation of biomolecular networks is highly sensitive to natural cellular
variation in protein levels, making it unclear how these pathways accurately and
reliably transmit signals in single cells. In this thesis, I address this question in the Transforming Growth Factor-β(Tgf-β) pathway, a major intercellular signaling pathway in animal cells. First, we asked whether extracellular signal is accurately
transduced into pathway activation in single cells. Examining pathway dynamics in
live reporter cells, we found evidence for fold-change detection. Although the level
of nuclear Smad3 varied across cells, the fold change in the level of nuclear Smad3 was a more precise outcome of ligand stimulation. Indeed, by measuring Smad3
dynamics and gene expression in the same cells, we confirm that the fold-change in
Smad3 carries signal in the pathway. These findings suggest that cells encode Tgf-β signal in a precise Smad3 fold-change as a strategy for coping with cellular noise.
Second, we brought two significant advancements, which enabled us to ask how
tightly signaling dynamics dictates target gene expression. By imaging endogenous
dynamics of both signaling and gene expression in clonal cells, and correlating the
full dynamics with a nonlinear manifold learning approach, we show that knowing
the full dynamics of Smad3 is necessary but not sufficient to predict the full dy-namics of target gene expression. Indeed, we find evidence for the role of mTOR,
MEK5, and cell cycle as cell-specific variables that influence how a cell responds to
Smad3. This demonstrates the extent to which, even across clonal cells, response to
signal considerably varies, as each cell computes decisions based on its own internal
v
PUBLISHED CONTENT AND CONTRIBUTIONS
Frick, Christopher L, Clare Yarka, Harry Nunns, and Lea Goentoro (2017). “Sensing relative signal in the Tgf-β/Smad pathway”. In: Proceedings of the National
Academy of Sciences, p. 201611428. doi:10.1073/pnas.1611428114.
TABLE OF CONTENTS
Acknowledgements . . . iii
Abstract . . . iv
Published Content and Contributions . . . v
Table of Contents . . . vi
List of Illustrations . . . vii
List of Tables . . . ix
Chapter I: Introduction . . . 1
1.1 The language of cell-cell communication . . . 1
1.2 How to ensure precision in signal transduction? . . . 2
1.3 Dynamics matter . . . 3
1.4 Robustness is encoded in dynamic features of signaling . . . 4
1.5 Tgf-βpathway function and architecture . . . 5
1.6 The need for a quantitative understanding of Tgf-β/Smad signaling in single cells . . . 6
Chapter II: Sensing relative signal in the Tgf-β/Smad pathway . . . 8
2.1 Introduction . . . 8
2.2 Results . . . 10
2.3 Discussion . . . 19
2.4 Supplementary Figures . . . 25
2.5 Materials and Methods . . . 33
2.6 Supplementary Tables . . . 37
Chapter III: A cell’s response to Smad3 signal depends on its internal state . . 40
3.1 Introduction . . . 40
3.2 Results . . . 42
3.3 Discussion . . . 55
3.4 Supplementary Figures . . . 63
3.5 Materials and Methods . . . 76
Chapter IV: Conclusions . . . 83
vii
LIST OF ILLUSTRATIONS
Number Page
1.1 Schematic showing the general structure of a signaling pathway . . . 2
1.2 Signal from ligand is transduced into an intracellular signal . . . 4
2.1 Ligand-induced nuclear accumulation of NG-Smad3 . . . 11
2.2 Fold change in nuclear NG-Smad3 is a more precise response to
ligand stimulation . . . 13
2.3 Higher precision of fold-change response holds across doses of Tgf-β 14 2.4 Fold-change response has higher information transduction capacity . 16 2.5 Expression of target genes correlates more strongly with the fold
change in nuclear NG-Smad3 . . . 18
2.6 Smad signal in the Tgf-βpathway is sensed in a relative manne . . . 20
2.7 Immunofluorescent staining reveals overlap of the Smad3 level in
unstimulated and stimulated cells . . . 25
2.8 Characterization of the NG-Smad3 construct . . . 26
2.9 Higher precision of fold-change response is reproducible across
ex-periments and clonal lines . . . 27
2.10 Smad3 responses to stimulation are statistically different from un-stimulated cells . . . 28
2.11 Fold-change response is more precise and has higher information
capacity throughout the duration of signaling . . . 29
2.12 Expression of wnt9a correlates more strongly with fold change in
nuclear NG-Smad3 . . . 29
2.13 Mathematical model of Tgf-β pathway predicts fold-change robust-ness to parameter variation . . . 30
2.14 Mutual information computed with dynamic measurements. (A)
Il-lustration of dynamic measurement . . . 31 2.15 MOVIE: NG-Smad3 cells treated with Tgf-β1 . . . 32 3.1 To what extent does signal dictate a cell’s response? . . . 40
3.2 Quantifying input-output dynamics in the Tgf-βpathway in single cells. 42
3.3 Correlation between endogenous input and output dynamics in the
3.4 Manifold learning to uncover dimensionality of the input-output
dy-namics . . . 48 3.5 The NG-Smad3 manifold can not accurately predict thesnail:mCherry
manifold . . . 49
3.6 Identification of cellular variables that influence how a cell activates
Snail in response to Smad3 . . . 51
3.7 Combining intracellular signal and specific intrinsic variables lead to
better prediction of gene output. . . 54
3.8 Characterization of NG-Smad3 clones . . . 63
3.9 Characterization of snail:mCherry in candidate double reporter clones. 64
3.10 Testing for correlation between dynamics of NG-Smad3 andsnail:mCherry 65 3.11 A second clone also shows weak correlation between dynamics of
NG-Smad3 andsnail:mCherry . . . 66
3.12 The trajectories of NG-Smad3 colored by their manifold coordinate
value . . . 67
3.13 The trajectories of snail:mCherry colored by their manifold
coordi-nate value . . . 67
3.14 Diffusion Maps analysis obtains a good manifold for NG-Smad3 in
second experiment. . . 68
3.15 Diffusion Maps analysis obtains a good manifold for snail:mCherry in second experiment. . . 69
3.16 Simulations of Tgf-β/Smad model to validate our manifold learning
and gaussian process approach . . . 70
3.17 Including Tgf-βdose information in GP regression does not improve prediciton of Snail . . . 71
3.18 List of drugs and agonists tested . . . 72
3.19 Correct identification of hidden variable restores manifold prediction
accuracy . . . 73
3.20 Dynamics of NG-Smad3 and snail:mCherry in response to treatment with U0126 . . . 73
3.21 Dynamics of NG-Smad3 and snail:mCherry in response to treatment
with Rapamycin . . . 74
3.22 Dynamics of endogenous NG-Smad3 and snail:mCherry in single cells 74
3.23 Example of quantification of NG-Smad3 and snail:mCherry
ix
LIST OF TABLES
Number Page
2.1 Correlations, z-scores, and p-values from Steiger’s Z test for Figures
2.5 and 2.12. . . 37
C h a p t e r 1
INTRODUCTION
1.1 The language of cell-cell communication
In 1924, Spemann and Mangold made a remarkable discovery—cells communicate
with one another (Spemann and Mangold, 1924). Studying amphibian development,
they found that the development of an embryo into an adult organism depends on
a small region of tissue known as an organizer. If this tissue is transplanted to
the other side of an embryo, it induces dorsoanteriorization on that side, resulting
in a two-headed tadpole. The presence of a specific set of cells determines the
developmental fate of surrounding cells. It was thus shown that information can
be transferred from one cell to another, and that this process of communication
facilitates the breathtaking process of animal development. The nature of the signal being transferred and how this signal’s instructions were read and responded to,
however, were not yet known.
Nearly half a century later, laborious efforts of geneticists and biochemists had
uncovered that communication between cells is mediated by networks of proteins.
Information (signal) in these networks is propagated from one molecule to another.
Extracellular signals (commonly referred to as ligands) bind to receptors on receiving
cells. These receptors activate proteins within the cell that participate in a network
of interactions, known as a signal transduction network, which generally culminate in activation of a transcription factor to effect changes in gene expression (Figure
1.1). Individual single cells, therefore, possess the machinery to receive and respond
2
Figure 1.1: Schematic showing the general structure of a signaling pathway. Ligand binds to receptors at the cell surface, activating the intracellular signal transduction network, which culminates in changes in gene expression mediated by the pathway transcription factor.
At the early stages, the logic of cellular communication appeared straightforward.
Similar to words in a human language, different ligands give different instructions.
The discrete biochemical differences between these secreted molecules lead to
in-teraction with different receptors and thus activation of different signal transduction pathways. A further layer of complexity was added when it was discovered that the
instruction a ligand conveys can depend on the identity of the receiving cell—the
same signal will give different responses in different cell types.
1.2 How to ensure precision in signal transduction?
Another layer of complexity appeared when it was discovered that signal transduction
pathways derive meaning not just from the identity of the ligand, but also its quantity.
The response of one given cell type to a ligand can depend on the concentration of
that ligand the cells are exposed to. For example, it has been shown that the Tgf-β pathway can distinguish at least five different concentrations of Activin ligand in
Xenopus embryo cells—the five concentrations lead to different cellular outcomes–
specification of epidermis, posterolateral mesoderm, muscle, notochord, and neural inducing organizer tissue (Green, New, and Smith, 1992). Analysis showed that
upon exposure to increasing ligand concentration, the activation of the
Activin-dependent transcription factor, Smad2, increased proportionally, suggesting a simple
model in which cell responses are determined by signal crossing multiple defined
thresholds.
that the question of precision arose. The urgency of answering this question became
apparent when it was discovered that protein concentrations, even in mammalian cells, are highly variable and fluctuating (Sigal et al., 2006). The approaches to study
cell signaling at the time – utilizing using bulk analyses, i.e., lysing populations of
cells, which averages out differences between single cells – became insufficient.
Studies at the level of single cells would be necessary to determine how these
complex signal transduction networks can both have highly variable components
and function accurately in each single cell.
1.3 Dynamics matter
Theoretical work at the end of the 20th century suggested a potential solution.
Despite the inevitable variations in concentration of network nodes, perturbation
analysis of molecular networks showed that they can indeed exert accurate control over their responses (Barkai and Leibler, 1997; Shinar and Feinberg, 2010). In
most networks, the outcome depends strongly on the initial conditions and
param-eter values—perturbing the network in even a small way can significantly alter its
functioning. However, some networks can be wired in such a way that the network
response is insensitive to variations in protein concentration. This observation raised
the possibility that signaling pathways might exhibit robustness.
Indeed, as biochemical analysis provided clearer pictures of signal transduction
network interactions, it became apparent that these pathways contain many features of engineering systems: positive and negative feedbacks, time delays, switches etc
(Azeloglu and Iyengar, 2015). Signal transduction networks, therefore, could in
theory be capable of performing complex computations and doing so robustly.
It was quite a surprise then, when the signal transduction activation was quantified
in single cells and found to be highly variable from cell to cell. In cells exposed to
the same concentration of ligand, signal transduction was different from cell to cell.
In some instances, the differences were dynamic—the activation of transcription
factor was asynchronously pulsatile (Tay et al., 2010). In others, the dynamics appeared uniform, but the activation of the terminal transcription regulator was
imprecise (Cheong et al., 2011; Voliotis et al., 2014). Despite the highly conserved
network of interactions, and the potential for robustness, these networks do not
appear to accurately tune the activation of the transcription factor. How then do
these pathways achieve precise control over the processes they regulate?
4
new insights that clarified how signal flows through pathways. Observations of the NF-κB signaling pathway in single cells first demonstrated that signaling activation could be oscillatory and further that target gene response could depend on the
nature of the oscillations (D. Nelson et al., 2004). Work in this pathway and others
led to models in which signal from ligand is “encoded” in complex dynamics of
the pathway transcription factor, which is then “decoded” into gene activation or
repression (Figure 1.2).
Figure 1.2: The signal from ligand is transduced into an intracellular signal, which is the dynamics of pathway activation. The signal carried by pathway dynamics must then be decoded into gene response
Subsequently, it was shown that the full dynamics of pathway activation encode
significantly more information about extracellular ligand concentration than any
time point measurements (Selimkhanov et al., 2014). Thus pathways could exhibit
more precise control over gene expression if target genes response is a product of
the full dynamics.
1.4 Robustness is encoded in dynamic features of signaling
Indeed, shortly thereafter it was discovered that some signal transduction networks
are wired to accurately tune the dynamics of signaling. Studies of the Erk pathway
and Wnt pathway were first to suggest that signaling networks are wired to transmit
signal in accurate dynamics rather than accurate steady state levels. Specifically
it was shown that these pathways encode signal in relative changes: while the
the fold-change was nearly constant (Cohen-Saidon et al., 2009; Goentoro and
Kirschner, 2009). This same strategy was found later in another major developmental signaling pathway, the TNF/NF-κB pathway (Lee et al., 2014). Therefore, signaling pathways have indeed evolved to produce signaling response that is robust to
cell-to-cell variability, with the response being the ligand-induced fold change in the
concentration of transcription factor.
The question that then must be asked of each signaling pathway is, How is signal
transmitted? The finding that signaling pathways have evolved to encode robustness
suggests an approach: to understand the central functioning of a pathway, one need only to look for the robust feature. From this search, insights into the design of
the pathway naturally arise: how do the pathway interactions encode this response?
What are the advantages and constraints of transmitting signal through this
dynam-ical feature? Having identified the robust feature in the pathway it is also now
possible to ask, How precise is the signaling process? Further, knowing the form of
signal, we can ask, To what extent does signal dynamics dictate cellular response?
This thesis pursues these questions in a major metazoan signaling pathway, the Tgf-β pathway.
1.5 Tgf-βpathway function and architecture
The Transforming growth factor beta (Tgf-β) is named for the function it was originally discovered to perform: transforming normal cells into actively growing malignant cells. It rapidly became apparent, however, that the functioning of Tgf-β was diverse and by no means limited to only malignant transformation: within 10 years of its discovery in 1983, it was shown that Tgf-β regulated a huge array of normal physiological functions of normal, non-cancerous tissues such as wound
healing (Sporn et al., 1983), immune cell function (Wahl et al., 1987), and even
embryogenesis and organogenesis (Flanders, Thompson, et al., 1989; Flanders,
Ludecke, et al., 1991; Heine et al., 1991). As early as 1990, there were lists of 22 different cell-types and the effects of Tgf-βexposure (Massague, 1990).
6
Smads. Smad4, which is known as the common Smad, is a common mediator to all Tgf-β superfamily members. When Tgf-β binds to Tgf-β-specific receptors at the cell surface, Smad2 and Smad3 are phosphorylated, form dimeric and trimeric
complexes with Smad4, translocate to the nucleus, and become transcriptionally
active. Smads bind to chromatin in conjunction with cofactors, and upregulate
and downregulate hundreds of target genes. The specific target genes that activate
depend on cell-type specific cofactors expressed (Mullen et al., 2011), mutations in
pathway components (David et al., 2016), or active signaling crosstalks (Uttamsingh
et al., 2008).
While the pathway appears linear in its logic (Tgf-β–>Smads–>Gene expression), the Smads undergo constitutive cytoplasmic-nuclear cycling. After
phosphoryla-tion, complex formation and nuclear localizaphosphoryla-tion, the Smad complexes can fall apart,
and be dephosphorylated and exported back to the nucleus. Smads are thus
con-stantly shuttling in and out of the nucleus, and concon-stantly being phosphorylated and
dephosphorylated. Further, Smad proteins are rapidly turned over, with a half-life
of 1 to 2 hrs (Lo and Massagué, 1999; Xing et al., 2015; Hough, Radu, and Doré, 2012). The addition of Tgfβresults in to nuclear accumulation of Smad protein, as it increases phosphorylation and decreases nuclear export. This rapid cycling process
has been hypothesized to enable rapid, continuous monitoring of extracellular ligand concentration (Schmierer et al., 2008)).
1.6 The need for a quantitative understanding of Tgf-β/Smad signaling in single cells
Despite the importance of Tgf-β/Smad signaling, the current working model for the Tgf-β pathway is derived almost exclusively from bulk analysis of populations of cells. Applying this model to single cells has been shown to be insufficient. This is
highlighted most succinctly by recent measurements in fixed single cells revealing
that the number of ligand-stimulated Smad complexes can vary by a factor of 40
from cell to cell (Zieba et al., 2012). How can we reconcile the precision required
in determining cell fate during development with such imprecision observed in single-cell level?
intracellular signal is transduced into gene response. I find that, even within a
population of clonal cells, intracellular signal dynamics only weakly predicts gene response. Instead, intrinsic variables within clonal individual cells strongly influence
response to Smad dynamics. Indeed, I further uncover candidates for these intrinsic
variables that govern a cell’s interpretation of environmental signal. The totality
of the work in this thesis has uncovered how signal is quantitatively transmitted through Tgf-β/Smad signaling pathway in single cells, revealing that cells send relative signals as a strategy against noise and that predicting a cell’s response to
8
C h a p t e r 2
SENSING RELATIVE SIGNAL IN THE TGF-
β
/SMAD
PATHWAY
Frick, Christopher L, Clare Yarka, Harry Nunns, and Lea Goentoro (2017). “Sensing relative signal in the Tgf-β/Smad pathway”. In: Proceedings of the National
Academy of Sciences, p. 201611428. doi:10.1073/pnas.1611428114.
Abstract How signaling pathways function reliably despite cellular variation re-mains a question in many systems. In the transforming growth factor-β (Tgf-β) pathway, exposure to ligand stimulates nuclear localization of Smad proteins, which
then regulate target gene expression. Examining Smad3 dynamics in live reporter
cells, we found evidence for fold-change detection. Although the level of nuclear
Smad3 varied across cells, the fold change in the level of nuclear Smad3 was a more
precise outcome of ligand stimulation. The precision of the fold-change response was observed throughout the signaling duration and across Tgf-β doses, and sig-nificantly increased the information transduction capacity of the pathway. Using single-molecule FISH, we further observed that expression of Smad3 target genes
(ctgf, snai1, andwnt9a) correlated more strongly with the fold change, rather than
the level, of nuclear Smad3. These findings suggest that some target genes sense
Smad3 level relative to background, as a strategy for coping with cellular noise.
2.1 Introduction
Variability in the abundance of signaling components, across cells and contexts,
is a well-documented feature of multiple signaling pathways (Cheong et al., 2011;
Cohen-Saidon et al., 2009; Lee et al., 2014). Several ideas have been proposed for
how cells can overcome variability: cells may integrate responses from multiple
signaling pathways (Cheong et al., 2011), compensate via cross-talk with other
pathways (Uda et al., 2013), average responses across neighboring cells (Cheong et al., 2011), use negative feedbacks (Voliotis et al., 2014), or measure signal dynamics
(Selimkhanov et al., 2014). In our own work, we found another strategy, where cells
overcome variability by interpreting signaling relative to background (Goentoro
and Kirschner, 2009). Specifically, working in the canonical Wnt pathway, we
in β-catenin level, rather than the absolute level.
Detecting fold change in signal level allows a cell to assign meaning to signal relative
to its own background, enabling faithful transduction despite cellular variability. In
addition to the Wnt pathway, fold-change detection has been proposed in the Erk pathway (Cohen-Saidon et al., 2009) and, subsequently, in the NF-κB pathway (Lee et al., 2014), calcium signaling (Thurley, Tovey, et al., 2014), and cytokine signaling
(Thurley, Gerecht, et al., 2015). The evidence for fold-change detection in more
and more systems suggests a conserved strategy across signaling pathways in animal
cells. Motivated by these findings, we explored in this study for the presence of fold-change detection in a major channel of communication in cells, the transforming
growth factor-β(Tgf-β) pathway.
The Tgf-βpathway functions across diverse contexts and tissues, and regulates fun-damental processes, including proliferation, differentiation, morphogenesis,
stem-cell maintenance, and regeneration (Massagué, 2012). These diverse functions are mediated by a highly conserved set of proteins. The Tgf-β pathway senses signal from a large family of secreted ligands, whose members include Tgf-β, Bmp, and Ac-tivin. Signal transduction is primarily mediated by the Smad proteins (Figure 2.1A): five ligand-specific receptor Smads (R-Smads; Smad1, Smad2, Smad3, Smad5, and
Smad8), one common Smad (Smad4), and two regulatory Smads (Smad6 and
Smad7) that act as feedback. The Smad proteins transduce signal in a dynamic
process: They continually shuttle between the cytoplasm and nucleus, and ligand
stimulation tunes this process. Specifically, ligand binds a complex of type I and
type II serine/threonine kinase receptors, which phosphorylate the R-Smads.
Phos-phorylated R-Smads form a complex with the common Smad4. In their heteromeric
form, the Smad proteins are retained more strongly in the nucleus through reduced
export rate, as well as, as proposed recently (Schmierer et al., 2008), accelerated im-port rate. Thus, ligand activation leads to a net accumulation of the Smad complex
in the nucleus, where it regulates target genes.
The Tgf-β pathway is a particularly interesting system for testing for fold-change detection because it is known that the expression levels of its components vary
considerably from cell to cell. A recent study using proximity ligation assay in
fixed cells revealed that the levels of Smad3/4 and Smad2/4 complexes vary by
more than 40-fold across cells (Zieba et al., 2012). Consistent with this finding, our
10
The variability in the level of Smad proteins from cell to cell raises the question as to
how cells can reliably sense information about their external environment through the Tgf-βpathway.
Motivated by these observations, we tested whether signal in the Tgf-β pathway is sensed in an absolute manner or relative to background. Finding fold-change response in the Tgf-βpathway would expand our understanding of how information flows in the pathway, and how pathway activity should be interpreted appropriately
across contexts and diseases. The alternative finding is equally interesting: If we
find that cells monitor the absolute level of Smad proteins despite their variability, this finding will suggest that the mechanism that produces robust cellular outcomes
is downstream from Smads.
2.2 Results
To investigate what aspects of Smad dynamics regulate gene response, we used live-cell imaging of the Tgf-β pathway. Responding to Tgf-β ligands, specifically, are the receptor-regulated Smad2 and Smad3 (R-Smads). Although structurally
similar, Smad2 and Smad3 affect distinct genes (Brown, Pietenpol, and Moses,
2007), and it is also known that Smad3 can bind directly to DNA, whereas the
predominant isoform of Smad2 does not (Gaarenstroom and Hill, 2014). Here,
we focused on Smad3 and generated a reporter C2C12 cell line stably expressing
an mNeonGreen-Smad3 construct (NG-Smad3; the sequence is shown in Figure 2.8A). Smad3 protein tagged on the N terminus retains phosphorylation at the
C-terminal SXS motif, complex formation with Smad4, nuclear translocation, DNA
binding, and transcriptional activity (Nicolás et al., 2004). We determined via
Western blotting that NG-Smad3 is expressed at a moderate level, at twofold more
than the endogenous Smad3 (Figure 2.8 B and C). We confirmed that NG-Smad3 is
phosphorylated (Figure 2.8D) and translocates to the nucleus upon ligand stimulation
(Figure 2.8E). We further confirmed that the signaling response is quantitatively
identical across three clonal lines (Figure 2.9B). One clone was chosen for the
measurements described here.
Stimulating the clonal reporter cells with Tgf-βligand resulted in nuclear accumu-lation of NG-Smad3 (Figure 2.1B and Movie 2.15), as expected from published
studies (Nicolás et al., 2004; Baker and Harland, 1996; Macías-Silva et al., 1996;
Figure 2.1: Ligand-induced nuclear accumulation of NG-Smad3. (A) Illustration of Smad3 activation and nucleocytoplasmic shuttling in the Tgf-βpathway. Ligand stimulation leads to phosphorylation of Smad3. Phosphorylated Smad3 complexes with Smad4 are shown. The Smad complex translocates to the nucleus and regulates target genes. The Smad complex may also dissociate, allowing Smad3 dephospho-rylation and export back to the cytoplasm. (B) NG-Smad3 in C2C12 clonal reporter cells responding to ligand stimulation. Purified Tgf-β1 (2.4 ng/mL) was added to the cells at the start of the experiment (denoted as t = 0 min). (Left) Cells are shown before stimulation. (Center) Two individual cells are tracked over time. (Right) Same cells 60 min after stimulation. (Scale bars: 20 µm.) (C) Quantitation of the level of nuclear NG-Smad3 during Tgf-β1 stimulation. Each line corresponds to an individual cell. The dashed line indicates when Tgf-β1 was added. au, arbitrary units. (D) Fold change in nuclear NG-Smad3 from the same cells measured in C. Basal level is measured as the average of the fluorescence level 24 min before ligand stimulation.
before to up to 4 h after ligand stimulation. We segmented the nucleus using fluores-cence signal from constitutively expressed nuclear mCerulean3, and then quantified
the median fluorescence of NG-Smad3 in the nucleus for each cell (Materials and
Methods). Nuclear accumulation of NG-Smad3 began immediately upon Tgf-β1 addition and peaked in most cells after 30 min, consistent with previously reported
time scales of R-Smad (Nicolás et al., 2004; Warmflash et al., 2012). In nearly all
cells, NG-Smad3 remained predominantly nuclear during the 4 h of imaging, with
a slight decrease over time. We confirmed that cells only exposed to buffer showed
no response (Figure 2.10A).
12
level of nuclear NG-Smad3 varied across cells, even after Tgf-β1 stimulation (Figure 2.1C). In fact, cells with a high initial level of nuclear NG-Smad3 responded more strongly to Tgf-β1 stimulation, arriving at a higher final level (e.g., the orange and red traces in Figure 2.1C). In contrast, cells with a lower initial level of nuclear
NG-Smad3, rather than compensating for the lower start, responded less to Tgf-β1 stimulation (e.g., the cyan and purple traces in Figure 2.1C). Thus, the cells do not
appear to adjust the strength of their response to produce a robust level of nuclear
NG-Smad3.
In comparison, these same cells exhibited more precise fold-change responses. The fold-change responses can be seen in Figure 2.1D, where we have now plotted the
level of nuclear NG-Smad3 relative to the basal, prestimulus level. Indeed, the
variability in Figure 2.1C arises because exposure to ligand stimulates an increase
in nuclear Smad3 proportional to the initial level (e.g., 200–600 and 2,000–6,000
are both threefold changes). The linear proportionality between the basal and
stimulated levels of nuclear NG-Smad3 holds for nearly two orders of magnitude
(Figure 2.10C).
To confirm the higher precision in fold-change response, we quantified 299 cells responding to Tgf-β1 stimulation (Figure 2.2). Across these cells, the level of nuclear NG-Smad3 varied from cell to cell (Figure 2.2A; the distribution is shown in Figure
2.2C). By contrast, the fold change in the level of nuclear NG-Smad3 is substantially
more precise (Figure 2.2B), resulting in a response distribution that is 3.7-fold more
narrow than the absolute level distribution (computed using quartile coefficient of
dispersion; Figure 2.2D). These results are reproducible across experiments (Figure
Figure 2.2: Fold change in nuclear NG-Smad3 is a more precise response to ligand stimulation. (AandB) NG-Smad3 responding to 2.4 ng/mL Tgf-β1 stimulation. The
14
Two features of the fold-change response are notable. First, the higher precision
of the fold-change response persists throughout the duration of signaling, and not only at steady state (Figure 2.11A). Further, the response time of the fold-change
response is well preserved across cells (purple-hatched distribution in Figure 2.2F).
As a result, multiple features of the fold-change response are also more precise than
the corresponding features computed using the absolute response, specifically, any
monotonic functions, such as the integrated amount or the rate of change (Figure 2.2
E and F). Cells therefore may derive multiple robust computations from the Smad3
response sensed relative to background (e.g., integration, rate detection, timer).
The higher precision of the fold-change response suggests that cells could better
sense external ligand by monitoring Smad3 response relative to background. To
assess this possibility, we collected dose–response data, which we then analyzed
using information theory. First, to test if the precision of the fold-change response is maintained at different doses of ligand, we stimulated cells with Tgf-β1 concen-trations between 10 pg/mL and 2.4 ng/mL (which spans the dynamic range in our
system). We observed that the fold change of NG-Smad3 increased as the dose of
ligand stimulation increased, and remained a more precise response across ligand
doses (Figure 2.3). Correspondingly, monotonic functions of the fold-change
re-sponse (e.g., integration, derivative) also maintained precision across ligand doses and display dose dependence.
Next, we analyzed the dose–response data using information theory. Pioneered
by Claude Shannon in telecommunication (Shannon, 1948), information theory provides a mathematical framework for assessing information transmission across
a communication channel, whether it be an electronic device (e.g., telegraph) or a
signal transduction pathway (Cheong et al., 2011; Uda et al., 2013; Voliotis et al.,
2014; Selimkhanov et al., 2014; Hansen and O’Shea, 2015). Specifically, the metric
mutual information describes the extent to which measuring a particular response
reduces uncertainty about the input (detailed in Materials and Methods). Because
of noise in the communication channel, a given input will not necessarily produce a
given response, but rather maps to a distribution of possible responses. The greater
the noise, the greater the overlap is in the response distributions, and the lower the information is that the response gives about the input (Figure 2.4A).
To assess how the fold-change response facilitates information transduction in the Tgf-βpathway, we computed the maximum mutual information in the system. This quantity, also known as the channel capacity, describes the maximum amount of
transducible information for a given input–response pair, and can be computed
from measured dose–response distributions without making assumptions about the
statistical properties of the input, the specifics of the transduction process, or the
noise properties. Using the single-cell dose–response data in Figure 2.3, we first determined the maximum mutual information between the level of nuclear NG-Smad3 and Tgf-βinput (Materials and Methods). The level of nuclear NG-Smad3 produced overlapping distributions across Tgf-β doses (Figure 2.4B), and could transduce, at most, ~0.2 bits of information (Figure 2.4D). The fold change of NG-Smad3, in contrast, produced considerably less overlap across Tgf-β doses (Figure 2.4C), and could transduce 1.2 bits of information (Figure 2.4D). Importantly,
sensing fold change provides more information than absolute level throughout the
entire signaling dynamics, even after only 8 min after ligand stimulation (Figure
2.11B). We extended the analysis to multiple computations from the Smad3 response (e.g., integration, rate of change), and found that relative computations consistently
transduce higher information than what their absolute counterparts could transduce
(Figure 2.4D). Therefore, as expected from the higher precision across cells, our
16
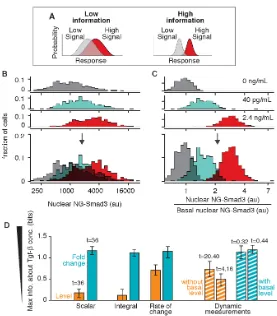
Figure 2.4: Fold-change response has higher information transduction capacity. (A) Noisy, overlapping response distributions provide low information about the strength of ligand input. (BandC) To compute the maximum mutual information, we stimulated the cells with different doses of Tgf-β1 (Figure 2.3). The response distributions for three doses are shown here, of the absolute fluorescence level (B) or the fold change (C). (Bottom) Overlay of the distributions. For low, medium, and high doses, the number of cells examined was 277, 290, and 532, respectively. (D) We computed the maximum mutual information between ligand input and different features of the nuclear NG-Smad3 response. Features computed using the absolute response are shown in orange, and features computed using the fold-change response are shown in blue. Level and fold change of nuclear NG-Smad3 were evaluated at steady state, at 36 min after Tgf-βaddition (comparison at different time points is shown in Figure 2.11B). Rate of change in the NG-Smad3 response was computed as the maximum of the derivative of the response curve. To compute the integral of the NG-Smad3 response, the response was integrated over the first hour of ligand stimulation. For dynamic measurements, the level of nuclear NG-Smad3 was measured at multiple time points, as indicated, and mutual information was computed with a 2D distribution (Figure 2.14). Error bars are 90% confidence intervals computed using bootstrap resampling. The total number of cells examined for each calculation was 1,650.
raise the question of whether target genes use this feature and respond to the fold
change in nuclear Smad3. To test this possibility, we combined live-cell imaging with single-molecule RNA FISH (Figure 2.5A). By keeping track of the position of
the cells within the imaging field, we could measure the NG-Smad3 response, and
subsequently obtain mRNA counts from the same cell. We can, therefore, correlate,
within single cells, both the signaling dynamics and target gene expression (Lee et al., 2014; Singer et al., 2014). We first filmed cells responding to Tgf-β1 stimulation, and then fixed cells and stained for mRNA. To count the mRNA molecules, we took
optical z-sections of the entire cells and performed automated detection of mRNA
foci using custom MATLAB scripts (Materials and Methods). We examined known
direct targets of Smad3,snail, andctgf. Smad3 has been shown to bind directly to the promoters of these genes upon Tgf-β stimulation (Brandl et al., 2010; Zhang et al., 2011). Both genes are involved in various processes, including
epithelial-mesenchymal transition, cell adhesion, fibrosis, and extracellular matrix remodeling
(Fan, Pech, and Karnovsky, 2000; Medici, Hay, and Olsen, 2008). For each gene,
we characterized the expression profile over 6 h and report here the transcript counts
18
Figure 2.5: Expression of target genes correlates more strongly with the fold change in nuclear NG-Smad3. (A) To correlate NG-Smad3 dynamics and transcription response within a single cell, we combined live-cell imaging with smFISH. Cells were stimulated with Tgf-β1 and imaged. The same cells were then fixed, stained against specific mRNA, and imaged again. Foci corresponding to individual mRNA molecules were quantified using custom MATLAB scripts. The mRNA transcript counts were then plotted against features of NG-Smad3 response from the same cells. (B) Number of mRNA transcripts plotted against the level (Left) or fold change
(Right) of nuclear NG-Smad3 measured in the same cell. The mRNA transcripts
We observed variability in the mRNA expression of the target genes, which may
be due to variability in cell size, chromatin state, cell-cycle phase, other extrinsic variables, or stochastic noise. Although many factors can contribute to gene
reg-ulation, we focus here on discerning the effects of Smad3 dynamics. While the
variability may mask some of the correlation, clear trends were observable Figure
(2.5). The expression of both target genes appeared to be linearly proportional to the
magnitude of fold change in Smad3 level and showed no strong dependence on the
absolute level of Smad3. Figure 2.5 shows the mRNA counts plotted against the
ab-solute level (Figure 2.5B,Left) or the fold change in the level of nuclear NG-Smad3
(Figure 2.5B,Right). Further, the higher correlation of mRNA expression and the
fold-change response was apparent throughout the entire duration of NG-Smad3 dynamics (Figure 2.5C), and was statistically significant (P < 0.01, Steiger’s Z test;
Table 2.1). The same result was observed with another direct target gene, wnt9 (Figure 2.12). These results suggest that some target genes of the Tgf-β pathway respond to the fold change in Smad3, rather than the absolute level.
2.3 Discussion
There has been growing evidence that the dynamics of Smad proteins are important
for their functioning (Schmierer et al., 2008; Warmflash et al., 2012). In this study, we explored the dynamics of R-Smads to investigate how the Tgf-βpathway solves the problem of cellular variability. First, using single-cell live imaging, we
found that fold change in Smad3 level, rather than absolute level, is the outcome of
ligand stimulation that is more robust to cell-to-cell variation. Then, analyzing the response distributions across doses, we found that measuring fold change in Smad3 indeed confers higher information transduction capacity to the Tgf-βpathway. The robustness and higher information transduction capacity suggest that fold change
in Smad3 is a meaningful signal sensed by the cells. Measuring gene response
and Smad3 dynamics in single cells, we found that some direct targets of Tgf-β indeed correlate more strongly with fold change in Smad3, rather than absolute
level. Altogether, these findings suggest that, at least in some contexts, cells sense
the relative level of Smad3 as a way to transmit information more accurately despite
20
Figure 2.6: Our finding suggests that, at least in some contexts, Smad signal in the Tgf-βpathway is sensed in a relative manner.
Sensing the relative change in Smad3 may be useful for allowing the Tgf-β path-way to function reliably in diverse processes (e.g., migration, differentiation, cell
death) and diverse tissues (e.g., adipose, muscle, epithelia) (Massagué, 2012), where
concentrations of the components of the pathway are known to vary significantly
across cells (Zieba et al., 2012), tissues (Flanders, Kim, and Roberts, 2001), and
developmental stages (Flanders, Kim, and Roberts, 2001). The finding that signal
may be sensed relative to background also means that a high level of nuclear Smad
complex does not necessarily indicate a high level of signaling, and this finding may
have implications for understanding the context-dependent outcomes of the Tgf-β pathway. For instance, the Tgf-βpathway is known to act as a tumor suppressor in early tumorigenesis and as a tumor promoter in the later stages (Akhurst and Hata,
2012). This and other context-dependent outcomes are thought to arise from cell
type-specific interactions between Smads and master transcription factors, the
epige-netic status of target gene promoters/enhancers, and cross-talk with other pathways
(Massagué, 2012; Akhurst and Padgett, 2015). In the framework of fold-change
detection, a part of the context-dependent outcomes may arise from the signal being
interpreted relative to different quantitative backgrounds.
The higher precision of the fold-change response is predicted by mathematical mod-eling of the Tgf-βpathway. A mathematical model capturing the nucleocytoplasmic dynamics of Smads upon Tgf-β stimulation was developed by Schmierer et al. (Schmierer et al., 2008). The model displays a high degree of predictive power,
fitting four independent measurements in cells and predicting results from two
inde-pendent datasets that were not used to construct the model. We find that simulations of the Tgf-β model predict that fold change in nuclear Smad3 will be more robust to parameter variation than the absolute level of nuclear Smad3 (Figure 2.13). The
the fold-change response starts breaking down with large-parameter variations,
in-dicating that cells must operate in a specific parameter regime to achieve this robust feature in Smad3 response (Figure 2.13C and D). Similar parameter tuning is also
required in the fold-change response in the canonical Wnt pathway (Goentoro and
Kirschner, 2009). Overall, these results suggest that the robust fold-change response
arises from the conserved interactions of the pathway.
The higher precision of the fold-change response of Smad3 significantly increases
the information transduction capacity of the Tgf-βpathway. It was recently proposed that measuring the absolute signal dynamics over multiple time points may increase channel capacity in Erk, NF-κB, and the calcium pathway (Selimkhanov et al., 2014). We tested this idea in the Tgf-β pathway and found that measuring the signaling dynamics of Smad3 at multiple time points can give comparable mutual
information to the fold-change response, provided that one of the time points was
the basal state (Figure 2.4D and Figure 2.14), therefore strengthening our findings
here. Our findings suggest that, despite variability in the Smad level, there is indeed reliable signal processing within the Tgf-βpathway.
Looking downstream in the pathway, the correlation between target gene expression and fold change in Smad3 necessitates a mechanism for computing fold changes.
A recurrent motif in transcriptional networks, the type-1 incoherent feedforward
loop, was shown to have the ability to provide fold-change computation (Goentoro,
Shoval, et al., 2009). Smads, known activators, also effect repression through
recruitment of repressors, such as ATF3 or E2F4 (Massagué, Seoane, and Wotton,
2005), or inducing specific microRNAs that repress their own target genes (Butz
et al., 2012). In the context of our findings, these seemingly opposite actions of
Smads may mediate fold-change detection.
Our present work places the Tgf-β pathway among the increasing number of sig-naling pathways where fold-change response has now been identified or proposed
(Cohen-Saidon et al., 2009; Lee et al., 2014; Goentoro and Kirschner, 2009;
Thur-ley, Tovey, et al., 2014; ThurThur-ley, Gerecht, et al., 2015). Our finding reinforces an
emerging theme across signaling pathways in animal cells, that signaling dynamics
are sensed in a relative manner. Beyond signaling in cells, sensing signal in a relative
manner brings to mind the Weber’s law in sensory systems (Laming, 1986; Shepard,
Kilpatric, and Cunningham, 1975; Weber, Ross, and Murray, 1996), and highlights
22
References
Akhurst, Rosemary J and Akiko Hata (2012). “Targeting the TGFβsignalling path-way in disease”. In:Nature reviews Drug discovery11.10, p. 790.
Akhurst, Rosemary J and Richard W Padgett (2015). “Matters of context guide future research in TGFβsuperfamily signaling”. In:Sci. Signal.8.399, re10–re10.
Baker, Julie C and Richard M Harland (1996). “A novel mesoderm inducer, Madr2, functions in the activin signal transduction pathway.” In:Genes & Development
10.15, pp. 1880–1889.
Brandl, Martina et al. (2010). “IKKα controls canonical TGFβ–SMAD signaling to regulate genes expressing SNAIL and SLUG during EMT in Panc1 cells”. In:
J Cell Sci123.24, pp. 4231–4239.
Brown, Kimberly A, Jennifer A Pietenpol, and Harold L Moses (2007). “A tale of two proteins: Differential roles and regulation of Smad2 and Smad3 in TGF-β signaling”. In:Journal of cellular biochemistry101.1, pp. 9–33.
Butz, Henriett et al. (2012). “Crosstalk between TGF-βsignaling and the microRNA machinery”. In:Trends in pharmacological sciences33.7, pp. 382–393.
Cheong, Raymond et al. (2011). “Information transduction capacity of noisy bio-chemical signaling networks”. In:science334.6054, pp. 354–358.
Cohen-Saidon, Cellina et al. (2009). “Dynamics and variability of ERK2 response to EGF in individual living cells”. In:Molecular cell36.5, pp. 885–893.
Fan, Wen-Hua, Michael Pech, and Morris J Karnovsky (2000). “Connective tis-sue growth factor (CTGF) stimulates vascular smooth muscle cell growth and migration in vitro”. In:European journal of cell biology79.12, pp. 915–923.
Flanders, Kathleen C, Edward S Kim, and Anita B Roberts (2001). “Immunohisto-chemical expression of smads 1–6 in the 15-day gestation mouse embryo: signal-ing by BMPs and TGF-βs”. In:Developmental dynamics: an official publication
of the American Association of Anatomists220.2, pp. 141–154.
Gaarenstroom, Tessa and Caroline S Hill (2014). “TGF-β signaling to chromatin: how Smads regulate transcription during self-renewal and differentiation”. In:
Seminars in cell & developmental biology. Vol. 32. Elsevier, pp. 107–118.
Goentoro, Lea and Marc W Kirschner (2009). “Evidence that fold-change, and not absolute level, of β-catenin dictates Wnt signaling”. In: Molecular cell 36.5, pp. 872–884.
Goentoro, Lea, Oren Shoval, et al. (2009). “The incoherent feedforward loop can pro-vide fold-change detection in gene regulation”. In:Molecular cell36.5, pp. 894– 899.
Hansen, Anders S and Erin K O’Shea (2015). “Limits on information transduction through amplitude and frequency regulation of transcription factor activity”. In:
Laming, Donald (1986).Sensory analysis. Academic Press.
Lee, Robin EC et al. (2014). “Fold change of nuclear NF-κB determines TNF-induced transcription in single cells”. In:Molecular cell53.6, pp. 867–879.
Macías-Silva, Marina et al. (1996). “MADR2 is a substrate of the TGFβ receptor and its phosphorylation is required for nuclear accumulation and signaling”. In:
Cell87.7, pp. 1215–1224.
Massagué, Joan (2012). “TGFβsignalling in context”. In:Nature reviews Molecular
cell biology13.10, p. 616.
Massagué, Joan, Joan Seoane, and David Wotton (2005). “Smad transcription fac-tors”. In:Genes & development19.23, pp. 2783–2810.
Medici, Damian, Elizabeth D Hay, and Bjorn R Olsen (2008). “Snail and Slug promote epithelial-mesenchymal transition through β-catenin–T-cell factor-4-dependent expression of transforming growth factor-β3”. In:Molecular biology
of the cell19.11, pp. 4875–4887.
Nicolás, Francisco J et al. (2004). “Analysis of Smad nucleocytoplasmic shuttling in living cells”. In:Journal of cell science117.18, pp. 4113–4125.
Schmierer, Bernhard et al. (2008). “Mathematical modeling identifies Smad nucle-ocytoplasmic shuttling as a dynamic signal-interpreting system”. In:Proceedings
of the National Academy of Sciences105.18, pp. 6608–6613.
Selimkhanov, Jangir et al. (2014). “Accurate information transmission through dy-namic biochemical signaling networks”. In:Science346.6215, pp. 1370–1373.
Shannon, Claude Elwood (1948). “A mathematical theory of communication”. In:
Bell system technical journal27.3, pp. 379–423.
Shepard, Roger N, Dan W Kilpatric, and James P Cunningham (1975). “The internal representation of numbers”. In:Cognitive psychology7.1, pp. 82–138.
Singer, Zakary S et al. (2014). “Dynamic heterogeneity and DNA methylation in embryonic stem cells”. In:Molecular cell55.2, pp. 319–331.
Thurley, Kevin, Daniel Gerecht, et al. (2015). “Three-dimensional gradients of cy-tokine signaling between T cells”. In:PLoS computational biology11.4, e1004206.
Thurley, Kevin, Stephen C Tovey, et al. (2014). “Reliable encoding of stimulus intensities within random sequences of intracellular Ca2+ spikes”. In:Sci. Signal.
7.331, ra59–ra59.
Uda, Shinsuke et al. (2013). “Robustness and compensation of information trans-mission of signaling pathways”. In:Science341.6145, pp. 558–561.
Voliotis, Margaritis et al. (2014). “Information transfer by leaky, heterogeneous, protein kinase signaling systems”. In: Proceedings of the National Academy of
24
Warmflash, Aryeh et al. (2012). “Dynamics of TGF-β signaling reveal adaptive and pulsatile behaviors reflected in the nuclear localization of transcription factor Smad4”. In:Proceedings of the National Academy of Sciences 109.28, E1947– E1956.
Weber, EH, Helen E Ross, and David J Murray (1996). “EH Weber on the tactile senses”. In:
Zhang, Yingze et al. (2011). “High throughput determination of TGFβ1/SMAD3 targets in A549 lung epithelial cells”. In:PLoS One6.5, e20319.
Zieba, Agata et al. (2012). “Intercellular variation in signaling through the TGF-β pathway and its relation to cell density and cell cycle phase”. In:Molecular &
2.4 Supplementary Figures
26
28
Figure 2.11: Fold-change response is more precise and has higher information capacity throughout the duration of signaling. (A) Plotted is the quartile coefficient of dispersion (QCD) for the level (orange) and the fold change (blue) in the level of nuclear NG-Smad3. The QCD is defined here as follows: (Q3 - 1)/Q2, where Q1, Q2, and Q3 are the 25th, 50th, and 75th percentiles, respectively. The QCD values reported here are computed using the cell traces in Figure 2.2 A and B. (B) Maximum mutual information between Tgf-β input and nuclear Smad3 level (orange) or fold change (blue) was determined at each time interval after Tgf-β addition (t = 0). Error bars are 90% confidence intervals computed using bootstrap resampling. The total number of cells examined for each calculation was 1,650.
Figure 2.12: Expression of wnt9a correlates more strongly with fold change in nuclear NG-Smad3. Plotted is the correlation between NG-Smad3 responses and
wnt9amRNA transcripts counted in the same cell. (A) Level of nuclear NG-Smad3
30
Figure 2.13: Mathematical model of Tgf-βpathway predicts fold-change robustness to parameter variation. We tested whether a mathematical model predicts robust-ness of Smad fold change to endogenous cellular variability. The mathematical model used is a system of ODEs describing R-Smad nucleocytoplasmic shuttling in response to Tgf-β(Schmierer et al., 2008). To test for robustness to cell-to-cell variation, we performed 1,000 simulations with random parameter variation. (A) Response dynamics of nuclear R-Smad level (Left) and fold change (Right) from 1,000 individual simulations with random parameter variation. (B) Response dy-namics of nuclear Smad complex level (Left) and fold change (Right) from 1,000 individual simulations with random parameter variation. Plots of the normalized steady-state response (absolute level, red; fold change, green) vs. the total parameter variation for R-Smad (C) and the Smad complex (D) are shown. The responses were normalized to the median of all 1,000 simulations as a way of facilitating compar-ison. Each dot corresponds to an individual simulation. Plots of basal nuclear vs. final nuclear level of Smad3 (E) or the Smad complex (F) are shown. Each data point represents one simulation of the Tgf-β model either without (Left) or with
(Right) random parameter variation. In each plot are data from 1,000 simulations.
R2 is the square of Pearson’s correlation coefficient. Simulations of the system of ordinary differential equations (ODEs) were performed in MATLAB using the numerical solver, ode15i. To perform parameter variation, parameter values were chosen randomly in each iteration of the simulation from a log-normal distribution whose mode is the parameter value of the published model. The log-normal dis-tributions were generated by multiplying the parameter by a randomly generated log-normal distribution with mu equal to 0 and sigma equal to 0.1, except for the expression of R-Smad, where sigma was 0.4 (mu and sigma are the log-mean and log-standard deviation of the log-normal distribution, respectively). We began all simulations with a basal level of Tgf-β(i.e., 0.02 nM), followed by stimulation with 0.5 nM. Total parameter variation, k, is defined as: log(k) = ÍL
n=1|log(kn/k0n)|,
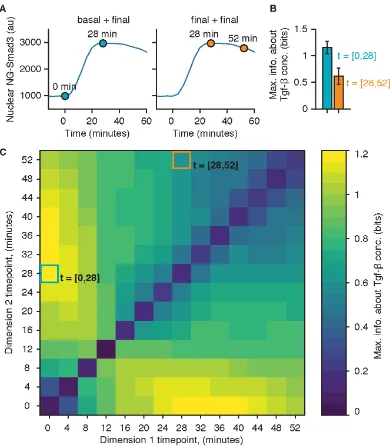
Figure 2.14: Mutual information computed with dynamic measurements. (A) Illus-tration of dynamic measurement. In dynamic measurement, the signaling response of a cell is defined as a vector containing multiple time points (e.g., t = [0,28 min] [Left] and t = [28,52 min] [Right]) instead of a single time point (as described in ref. Selimkhanov et al., 2014). (B) Maximum mutual information between NG-Smad3 response and Tgf-β input using the specified dynamic measurement time point combinations. The data used for the information calculation are the same used in Figure 2.4 (n = 1,650). Maximum mutual information was computed as described in Materials and Methods, withRin Equation 2.1 as the multivariate. Each entry in
32
2.5 Materials and Methods
Expression Construct.
The human Smad3 cDNA was a gift from Joan Massague (Addgene; plasmid 27010).
Human Smad3 and mouse Smad3 contain 100% sequence identity. The
mNeon-Green (NG) gene was obtained from Allele Biotechnology (ABP-FP-MNEONSA). The mCerulean3-C1 cDNA was a gift from Klaus Hahn (Addgene; plasmid 22030).
The NG-Smad3 construct was placed downstream of a CMV promoter, and the
mCerulean3 gene was fused with a 3x nuclear localization sequence (NLS) and
placed downstream of an SV40 promoter.
Cell Culture.
C2C12 cells (American Type Culture Collection, CRL-1772) were cultured at 37 °C and 5% (vol/vol) CO2 in DMEM (ThermoFisher Scientific; 11995) supplemented
with 10% (vol/vol) FBS (Invitrogen; A13622DJ), 100 U/mL penicillin, 100 µg/mL streptomycin, 0.25 µg/mL amphotericin, and 2 mM L-glutamine (Invitrogen). To generate the NG-Smad3 C2C12 cell line, cells were transfected with the NG-Smad3
plasmid using FuGene 6 reagent (Promega; E2693). Stable expression was selected
for using puromycin at a concentration of 2 µg/mL. Cells were sorted using FACS and then plated in a 96-well plate to select single clones. NG-Smad3 cells were
maintained in media containing 2 µg/mL puromycin.
Live-Cell Imaging.
Cells were grown on 24-well glass-bottomed plates (Griener Bio-One; 662892)
overnight before imaging in 2 mL of FluoroBrite DMEM (Gibco-Life Technologies;
A18967) containing 10% (vol/vol) FBS, 1 mM glutamax (Gibco-Life Technologies;
35050), 1 mM sodium pyruvate, 100 U/mL penicillin, 100 µg/mL streptomycin, and 0.25 µg/mL amphotericin. Cells were imaged using a Zeiss Axio Observer.Z1 inverted fluorescence microscope under incubation [37 °C and 5% (vol/vol) CO2, with humidification] on a motorized stage. In each experiment, 21–38 positions were
imaged and focus was maintained using Zeiss Definite Focus. Images were acquired
at 4-min intervals with a 20x, 0.8-N.A. Plan Apo objective and Evolve 512 EM-CCD
camera (Photometrics). Cells were imaged for at least 1 h before stimulation with Tgf-β1 (PeproTech; 100-21). One hundred microliters of Tgf-β–containing media was added to cells to achieve desired final concentrations of Tgf-β in cell growth media for experiments. Buffer-only media were added in 0 ng/mL experiments to
34
Image Analysis, Cell Tracking, and Fluorescence Quantification.
Time-lapse movies were quantified after flat-field correction, bleaching correction,
and background subtraction. We followed the standard protocol described by
Wa-ters (WaWa-ters, 2009). In flat-field correction, to capture the shape of fluorescence
illumination, we imaged a well containing media only. We imaged five different
positions within the well, and computed the median of the images. Flat-field
correc-tion was performed by dividing each experimental image by this media-only image.
This procedure was repeated for each fluorescence channel. Bleaching correction
was performed for each fluorescence channel by correcting for the global change in fluorescence throughout the duration of imaging. For background correction,
images were segmented such that the entireties of cells were broadly outlined, and
fluorescence signal from the background was then averaged and subtracted from the
image. This procedure was repeated for all images at each time frame.
Fluorescence Quantification.
We report the median fluorescence intensity of NG-Smad3 fluorescence in the nu-clei. The nuclei of cells were first segmented based on the fluorescence of the
constitutively expressed mCerulean3-3NLS (3xNLS). Next, segmented nuclei were
tracked across all time frames. Finally, the fluorescence data from the segmented
nuclei were extracted. We only tracked and quantified fluorescence from cells that
maintained consistent morphology for at least 1 h of imaging. Cells that divided,
balled up, left the imaging field of view, or displayed some abnormality (e.g.,
double-nucleated, abnormally large) were excluded. For correcting experimental
fluctuations during the imaging period, we used the constitutive mCerulean3
flu-orescence as an internal control, dividing each time trace for NG-Smad3 nuclear
fluorescence by the normalized mCerulean fluorescence time trace in the same cell. Subsequently, individual time traces were smoothed using a running three-frame
average. mCerulean normalization and time trace averaging turn out to be minor
corrections (likely because our tracked cells maintained consistent morphology and
our imaging setup was stable during imaging duration), and we obtained the same
conclusions both with and without these corrections applied (raw data are available
upon request). We performed all segmentation, tracking, and fluorescence
quanti-tation steps using the Lineage Tracker ImageJ (NIH) plug-in (Downey et al., 2011)
and custom MATLAB (MathWorks) scripts (available upon request).
Following time-lapse imaging, cells were fixed using 4% (wt/vol) paraformaldehyde
for 20 min, permeabilized in 70% (vol/vol) ethanol for at least 1 d at -20 °C, and then hybridized overnight with HPLC-purified single-molecule FISH (smFISH) probes
at 30 °C using a protocol adapted from Raj et al. (Raj et al., 2008). Images of
stained cells were acquired using a 40x, 1.4-N.A. Plan Apo Oil Objective with
Immersol 518F (Zeiss; 444960) and an Orca Flash 4.0 V sCMOS camera. To
ensure the entirety of each cell was imaged at each position, a z-stack of 20 or more
images was collected at 0.6-µm intervals. Differential interference contrast (DIC) images from the middle Z-slice of image stacks were used for manual segmentation
of cells. The mRNA foci were detected using custom MATLAB scripts. Briefly,
fluorescence images were convolved with a 5 x 5 Laplacian-of-Gaussian kernel, and then thresholded such that mRNA foci were only identified in cells (scripts
available upon request). Probe sets targeting snai1, wnt9a, and ctgf mRNA were
designed using Stellaris Probe Designer Version 4.1 and ordered from Biosearch.
Each probe is a 20-mer with a mdC(TEG-Amino) 3’ modification, which was used
to couple the probe to Alexa Fluor 594 NHS Ester (Molecular Probes; A20004) or
Alexa Fluor 647 NHS Ester (Molecular Probes; A20006). Following the coupling
reaction, fluorescently labeled probes were purified using HPLC. The smFISH probe
sequences are provided in Table 2.2.
Mutual Information Estimation.
To estimate the mutual information between Tgf-βinput and NG-Smad3 response, we followed the steps described in the methods of Voliotis et al. (Voliotis et al.,
2014). Mutual information is expressed as follows:
I(R;S)= h(R) −h(R|S)= h(R) −E[h(R|S= s)], (2.1)
where R, the pathway output, is continuous and possibly multivariate, and S, the
ligand input, is the distribution of ligand concentrations. Ris a vector containing
experimentally determined responses (e.g., a vector of fold-change responses at t
= 32 min or a vector of nuclear NG-Smad3 levels at t= 32 min), and S is a vector
containing the probabilities of ligand doses. The unconditional entropy, h(R), and the conditional entropy,h(R|S = s), are estimated using the nearest-neighbor (knn)
method [i.e., equation 20 of Kraskov et al. (Kraskov, Stögbauer, and Grassberger,
36
ˆ
H(X)=−ψ(k)+ψ(N)+logcd+ d
N N
Õ
i=1
logε(i). (2.2)
The knn method performs better than “binning with bias correction” (used in ref. (Cheong et al., 2011)), at a smaller sample size (n < 200), giving more accurate
estimations of mutual information with smaller mean squared error and bias (Voliotis
et al., 2014). We use k = 3 nearest neighbors for all estimations performed in this
work. For each calculation of mutual information, we performed 100 iterations
of random sampling (without replacement) of the dataset. We confirmed that the
distributions of the mutual information estimator are similar for 100 and 1,000
iterations. To determine maximum mutual information, we tested 100 different
signal input distributions, S, ranging from uniform, to unimodal, to bimodal, to
trimodal, and determined the signal at which mutual information was maximum. We report in Figure 2.4D and Figure 2.14 the maximum mutual information. To
compute the mutual information using dynamic measurement (Selimkhanov et al.,
2014), R is multivariate, with each entry in R (corresponding to a single cell)
2.6 Supplementary Tables
snai1(n = 125) ctgf(n = 114) wnt9a(n = 119)
Time, min r13 r23 r12 Z P value r13 r23 r12 Z P value r13 r23 r12 Z P value
4 0.18 -0.12 0.21 2.616 0.0075 0.31 -0.03 -0.02 2.634 0.0072 0.32 -0.20 0.05 4.171 1.08E-05 8 0.34 -0.04 0.18 3.410 4.14E-04 0.49 0.06 -0.08 3.406 4.51E-04 0.48 -0.12 -0.04 4.814 2.81E-07 12 0.43 0.03 0.27 3.837 6.00E-05 0.51 0.15 0.03 3.073 0.0016 0.53 -0.04 0.03 4.797 3.20E-07 16 0.50 0.09 0.35 4.309 5.08E-06 0.55 0.21 0.13 3.145 0.0013 0.56 0.01 0.11 4.862 2.04E-07 20 0.53 0.13 0.39 4.417 2.73E-06 0.56 0.21 0.19 3.265 7.81E-04 0.54 0.03 0.17 4.690 5.71E-07 24 0.56 0.16 0.39 4.454 2.30E-06 0.56 0.21 0.22 3.343 5.66E-04 0.52 0.02 0.19 4.555 1.26E-06 28 0.57 0.20 0.37 4.166 1.21E-05 0.56 0.20 0.23 3.472 3.29E-04 0.51 0.01 0.20 4.569 1.12E-06 32 0.57 0.22 0.34 3.893 4.97E-05 0.55 0.19 0.24 3.467 3.32E-04 0.49 0.00 0.20 4.555 1.19E-06 36 0.58 0.23 0.31 3.772 9.02E-05 0.54 0.18 0.24 3.404 4.30E-04 0.49 -0.02 0.21 4.685 5.26E-07 40 0.57 0.23 0.29 3.647 1.59E-04 0.53 0.17 0.22 3.366 5.05E-04 0.49 -0.03 0.19 4.726 4.10E-07 44 0.58 0.23 0.28 3.678 1.40E-04 0.52 0.17 0.19 3.254 8.00E-04 0.49 -0.03 0.16 4.669 6.07E-07 48 0.57 0.24 0.27 3.522 2.78E-04 0.49 0.15 0.16 3.073 0.0016 0.48 -0.04 0.13 4.554 1.25E-06 52 0.56 0.23 0.28 3.512 2.88E-04 0.46 0.14 0.14 2.756 0.0049 0.45 -0.05 0.12 4.320 4.88E-06
Table 2.1: Correlations, z-scores, and p-values from Steiger’s Z test for Figures 2.5 and 2.12. Here we are testing whether the correlation between fold-change and mRNA count is significantly different from the correlation between level and mRNA count. Steiger’s Z test is used to determine whether two non-independent correla-tions are significantly different (Steiger, 1980). Correlacorrela-tions are non-independent when they share a term. In this case the fold-change and level are both correlated with the same term, mRNA count data. The correlations in the table are the fol-lowing: r13 is the correlation between fold-change and mRNA count, r23 is the
correlation between level and mRNA count, andr12is the correlation between