Journal of Chemical and Pharmaceutical Research, 2015, 7(7):203-209
Research Article
ISSN : 0975-7384
CODEN(USA) : JCPRC5
Evolution of hydrogen production from photosynthetic bacteria using a single
channel hydrogen electrode detector
1
Velpula Suresh, Karunaker Rao Kudle,
2Madhukar Rao Kudle and M. P. Pratap Rudra*
1
Department of Biochemistry, Osmania University, Hyderabad, Telangana State, India
2Department of Biochemistry, Kakatiya University, Warangal, Telangana State, India
_____________________________________________________________________________________________ABSTRACT
A survey for the presence of anoxygenic photosynthetic bacteria was conducted and the results are analysed in the present study. The organism preferred sucrose and ammonium chloride for maximum biomass production. pH between 5.0 to 6.0 was optimum for the growth of the organism. Rhodopseudomonas palustris MGU001 achieved maximum growth on 10th day of incubation under anaerobic light. Studies on optimization of cultural conditions for production of hydrogen revealed that the maximum hydrogen production took place on 24th hour of incubation. pH of 6 was amenable for the production of hydrogen. More hydrogen production was seen when glutamine and glucose were used as nitrogen and carbon sources respectively.
_____________________________________________________________________________________________
INTRODUCTION
The presence of photosynthetic bacteria along with the heterotrophic bacteria have been reported in various aquatic environments like Indian tropical waters[1], salt marshes[2] industrial effluents [3] sea water[4], sewage[5], waste water [6], hot water springs[7], earthworm casts [8], paddy fields ocean waters[9] and aquaculture [10] brackish lagoon [11] and black sea [12],[13] studied taxonomy of anoxygenic photosynthetic bacteria. Light dependant hydrogen production by anoxygenic photosynthetic bacteria [14],[15],[16],[17] and [18] cell free artificial reconstituted systems [19] was reviewed by many workers. Utilization of waste water for photobiological hydrogen generation by photosynthetic purple non sulphur bacteria [21-26] is desirable since it not only makes the process of photobiological hydrogen generation operationally feasible but also achieves partial purification of water by reducing organic materials [27, 28]. A plan for integrated biological production of hydrogen was suggested [29]. Hydrogen from waste waters from the food industry was earlier investigated [30]. Survey of various carbon sources on hydrogen production by Rsp.rubrum was studied by [31]. Immobloised Rhodopseudomonaspalustris CGA 09 in latex was studied for hydrogen production [32]. When incubated in the presence of CO gas, Rubrivivaxgelatinosus CS induced a CO oxidation hydrogen production pathways which proceeds in both light and darkness [33]. Fermentative production of hydrogen from synthetic gas was also investigated [34].
EXPERIMENTAL SECTION
The phototrophic bacteria were isolated by enrichment technique [35]. The chemicals and glassware employed were of AR grade and Borosil make respectively. Double distilled water was employed. Beibl and Pfennig’s medium (in mg/L) KH2 PO4: 500; MgSO4.7H2O: 200; NaCl: 400; NH4Cl: 400; CaCl2.2H2O: 50; Organic carbon: 1000; Yeast
60; CoCl2.6H2O: 200; NiCl2.6H2O: 20; CuCl2.2H2O: 20; NaMO4.2H20: 40 and HCl (25%v/v): 1 ml. Unless and
otherwise mentioned, pH was maintained at 6.8. Identification keys provided in Bergey’s manual of systematic bacteriology (1994) [36] was adopted. These stock cultures were maintained in 2% agar medium. The cultures were incubated at 2000 lux light intensity at 30 + 2oC for 2-3 days and stored in a refrigerator. Subculturing is carried out for every 60 days or as needed. Growth was determined by ensuring optical density at 660 nm using UV-Vis spectrophotometer. Absorption spectra of the whole cells was measured by [37] Liquid culture (3.5 ml) was taken and 5 grams of sucrose was added and mixed thoroughly on a cyclomixer and absorption was recorded in the range of 300-900 nm in a UV-Vis spectrophotometer. Five grams of sucrose in 3.5 ml medium served as blank. The basic technique used in the hydrogen production were those established by [38] and [39]. Five ml of bacterial culture was harvested by centrifugation at 10,000 X g for 10 min, washed thrice with 0.3% saline and the cells were suspended in the basal medium devoid of electron donor and nitrogen source. Depending on the experimental conditions different electron donors and nitrogen sources were added at required concentrations. Hydrogen production activity in the washed cell suspension was estimated by inoculating into 10ml of the medium in 15 ml capacity rimless test tubes sealed with subaseals under anaerobic conditions. The amount of hydrogen liberated by the photosynthetic bacterium was calculated from the peak height of the recorder with reference to calibration curve prepared using ultra-pure hydrogen.
Single channel H2 Electrode Detector & Sensor
Rhodopsuedomonas palustris Bacteria culture
% of Hydrogen H
2
H+ H+
Medium Nutrients (Carbone , Nitrogen Sources and Growth factor)
RESULTS AND DISCUSSION
______________________________________________________________________________
Rc.tenius for optimum production of hydrogen [49]. Similarly, reported maximum production of hydrogen at a pH
of 7.0 by Rps. rutila, isolated from sewage water [50]. Hence, this study was conducted to investigate the effects of pH on the continuous production of hydrogen.
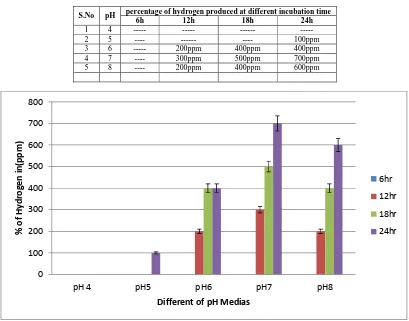
Perusal of (Table:1 and Figure:1) reveals that pH exerted a significant influence on hydrogen production by the bacteria under study. No hydrogen production could be recorded below pH 5.0 by Rps.palustris. Similarly, Rps.
[image:3.595.93.502.205.526.2]Acidophila was reported to produce hydrogen before pH 4.5 and above pH 7.0 [51].
Table 1: Effect of pH on hydrogen (%) produced at different incubation intervals
S.No pH percentage of hydrogen produced at different incubation time
6h 12h 18h 24h
1 4 --- --- --- ---
2 5 ---- --- ---- 100ppm
3 6 --- 200ppm 400ppm 400ppm
4 7 ---- 300ppm 500ppm 700ppm
5 8 ---- 200ppm 400ppm 600ppm
.
Figure 1: Effect of pH on hydrogen (%) produced at different incubation
A wide variety of organic substrates such as carbohydrates [51-57], lipids and fatty acids [58] are utilised by different species of phototrophic bacteria as electron donors for hydrogen production. The substrate specificity for hydrogen production varied [59]. Hydrogen production by Clostridium thermolacticum during continuous fermentation of lactose was reported [60]. Effects of various carbon sources on hydrogen production from Rc.tenius,
Rhodospirillum rubrum, Rps.rutila [62-64] was previously studied. Hence, the effect of carbon sources on hydrogen
production under anaerobic light was studied and the results are presented in (Table 2). It is clear that from (Figure: 2) that the bacteria under investigation showed preference towards carbon source present in the medium.
Rps.palustris preferred acetate and tartarate for the production of hydrogen. Maximum hydrogen production took
place at 24th hour while hydrogen production could not be recorded at 30th hour incubation. 0
100 200 300 400 500 600 700 800
pH 4 pH5 pH6 pH7 pH8
%
o
f
H
y
d
ro
g
e
n
i
n
(p
p
m
)
Different of pH Medias
6hr
12hr
18hr
Table 2: Effect of Carbon source on hydrogen (%) produced at different incubation intervals (1g/Litter)
S.No Carbon source Optical Density (at 660nm)
percentage of hydrogen produced at different incubation time
6h 12h 18h 24h
1 Glucose 0.180 100ppm 300ppm 400ppm 500ppm
2 Lactose 0.226 200ppm 400ppm 500ppm 500ppm
3 Acetate 0.122 200ppm 300ppm 600ppm 700ppm
4 Sucrose 0.160 400ppm 400ppm 600ppm 400ppm
5 Tartarate 0.269 300ppm 500ppm 700ppm 700ppm
. Figure 2: Graphical representation of Carbon source on hydrogen (%) produced
[image:4.595.59.533.492.561.2]Effect of nitrogen sources on hydrogen production have revealed maximum production of hydrogen in ammonium nitrate and thiourea containing medium. Glycine and glutamine were less preferred by the organism for hydrogen production (Table 3 and Figure:3). Perusal of (Table:4 and Figure:4) shows that cyanocobalmine induced maximum production of hydrogen.
Table 3: Effect of nitrogen sources on hydrogen (%) produced at different incubation intervals.
S.No Nitrogen source Optical Density (at 660nm)
Percentage of hydrogen produced at different incubation time
6h 12h 18h 24h
1N Ammonium chloride 0.387 100ppm 500ppm 700ppm 700ppm
2N Glycine 0.339 100ppm 200ppm 300ppm 500ppm
3N Ammonium nitrate 0.406 200ppm 200ppm 700ppm 800ppm
4N Thio urea 0.227 200ppm 300ppm 600ppm 800ppm
[image:4.595.134.464.594.646.2]5N L(+) Glutamine 0.445 100ppm 300ppm 600ppm 600ppm
Table 4: Effect of growth factors on hydrogen (%) produced at different incubation intervals
S.No Growth factors (µg/ml) pH percentage of hydrogen produced at different incubation time
6h 12 h 18h 24h
1G Biotin 6.8 300ppm 400ppm 500ppm 600ppm 2G Thiamine 6.8 200ppm 500ppm 600ppm 700ppm 3G Cyanocobalamine 6.8 200ppm 400ppm 800ppm 800ppm 0
100 200 300 400 500 600 700 800
Glucose Lactose Acetate Surcose Tarraate
%
o
f
H
y
d
ro
g
e
n
i
n
(p
p
m
)
Different Carbone soures
6hr
12hr
18hr
______________________________________________________________________________
[image:5.595.77.521.90.478.2]. Figure 3: Nitrogen sources on hydrogen (%) produced graph
.
Figure 4: Graphical representation of growth factors on hydrogen (%) produced
REFERENCES
[1]Vasavi, D., M .Ramchander, S. Girisham and S.M. Reddy, Bioinfolet., 2007, 4:139-145.
[2]Bergstein Ben Dan T., A. Adin, A. Gasith, B. Fattal, J. Garty, A. Kanarek and Y. Steinberger, Water Science
and Technology., 1993. 27: 431
[3]Ramasamy, Y., C.V. Seshadri, T.M. Vatsala and S.K. Rakshit, Australian J. of Biotech., 1990, 4: 287-289. [4]RamchanderMerugu, M.S.K.Prasad, D.Vasavi, S.Girisham and S.M.Reddy. Ecol. Envi. Con. 2008. 14; 485-487. [5]Kobayashi, M.Advances in Agricultural Microbiology, N.S. Subba Rao (ed.), (1982). pp. 643-661.
[6]Sunita and Mitra, Sunitha, M. and C.K. Mitra, 1993. J. Biosciences, 18 : 155-160.
0
100
200
300
400
500
600
700
800
900
%
o
f
H
y
d
ro
g
en
i
n
(
p
p
m
)
Different Nitrogen Soures
6hr
12hr
18hr
24hr
0 100 200 300 400 500 600 700 800 900
6hr 12hr 18hr 24hr
%
o
f
H
y
d
ro
g
e
n
i
n
(p
p
m
)
Different Growth Factors
Biotin
Thiamine
[7]Vasavi, D., M .Ramchander, S. Girisham and S.M. Reddy, Bioinfolet., 2007. 4:139-145. [8]Demchick R.S., Turner F.R. and Gest H. 1990. FEMS. Microbiol. Lett.,67: 139-144. [9]Sasikala.K.,Ch.V.Ramana and P.Raghuveer Rao, Int.J.Hydrogen energy., 1991, 16 :597-601 [10]Andreas Kappler, Claudia Pasquero, Annali di chimica, 2006, 96 : 195-203.
[11]Anthony Ranchou-Peyruse, Rodney Herbert, Pierre Caumette and Rémy Guyoneaud, Environmental
Microbiology, 2006,8:1590 – 1599
[12]Overmann and Ann K. Manske. Anoxygenic phototrophic bacteria in the black sea. Chemocline.,(2006),volume 64523-541.Nato science series: iv: Earth and environmental sciences: Past and Present Water Column Anoxia Springer, Netherlands
[13]Blankenship, R.E., Madigan, M.T. and Bauer, C.E, Advances in Photosynthesis., 1995, 2 XXIV: 1331. [14]Vatsala, T.M. United States Patent., 1990, US 4 : 921, 800, 3.
[15]Sasikala, Ch., Ch. V. Ramana and G.S. Prasad, World J. of Mic. Bio. Biotech.,1994, 10 : 221-223.
[16]Burgess, E.A., Osborne, K.A., Pereira, H.S., Hilliker, A.J., Campos, A.R., Sokolowski, M.B, Behavior genetic analysis of foraging: from nature to molecule.,1994, A. Dros. Res. Conf. 35 : 98
[17]Edward,J.W and S.W Andrew, Appl.Biochem.Biotechnol.,2002, 98:611-625.
[18]Ram C. Merugu, S.Girisham and S.M.Reddy. Extracellular enzymes of two anoxygenic phototrophic bacteria isolated from leather industry effluents Vol. 4, Issue 2, 2010 Biochemistry: An Indian Journal.2011a Ramchander Merugu, M. P. Pratap Rudra, A. Sridhar Rao, D. Ramesh, B. Nageshwari, K. Rajyalaxmi, S. Girisham, and S. M. Reddy Influence of Different Cultural Conditions on Photoproduction of Hydrogen by Rhodopseudomonaspalustris KU003, ISRN Renewable Energy Volume 2011, Article ID 328984, 6 pages (2012b) Biotechnological Applications Of Purple Non Sulphur Phototrophic Bacteria: A Minireview, Ramchander Merugu, M.P.Pratap Rudra, S.Girisham and S.M.Reddy. International Journal of Applied Biology and Pharmaceutical Technology, ISSN 0976-4550, Page: 376.
[19]Kumazawa and Shimamura, Kumazawa, S. and K. Shimamura, 1993. J. of Marine Bio-tech.1993,1: 159-162. [20]Melis, A., Int. J. Hydrogen Energy, 2002, 27 : 1217-1228.
[21]Sunitha, M. and C.K. Mitra, J. Biosciences,1993, 18 : 155-160.
[22]Thangaraj, A. and Kulandaivel, G. Bioresource Technology., 1993. 49: 9-12. [23]Melis, A., Int. J. Hydrogen Energy.,2002, 27 : 1217-1228.
[24]Lee CM, P.C Chen, C.C.Wang and Y.C.Tung, Int. J Hydrogen Energy.,2002, 27:1309-13.
[25]Hoekema, S., M. Bijmans, M. Tanssen, J. Tramper and R.H. Wijffels, Int. J. Hydrogen Energy,2002, 27 : 1331-8.
[26]Vasavi, D.,M.Ramchander, S.Girisham and S.M.Reddy, 2002 Ecol. Envi. Con.14; 363-366
[27]RamchanderMerugu, M.S.K. Prasad, S. Girisham and S.M.Reddy, 2008, Ecol. Envi. Con. 14; 367-369 [28]Ramchander, M., M.S.K.Prasad, Vasavi,D S. Girisham and S.M. Reddy, Nat.Acad. Sci. Lett.2007, 30. 223-227 [29]Melis, A., Int. J. Hydrogen Energy.,2002, 27 : 1217-1228.
[30]Peiqing Zhou, Elsayed Elbeshbishy, George Nakhla. Bioresource Technology, 2013,130. 710–718 [31]Najafpour, G., Younesi, H., Mohammed, A.R., Biochem. Eng. J.,2004, 2:123-130.
[32]Gosse Jl,engel,BJ,Rey FE, Harwood CS,SerivenLE,Flickenger MC. Biotechnol Prog.2004,23:124-30. [33]Maness, P.C. and P.F. Weaver, Int. J. Hydrogen Energy, 2002, 27:1407-11.
[34]Najafpour G., Younesi H. and Mohamed A. R. Energy Sources vol.2006, 28, 1013-1026.
[35]Biebl, H. and N. Pfennig, Isolation of members of the family Rhodospirillaceae. In : The Prokaryotes. Eds.: M.P.Starr, H.Stolp, H.G.Truper, A.Balows and H.G.Schlegel. Springer-Verlag, Berlin. pp.,1981, 267.
[36]Bergey’s Manual of Systematic bacteriology, “Enrichment and isolation of purple non sulphur photosynthetic bacteria”. Eds: J.T. Staley, M.P.Byrant, N.Pfennig and J.C.Holt.1989.
[37]Truper H.G. and Pfennig N, Characterization and identification the anoxygenic phototrophic bacteria. In: The Prokaryotes. Eds.: M.P.Starr, H.Stolp, H.G.Truper, A.Balows and H.G.Schlegel. Springer-Verlag, , New York.1989, Pp 299
[38]Kumazawa ,S. and A.Mitsui,.Int.J.Hydrogen energy.,1981, 6:339-348.
[39]Vincenzini,M., R.Materassi, M.R.Tredici and G.Florenzano, Int. J. Hydrogen Energy.,1982, 7:. 231-236. [40]Rajani., Photosynthetic bacteria and their applciaiton inhydrogen prodcuiton.theis submitted to the department of Botnay osmania university,Hydreabad,1992.
[41]Gokhan Kars, Ufuk Gunduz, Meral Yucel, Lemi Turker, Inci Eroglu., The effect of Different concentrations of Mo and Fe on the expression level of nifHDK and hupS genes in Rhodobacter sphaeroides O.U001. Proceedings of International Hydrogen Energy Congress and Exhibition (IHEC-2005)13-15, Istanbul.
______________________________________________________________________________
[43]Kaushik Nath and Debabrata Das, Effect of light intensity and initial pH during hydrogen production by an integrated dark and photofermentation process. International Journal of Hydrogen Energy Article in Press, Corrected Proof,2009.
[44]Dabrock, B., Bahl, H., Gottschalk, G., Appl. Environ. Microbiol.1992, 58, 1233–1239. [45]Lay, J.-J., Y.-J. Lee, and T. Noike, Water Research, 1999. 33(11): p. 2579-2586. [46]Lee, Y.J., T. Miyahara, and T. Noike, Bioresource Technology, 2001. 80(3): p. 227-231. [47]Lay, J.-J., Y.-J. Lee, and T. Noike, Water Research, 1999. 33(11): p. 2579-2586. [48]Fang, H.H.P., Liu, H., Bioresour. Technol.,2002, 82 (2), 87–93
[49]Srinivas Munjam, D. Vasavi, S. Girisham and S.M. Reddy., Ind. J. Microbiol.,2002, 42 : 215-218. [50]Vasavi, D., M .Ramchander, S. Girisham and S.M. Reddy, Bioinfolet.,2007, 4:139-145.
[51]Ramchander Merugu, M.P.Pratap Rudra, S.Girisham and S.M.Reddy. International Journal of Applied Biology
and Pharmaceutical Technology, ISSN 0976-4550, Page: 376
[52]Srinivas Munjam, D. Vasavi, S. Girisham and S.M. Reddy, Ind. J. Microbiol.,2002, 42 : 215-218. [53]Hamme,J.D.V.,A.Singh, and O.P.Ward, Microbiol.Mol.Biol.Rev.,2003, 64:503-549.
[54]Rajani., Photosynthetic bacteria and their application in hydrogen production. thesis submitted to the department of Botnay osmania university,Hydreabad,1992.
[55]Sasikala, Ch. and Ch.V.Ramana, Advanced Applied Microbiology,1995,41:173-226.
[56]Srinivas Munjam, D. Vasavi, S. Girisham and S.M. Reddy, Science and Culture., 2000, 66 : 339-341. [57]Maria, S. F., L. M. Russell, B. J. Turpin, and R. J. Porcja, Atmos. Environ.,2002,36, 5185–5196.
[58]Sung Lee, Taowei David Wang , Nada Hashmic , Michael P. Cummings . Future Generation Computer
Systems., 2007, 23.497–509.
[59]Vasavi, D., M .Ramchander, S. Girisham and S.M. Reddy, Bioinfolet, 2007, 4:139-145. [60]Najafpour GD, Younesi H, Ku S, Ku I, Bioresour. Technol., 2004, 92: 251-260
[61]Koku,H., I. Eroglu, Ufuk Gunduz, Meral Yucel, Lemi Turker. International Journal of Hydrogen Energy.,
2003, 28, 381 – 388.
[62] Christopher R. Harlow, Mick Rae, Lindsay Davidson, Philip C. Trackman, and Stephen G. Hillier
Endocrinology, January 2003, 144(1):154–162.
[63]Srinivas Munjam, D. Vasavi, S. Girisham and S.M. Reddy, Ind. J. Microbiol., 2002, 42: 215-218.
[64]Najafpour, G. D, Zinatizadeh, A. A. L, Mohamed, A. R, & Hasnain, M. Isa., H.Nasrol‐ lahzadeh, High-Rate anaerobic digestion of palm oil mill effluent in an up‐ flow anaerobic sludge-fixed film bioreactor. Biochemistry,