Significant Study of Scale Factor in Phase-based
Terrestrial Laser Scanner Datum Transformation
Mohd Azwan Abbas1,2,*, Zulkepli Majid2, Albert K. Chong3, Mohamad Aizat Asyraff Mohamad Azmi1,
Mohamad Asrul Mustafar1, Khairulnizam M. Idris2, Lau Chong Luh2, Anuar Aspuri2,
Nurathirah Mat Zain1, Norhadija Darwin2
1Faculty of Architecture, Planning & Surveying, Universiti Teknologi MARA, 40450 Shah Alam, Malaysia 2Faculty of Built Environment & Surveying, Universiti Teknologi Malaysia, 81310 Skudai, Malaysia
3School of Civil Engineering & Surveying, University of Southern Queensland, Australia
Received July 1, 2019; Revised September 15, 2019; Accepted September 22, 2019
Copyright©2019 by authors, all rights reserved. Authors agree that this article remains permanently open access under the terms of the Creative Commons Attribution License 4.0 International License
Abstract
Rapid, direct and dense three-dimensional (3D) data acquisitions have become compulsory requirement for most applications that demand complete 3D information. Though, it is impossible to obtain data that cover the whole surface of the object from single sensor position. In terrestrial laser scanner (TLS) measurement, this multi positions issue was resolved using similarity transformation. However, only six (6) parameters were employed while scale factor was neglected. Since TLS measurement were utilised in many applications especially that demand high accuracy data, thus, further study is necessity to ensure the significant of neglecting scale factor in TLS datum transformation. Utilising robust experiment which involves with multi network configurations and multi distances, all seven (7) parameters were computed and scale factors were extracted for the further assessment. Significant analysis was performed by comparing the ideal value of scale factor (i.e. 1) and values obtained from the experiments. Results obtained for all configurations have accepted null hypothesis which indicates that scale factor is not significant in phase-based scanner datum transformation.Keywords
Datum Transformation, Network Configuration, Scale Factor, Three-Dimensional Data1. Introduction
Ability to acquire high density three-dimensional (3D) data with fast measurements (up to one million points per second) has become main factor that terrestrial laser scanner (TLS) was employed in many 3D applications. This high precision provides enough raw data from which accurate and
detailed 3D models can be obtained. According to Dumalski and Hejbudzka [1], TLS has shown a promising precise measurements to define minimal displacement and deformation of objects. This has been demonstrated via their experiment that conducted using five different intervals (1mm, 3mm, 5mm, 10mm and 20mm) and several distances which eventually reaching the maximum range of the scanner. Due to that advantages, TLS has become an option for a variety of applications that demand sub-centimetre geometric accuracy such as industrial measurements.
quality assurance procedure to quantify the quality of TLS data. The outcomes have demonstrated that the improved calibration technique able to enhance the precision and accuracy of TLS measurement.
To acquire data that cover the whole surface of the object, it is impossible to obtain from one observing point. Two or more occupied stations cannot be avoided, and for TLS system, this will create more than one local coordinate systems proportionate with the station numbers. Conversion of all local coordinates into one global TLS coordinate system can be established with the aid of transformation parameters. Similar parameters also required when TLS global coordinate system has to be transformed into ground or national system. The seven (7) transformation parameters are as follow [6]:
• Translation in three axes (TX, TY, TZ);
• Rotation around the three axes (ω, φ, κ); and • Scale factor.
However, according to Reshetyuk [7], TLS datum transformation only embraced six (6) parameters by neglecting the scale factor. As stated in Song et al. [8], sources of errors that can affect the quality of TLS measurement are very numerous, whether from acquisition or processing phases. Rueger [9] has summarized that scale errors in range measurement are contributed from internal (e.g. limitation or configuration of sensor) and external effects (e.g. environmental factor). Considering the complex mechanism adopted by TLS in providing dense 3D data with non-contact measurement, it is expected that various of causes can contribute to scale errors in TLS data acquisition, such as high incidence angle, environmental factors, erroneous geometrical reduction (e.g. dependency on point cloud resolution to determine target centroid), among others. Based on that argument, further investigation is necessary to robustly prove that contribution of scale factor in TLS rigid body transformation is insignificant. Taking into account the mechanism utilised in deriving range measurement, it can be assumed that modulation of laser beam employed by phase based scanner is expose to scale errors. This is due to the dependency on wavelength and phase difference in deriving the range measurement. Considering range measurement is expose to this kind of error, thus, neglecting scale factor in TLS datum transformation is consider questionable.
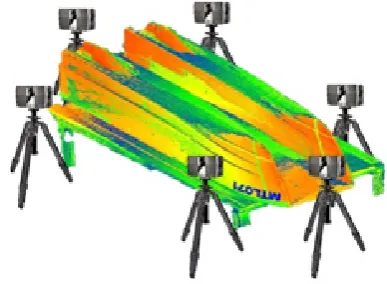
[image:2.595.333.527.323.465.2]As most of the TLS implementation in industrial measurement involve with very complex object, thus, occupying many station numbers cannot be avoid. Illustrated in Figure 1 is example of scan stations utilised to scan small boat prototype. Due to the demand of many stations in most of TLS applications, neglecting scale factor in registration procedure should be reconsidered. Any possible uncertainty especially during processing should be taken into account. Based on this argument, this study has scrutinise the effect of scale factor in TLS registration procedure. Robust experiments were conducted using multi-network configurations and multi-distances. Three main elements were utilised for the multi-network configurations: (i) station numbers; (ii) real-world planes to distribute the targets; and (iii) number of targets. Taking into account the requirement of industrial implementation that demand sub-centimeter accuracy [10] with medium range data acquisition, thus, phase-based scanner (i.e. Faro Focus 3D) was employed in this evaluation study.
Figure 1. Six (6) stations utilised to scan boat prototype [5]
2. Phase
-
based Scanner
In contrast with time-of-flight scanner which exploited high precision clocks, phase-based scanner has modulated the power of laser beam in amplitude and transmitted into the object. The scattered reflection is collected and a circuit measures the phase difference (ΔΦ) between the send and receive waveforms (Figure 2).
[image:2.595.137.474.606.740.2]The phase difference is proportional to the range and laser modulation frequency. The amplitude of the received, diffusely reflected laser light is proportional to the surface reflectively and distance of the object. Phase based scanner can determine the range (r) by using (1), (2) and (3) [10].
λ ∆ + λ =
×r N
2 (1) where,
N = Number of full wavelengths λ = Wavelength
Δλ = Uncompleted wavelength
In order to compute the range of TLS and target, the values of N and Δλ should be determined. Equation (2) below represents the relation between uncompleted wavelength and phase difference (ΔΦ) [11].
λ × π ∆Φ = λ ∆
2 (2) Since, only phase difference can be provided during measurement, then (2) could be finalised as follows [11]:
λ × π ∆Φ + λ =
4 2 N
r (3)
Based on (3) above, it is impossible to get the range value directly using a simple phase difference measurement technique. This is known as the ambiguity interval and the size can be in the order of several meters. The maximum unambiguous is given by (4) [11].
2 f 2
c
rmax = λ
×
= (4) where,
c = Speed of light f = Frequency
If the range is unambiguous (less than Rangemax), the range can be determined from the following equation [11]:
λ × π ∆Φ =
4
[image:3.595.158.454.349.736.2]r (5) In order to avoid the inconvenience of a range ambiguity interval, one can use multiple frequency waveforms in which the target is localised at low frequency (long wavelength) and then accurate measurement is performed at high frequency (Figure 3).
Figure 3. Multiple frequency waveforms [9]
3. Three-Dimensional Conformal
Coordinate Transformation
According to Ghilani [6], a 3D conformal coordinate transformation is utilise to convert 3D coordinates from one system to another system. As practice in TLS measurement, the system will create their own local coordinates system for each scanner position. Thus, to orient all local system into one global coordinates system, derivation of transformation parameters is mandatory. Based on Figure 4, three (3) well-distributed common targets (minimum requirement, more targets are better) were used to determine transformation parameters between scanner positions TLS1 and TLS2.
Utilising resection method, those artificial targets that have two coordinate systems derived from TLS1 and TLS2 can be employed to mathematically describe the relationship of those systems [10]:
Xi = T + S∙r∙xi (6) where,
Xi = 3D coordinates of targets in the first scanworld system.
S = scale vector between two (2) systems. T = translation.
r = rotation matrix.
xi = 3D coordinates of targets in the second scanworld system. + = z y x r r r r r r r r r S T T T Z Y X 33 23 13 32 22 12 31 21 11 Z Y X (7) where,
TX, TY and TZ are translation of the origin in 3D axes.
While definitions of the elements of the rotation matrix r is given as follow [10]:
φ ω = φ ω − = φ = κ φ ω + κ ω = κ φ ω − κ ω = κ φ − = κ φ ω − κ ω = κ φ ω + κ ω = κ φ = cos cos r cos sin r sin r sin sin cos cos sin r sin sin sin cos cos r sin cos r cos sin cos sin sin r cos sin sin sin cos r cos cos r 33 32 31 23 22 21 13 12 11 (8) where, κ φ
ω, , are rotation angles around 3D axes.
4. Experiments
The main objective of this study is to robustly substantiate the significant of scale factor in phase-based scanner datum transformation. For that purpose, Faro Focus
3D scanner were rigidly experimented as follow: (i) Multi network configurations; and (ii) Multi distances assessment.
Each experiment was designed for specific reason, multi network configurations employed to measure the effect of scale factor for indoor implementation which also involves with high incidence angle occurrence, while the later experiment capable to assess any changes with regard to various distances. Statistical analysis was utilized in both experiments to mathematically verify the outcomes of this study.
4.1. Multi Network Configurations
To represent phase based scanner, this experiment was conducted by using Faro Focus 3D (Figure 5). First experiment (i.e. multi networks) was conducted at laboratory with dimension of 15m × 9m × 3m. To certain the quality of the yielded results, the ideal configurations were embraced based on Lichti [12] outcomes. With intention to investigate the effect of scale factor in TLS datum transformation, variants of configurations were employed as follows: (i) Multi scanner positions; (ii) Multi surfaces; and (iii) Multi targets.
[image:4.595.329.533.436.571.2]To avoid from using similar configurations for each variation, final setup obtained from previous configurations were used for subsequent variation. For instance, if final setup for the first configurations (scan stations) is using two (2) stations, thus, second configurations (surfaces) will continue with similar number of station.
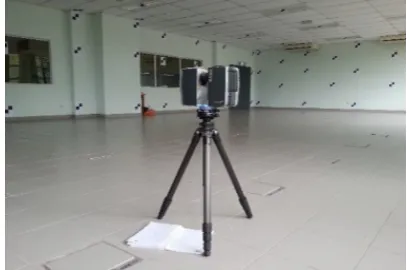
Figure 5. Experiment of scale effect in phase based scanner datum transformation
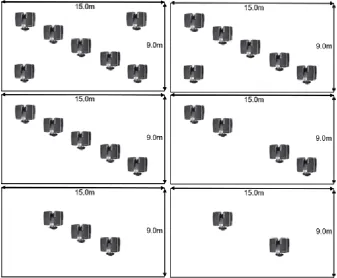
4.1.1. Minimum Number of Scan Stations
For the first experiment, the configuration was reduced the number of scanner positions (from seven) one by one until two positions left as illustrated in Figure 6. The bundle adjustment is performed for each station reduction procedure to produce the value of transformation parameters. Mathematical approach was utilised to thoroughly examine the significant of scale factor for every bundle adjustment (configuration) results.
4.1.2. Number of Surfaces
utilised for targets distribution. There are four walls and a ceiling were employed in this study. To vary the number of surfaces, experiment was manually remove those surfaces one at a time until two surfaces left as shown in Figure 7.
[image:5.595.136.474.142.420.2]The removing criteria were made by taking into account guideline of network configuration as discussed in [13]. Bundle adjustment was performed for each removing procedure and followed with scale factor analyses.
Figure 6. Reducing number of scan stations
[image:5.595.169.446.453.637.2]4.1.3. Minimum Number of Targets
[image:6.595.331.532.76.259.2]The final experiment was carried out by reducing number of targets which are employed to determine transformation parameters. This configuration was performed by decreasing the number of targets from two surfaces (46 targets) by every ten percents until sixty percents were removed (18 targets left). The criteria employed during targets reduction was made based on quantitative condition as stated by [13]. As demonstrated in Figure 8, outcomes from previous experiments were utilised for the final configuration, two scanner positions and two surfaces. To ensure the quality of computed transformation parameters, the targets have been well distributed in each decreasing procedure. Similar to the previous experiments, bundle adjustment is performed in each targets reduction configuration and followed with scale factor analyses.
Figure 8. Reducing the number of targets
4.2. Multi Distances
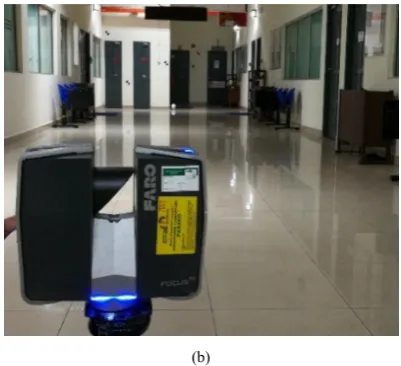
To examine the significant of phase based scanner measurement in multi ranges observation, final experiment has been performed at indoor calibration site located in Faculty of Built Environment and Surveying, Universiti Teknologi Malaysia, Malaysia. Six (6) points were marked as visualised in Figure 9a with interval 10m, range from wall where targets distribute (right side of Figure 9a) into last point is 60m. For registration purpose, four (4) plane and two (2) sphere targets were utilised. Phase-based (i.e. Faro Focus 3D) was positioned in every mark to scan all six (6) targets (as depicted in figure 9b).
(a)
(b)
Figure 9. Multi-distances experiment, (a) Indoor calibration site; and (b) Faro Focus 3D (phase based) scanner
Taking into consideration that the closest scan station (with range 10m from targets) will contribute less errors in determining target centroids, pairwise registration for other stations was performed by exploiting this closest station as reference. This has result five (5) registration pairs yielded for multi-distances investigation. To concretely support the results obtained, this study has consumed statistical analysis to verify the significant of scale factor in TLSs registration processing.
4.3. Statistical Analysis
Statistical analyses were utilised between the calculated scale factor and the ideal value of scale (i.e. one). Analysis of mean (t distribution) was used to compare population mean with the mean of a sample set based on the number of redundancies in the sample set. Thus, this test was applicable to examine a sample mean (calculated scale) against a known value (ideal scale value) [6]. The hypotheses were set as follow:
H0: Computed scale factor is equal to one
HA: Computed scale factor is not equal to one
The F-variance ratio test is defined as:
n S
μ y t
/
−
= (9)
where,
y= Sample mean μ= Population mean
S = Standard deviation of sample n = Number of sample
According to Ghilani [6], when the value of calculated T is smaller than the value of critical T (obtained from the t-distribution table), the null hypothesis (H0) is accepted at
the 5% significance level. In contrast, with the rejection of null hypothesis (accepting alternative hypothesis, HA)
[image:6.595.75.279.282.400.2]difference.
5. Results and Analyses
Evaluation of scale factor affect in phase based scanner datum transformation procedure was made by taking into account two (2) crucial elements, multi network configurations and distances. Therefore, research findings have been organised based on these elements as discussed in the previous section.
5.1. Multi Network Configurations
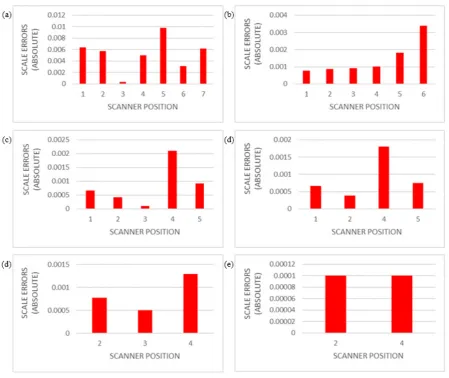
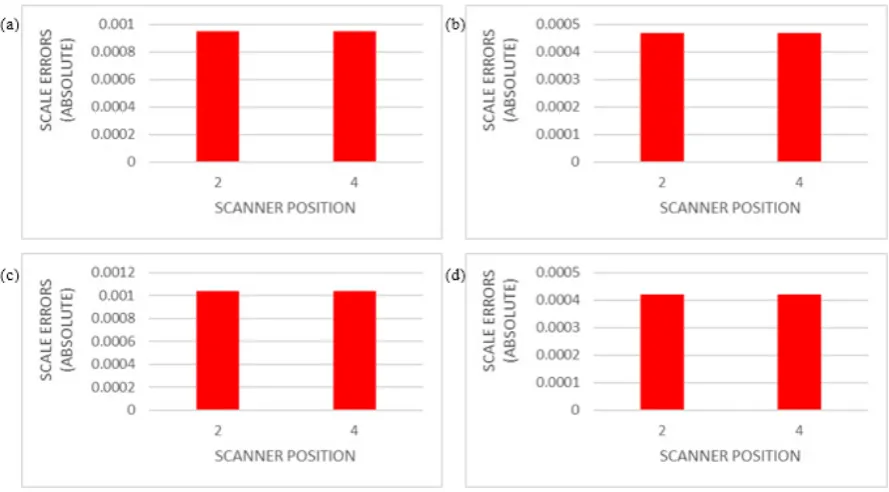
The first configuration is by decreasing the number of scanner positions. For each reduction procedure, scale errors were calculated and F-variance ratio test is performed. As illustrated in Figure 10, the largest scale error in multi stations experiment were contributed by station one (Figure 10a with value of 0.010), follow with station six (Figure 10b with value of 0.0034) and station four (Figure 10c and Figure
10d with values of 0.002). From the outcomes of multi stations experiment, the trend of plotted scale errors has significantly indicated that this uncertainty (scale errors) occurred due to the high incidence angles in measuring the targets when the occupied station very close to the surfaces where the targets distributed (i.e. station one, six and four). Similar issue regarding a bias related to measuring obstacles with high incidence angles also has been roused by Laconte et al. [14]. Even though the largest scale error obtained is 0.01, statistical analyses presented in Table 1 has shown that, in all configurations, the calculated T are smaller than critical T. Thus, the null hypothesis (H0) was accepted, with 95% confidence level show that the difference between the variances for each scan stations reduction were not significant. With regard to the small magnitude of the obtained scale errors which is less than one, it may be the main cause for this statistical finding. However, for TLS data quality assurance, it is advisable to avoid the existence of high incidence angle, especially when involve with long range measurement.
[image:7.595.79.529.329.707.2]Table 1. Significant test for multi stations configuration Scan Stations Calculated T < / > Critical T
Full networks 0.924 < 1.943
1, 2, 3, 4, 5, and 6 1.446 < 2.015
1, 2, 3, 4, and 5 0.978 < 2.132
1, 2, 4,and 5 0.726 < 2.353
2, 3, and 4 0.681 < 2.920
2 and 4 0.515 < 6.314
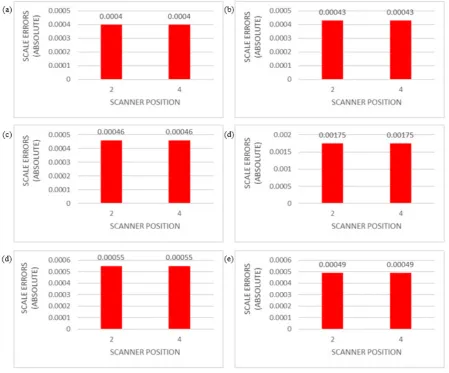
[image:8.595.81.526.270.516.2]The second configuration was performed by using only two scan stations. By using these two scan stations, the targets surfaces were reduces from five surfaces until two surfaces were left. Employing only two scanner positions in multi surfaces experiment, graphs of scale errors shown in
Figure 11 have indicated the significant quality of datum transformation solution. The largest scale errors in multi surfaces experiment was contributed by Figure 11c (i.e. 0.00104) which used three surfaces by removing both length walls for targets distribution. With limited sighting distance in vertical element, it is expected that all targets distributed at the ceiling will cause errors in range measurement due to high incidence angles occurrence. Similar to multi station outcomes, small magnitude of scale errors has resulted that all calculated T for multi surfaces experiment are smaller than critical T (as shown in Table 2). This imply that, the null hypothesis was accepted or no significant differences between ideal scale value (i.e. 1) and calculated scale from second experiment.
Table 2. Significant test for multi surfaces configuration
Surfaces Calculated T < / > Critical T 4 walls and a ceiling 0.515 < 6.314
4 walls 0.235 < 6.314
3 walls 0.370 < 6.314
2 walls and a ceiling 0.524 < 6.314
2 walls 0.048 < 6.314
Employing two scan stations and two surfaces, final network configuration experiment was performed to analyse the effect of scale factor by reducing the number of targets. Only 46 of targets out of 138 targets are remained after these reductions has made form previous experiments. Scale errors were plotted in Figure 12, again the datum
transformation has shown better solution as compared to the multi stations configuration. However, distribution of targets also can affect the values of calculated parameters as stated by Fraser [15]. This statement was proven when the largest scale error obtained in this experiment (i.e. 0.00175) is larger than the second experiment. Based on Table 3, statistical analysis by t-test has verified that at 95% confidence level shows that the difference between variances for all target reduction were not significant. The calculated T values are smaller than critical T. With acceptance of the null hypothesis for the first experiments: (i) multi scan stations, (ii) multi surfaces and (iii) multi target points, a preliminary conclusion can be made that the scale factor can be neglected for phase based scanner datum transformation.
[image:9.595.78.528.275.648.2]Table 3. Significant test for multi targets configuration Percentage of targets reduction Calculated T < / > Critical T
10% reduction 0.050 < 6.314
20% reduction 0.012 < 6.314
30% reduction 0.043 < 6.314
40% reduction 0.744 < 6.314
50% reduction 0.161 < 6.314
60% reduction 0.010 < 6.314
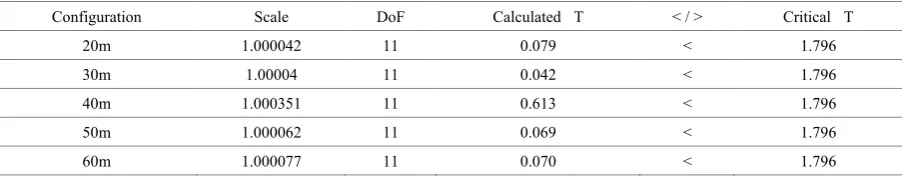
5.2. Multi Distances
The multi distances experiment were conducted by exploiting the multi ranges of scan stations from distributed targets. Both scanners were move gradually every 10m until 60m. Considering 10m position able to well-determine the targets centroid among others, thus, this occupied station was selected as reference for datum transformation computation.
The scale errors obtained for 20m until 60m ranges were illustrated in Figure 13. The largest scale error (i.e. 0.0004) was contributed from occupied station at 40m range. Further investigation was performed regarding this largest uncertainty occurrence, and it is found that scanner position at 40m range has high exposure of light compare to others [16]. Neglecting the scale errors from station at 40m range, the trend of scale errors has indicated direct proportionate between the ranges and scale errors. In other word, distance from scanner to object can contribute for error in derivation of range in TLS measurement which eventually will affect the magnitude of scale error. Nevertheless, the conducted statistical test to determine whether the calculated scale factors are similar to the ideal
value (i.e. one) at a 95% confidence level has yielded fascinating results. As presented in Table 4, in all conditions computed values of T are smaller than the tabulated or critical T, thus, the null hypothesis can be accepted. In other words, multi distances experiment has mathematically proved that scale factor is insignificant in phase based scanner datum transformation. With the findings from both experiments (multi networks and distances), this quality assurance assessment has statistically verified that scale factor is insignificant in phase based scanner datum transformation. However, this study only emphasis on scale factor effect in registration process which involves with one sensor. Further study is crucial to investigate the significant of scale factor in georeferencing procedure which utilises data from other sensor.
Figure 13. Multi sensors experiment using phase based scanner
Table 4. Multi distances statistical test for Faro Focus 3D (phase based scanner).
Configuration Scale DoF Calculated T < / > Critical T
20m 1.000042 11 0.079 < 1.796
30m 1.00004 11 0.042 < 1.796
40m 1.000351 11 0.613 < 1.796
50m 1.000062 11 0.069 < 1.796
[image:10.595.312.530.280.462.2] [image:10.595.73.525.513.602.2]6. Conclusions
With the aim to evaluate the significant of scale factor in TLS datum transformation, this study has performed robust experiments using two (2) different configurations: (i) Multi networks; and (ii) Multi distances. Multi networks consist of three variants of experiment: (i) Variation of scanner station; (ii) Variation of surfaces to distribute all targets; and (iii) Variation of targets. First variation which employed multi stations configuration has proved that selection of scanner position with high incidence angle can contribute for large scale error, while second (multi surfaces) and final (multi targets) experiments have indicated the requirement of well distributed targets to derive the transformation parameters. However, analyses for all variations for the first configuration have concluded that the scale factor is not significant in phase based scanner datum transformation. For the later experiment which employed multi distances configuration has shown the effect of light in TLS measurement that can affect the quality of data. However, statistical analyses have indicated that null hypotheses of all scanner ranges showed that the scale factor yielded from both scanners can be neglected. This conclusion is applicable for the phase based scanner with medium range measurement. Further significant study on scale factor is necessary when measurement involved with long range measurement, multi scanners and multi sensors (for georeferencing purpose).
Acknowledgements
We would like to thank the Universiti Teknologi MARA and Photogrammetry and Laser Scanning Research Group, Universiti Teknologi Malaysia (under research votes 5F054 and 03K19) for providing funding, instruments and experimental site.
REFERENCES
A. Dumalski, and K. Hejbudzka. An Attempt at Using a [1]
Terrestrial Laser Scanner for Detecting Minimal Displacement and Objects’ Deformations. FIG Congress, Sydney, Australia, 2010.
H. González-Jorge, B. Riveiro, P. Arias, and J. Armesto. [2]
Photogrammetry And Laser Scanner Technology Applied To Length Measurements In Car Testing Laboratories. Measurement, Vol. 45, 354–363.
Y. Bokhabrine, and R. Seulin. 3D characterization of hot [3]
metallic shells during industrial forging. Machine Vision and Applications, Vol. 23, 41-425.
H. Son, C. Kim, and C. Kim. Automatic 3D Reconstruction [4]
of As-Built Pipeline Based on Curvature Computations from Laser-Scanned Data. Proceedings of the 2014
Construction Research Congress: Construction in a Global Network, held in Atlanta, Georgia, May 19-21, 2014 M. A. Abbas, D. D. Lichti, A. K. Chong, H. Setan, Z. Majid, [5]
L. C. Luh, K. M. Idris, and M. F. Mohd Ariff. Improvements to the Accuracy of Prototype Ship Models Measured By Terrestrial Laser Scanner. Measurement, Vol. 100, 301-310.
C. D. Ghilani. Adjustment Computations: Spatial Data [6]
Analysis. 5th Edition. Copyright © 2010 by John Wiley & Sons, Inc., Hoboken, New Jersey, 2010.
Y. Reshetyuk. Self-Calibration and Direct Georeferencing in [7]
Terrestrial Laser Scanning. Doctoral Thesis in Infrastructure, Royal Institute of Technology (KTH), Stockholm, Sweden, 2009.
L. Song, S. Sun, Y. Yang, X. Zhu, Q. Guo, and H. Yang. A [8]
Multi-View Stereo Measurement System Based on a Laser Scanner for Fine Workpieces. Sensors, Vol. 19, Issue 381, 1-16.
J. M. Rueger. Electronic Distance Measurement: An [9]
Introduction. Springer-Verlag Berlin Heidelberg, 1996. I. Elkhrachy. Towards An Automatic Registration for [10]
Terrestrial Laser Scanner Data. A thesis for the degree of Doctor of Engineering at Faculty of Architecture, Civil Engineering and Environmental Science, Technical University at Braunschweig, Germany, 2008.
T. Schulz. Calibration of Terrestrial Laser Scanner for [11]
Engineering Geodesy. A Dissertation submitted for the degree of Doctor of Scinces, Technical University of Berlin, 2007.
D. D. Lichti. Error Modelling, Calibration and Analysis of [12]
an AM-CW Terrestrial Laser Scanner System. ISPRS Journal of Photogrammetry & Remote Sensing, Vol. 61, 307-324.
S. J. Gordon, and D. D. Lichti. Error Propogation in Directly [13]
Georeferenced Terrestrial Laser Scanner Point Clouds for Cultural Heritage Recording. FIG Working Weeks 2004, Athens, Greece, 2004.
J. Laconte; S. P. Deschênes; M. Labussière; F. Pomerleau. [14]
Lidar Measurement Bias Estimation via Return Waveform Modelling in a Context of 3D Mapping. International Conference on Robotics and Automation (ICRA), Montreal, QC, Canada, 20-24 May 2019.
C. S. Fraser. Network Design. In Close Photogrammetry and [15]
Machine Vision. Edited by K. B. Atkinson. Whittles Publishing, Roseleigh House, Latheronwheel, Scotland, United Kingdom, 1996.
S. Lemeš, and N. Zaimović-Uzunović. Study Of Ambient [16]
![Figure 3. Multiple frequency waveforms [9]](https://thumb-us.123doks.com/thumbv2/123dok_us/8748346.891334/3.595.158.454.349.736/figure-multiple-frequency-waveforms.webp)