Journal of Chemical and Pharmaceutical Research, 2016, 8(5):559-566
Research Article
CODEN(USA) : JCPRC5
ISSN : 0975-7384
Development of validated HPTLC method for quantification of oleanolic acid
from bark of Madhuca longifolia
Patel V. S.
*1, Jivani N. P.
2, Patel S. B.
3#, Patel K. G.
1, Panchal H. S.
1and Chhalotiya U.
3*Research Scholar, School of Pharmacy, RK University,
1
Anand Pharmacy College, Anand-388001, Gujarat, India
2R. B. Patel College of Pharmacy, Atkot, Rajkot-360040, Gujarat, India
3Indukaka Ipcowala College of Pharmacy, New Vallabh Vidyanagar, Anand-388121, Gujarat, India
_____________________________________________________________________________________________
ABSTRACT
This study presents the report of TLC densitometric method, which has been developed and validated for quantification of Oleanolic acid from hydroalcoholic extract of bark of Madhuca longifolia. The separation was performed on TLC aluminum plates precoated with silica gel 60 F254. Good separation was achieved in mobile phase using Toluene: acetic acid: formic acid (9:4:0.5). Determination and quantitation were performed by densitometric scanning at 560 nm in reflection/ absorbance mode. This method gave compact spots at Rf 0.53 corresponding to oleanolic acid. The method was validated using ICH guidelines in terms of precision, repeatability and accuracy. Linearity range for oleanolic acid was 100–600 ng/spot with correlation coefficient R2 ±SD = 0.990 ±5.05% in the concentration range 100–600 ng/spot. The LOD and LOQ were found to be 9.302 and 28.1 ng, respectively. The content in crude extract obtained from bark was found to be 0.418± 0.005% w/w. HPTLC method was found to be simple, precise, accurate and convenient method for rapid screening of active constituents present in hydro-alcoholic extract of plant and can be used for analysis and routine quality control of herbal material and formulations containing Madhuca longifolia.
Keywords: Madhuca longifolia, Triterpenoid, HPTLC
_____________________________________________________________________________________________
INTRODUCTION
Madhuca longifoliaJ.F. Macbr. (Sapotaceae), commonly known as mahwa or mahua, is an Indian tropical tree found largely in the central and north Indian plains and forests. It is a fast growing tree that reaches to approximately 20 m in height, possesses evergreen or semi-evergreen foliage. The plant parts are used in ethnomedicine for wide variety of illnesses, such as epilepsy,[1] inflammation, diabetes mellitus, analgesic, anthelmintic, pneumonia, piles and skin diseases.[2]Anti-inflammatory activity,[3] antiulcer activity,[4] and analgesic activity[5] of Madhuca longifolia have
also been reported. The fruit pulp yields a number of triterpenoids (including α and β-amyrin acetate); also
n-hexacosanol, β-D-glucoside of β-sitosterol and free sitosterol. The nut shell contains β-sitosterolglucoside, quercetin
and dihydroquercetin. The carollas are rich source of sugars, vitamins, minerals. The seeds yielded saponins 2,3-di-O-glucopyranoside of bassic acid (saponin A and saponin B). Trunk bark contained lupeol acetate, α-amyrin acetate,
α-spinasterol, erythrodiolmonocaprylate, betulinic acid and oleanolic acid caprylates. [2]
Literature survey revealed that no method has been reported for quantification of oleanolic acid from bark extract of Madhuca longifolia. Hence, a densitometric HPTLC method has been developed in the present work for quantification of oleanolic acid from hydroalcoholic extract of bark of Madhuca longifolia that may be useful to pharmaceutical industry for the authentication, standardisation and quantification of oleanolic acid component in herbal formulations.
EXPERIMENTAL SECTION
Reagents and standards
All chemicals and solvents used were of analytical grade and obtained from E-Merck (Darmstadt, Germany). Stock solutions (mg/ml) of standards were prepared daily in methanol immediately before use. From this, solution was applied using Linomat applicator on TLC aluminum plates precoated with silica gel 60 F254 (10 · 10 cm, 0.2 mm thick) obtained from E. Merck Ltd. (Mumbai, India).
Plant Material
The bark of plant was collected in July from New Vallabh Vidyanagar Campus and authenticated by a Taxonomist, Dept. of Biosciences, Sardar Patel University, Vallabh Vidyanagar, India. The bark were air dried, powdered, sieved, weighed and stored in air tight container and subsequently referred to as powdered drug.
Preparation of standard solution
Oleanolic acid (1 mg/10 ml) was prepared by transferring 1 mg of Oleanolic acid accurately weighed into a 10 ml volumetric flask, dissolving in 5 ml of methanol. It was then sonicated for 10 min and the final volume of the solution was made up to 10 ml with methanol to get stock solution 100 µg/ml.
Preparation of Crude Extract
The dried powdered of bark of Madhuca longifolia (100 g powdered)was defatted with petroleum ether (60º-80ºC) (3X500 ml) by refluxing on water bath for 1 h followed by maceration for 24 h each time. The combined extracts upon concentrating in vacuum produced yellow semisolid residue (0.197%w/w). The remaining marc was extracted with ethyl acetate (3X500ml) by refluxing on water bath for 1 h followed by maceration for 24 h each time. The combined extract upon concentrating in vacuum yielded reddish brown residue (0.546%.w/w).The remaining marc was extracted with n-butanol(3X500ml) by refluxing for 6 h on water bath followed by maceration for 18 h each time. The combined n-butanol extract upon concentrating in vacuum yielded dark brown residue (0.529%w/w). It was dissolved in
minimum quantity of methanol. In the concentrated methanolic extract, excess diethyl ether was added to get precipitates of saponins (0.422%w/w). The precipitates of saponins were separated by centrifugation. The saponins were dissolved in 15 ml methanol: water (30:70). The solution of saponins was hydrolyzed by addition of 5 ml of 2 M HCl and refluxed for 4-6 h at not exceeding 70 ºC. The hydrolyzed extract was cooled and filtered. The filterate
of hydrolyzed extract was fractionated three times with ethyl acetate (3X15ml). The ethyl acetate fraction was concentrated under vacuum to dryness to get sapogenins (0.126%w/w). It was dissolved and diluted with methanol in a100 ml volumetric flask and volume was adjusted up to the mark with methanol.
Chromatography conditions
Chromatography was performed on a 10×10 cm pre-activated HPTLC Silica gel 60 F254 plates (Merck, Darmstadt, Germany). Aliquots of each of the extracts were separately applied (Samples and standard) to the plate as 6 mm wide band with an automatic TLC applicator Linomat-V with N2 flow (CAMAG, Switzerland), 8 mm from the bottom. Densitometric scanning was performed on CAMAG scanner III at 560 nm. The plates were prewashed by methanol and activated at 60 ºC for 5 min prior to chromatography. The slit dimension was kept at 5 × 0.45 and 40
mm s-1 scanning speed was employed. The mobile phase consisted of Toluene: acetic acid: formic acid (9:4:0.5) and
10 ml of mobile phase was used per chromatography. Linear ascending development was carried out in 10 × 10 cm twin glass chamber saturated with the mobile phase.
Detection and quantitation
After development, plates were dried with a hair dryer and then derivatization of the chromatogram was performed by Camag glass reagent spray by spraying with Anisaldehyde sulphuric acid, heated at 105 ºC for 5 min. Quantitative analysis of the compounds was done by scanning the plates at 560 nm using Camag TLC scanner III equipped with win-CATS-V 1.2.3 software (Camag).The identification of oleanolic acid was confirmed by superimposing
the UV spectra of the samples and standards within same Rf 0.53 window (Fig. 2). A densitometry HPTLC analysis was also performed for the development of characteristic fingerprint profile, which may be used as a marker for quality evaluation and standardization of the drugs.
Calibration curve of Oleanolic acid
The content of Oleanolic acid compound was determined by using a calibration curve established with a standard concentration range from 100 to 600 ng/spot. A stock solution of standard Oleanolic acid (10 µg/ml) was prepared in methanol. The different volumes of stock solution 10, 20, 30, 40, 50 and 60 µl were spotted on HPTLC plate to obtained concentration 100, 200, 300, 400, 500 and 600 ng/spot, respectively (band width 6 mm, distance between tracks 12 mm) using automatic sample spotter. Each concentration peak area was plotted against the concentration
of Oleanolic acid spotted or injected. The linear regression of standard curve was determined with R2 = 0.991. The
linear regression line is y = 16.898x - 772.09 (Fig. 3). The regression data have shown a good linear relationship over the concentration range of 100–600 ng/spot.
Validation Of HPTLC Method Precision
ICH guidelines were followed for the validation of the analytical method developed for precision, repeatability and accuracy. Instrumental precision, intra-day precision and interday precision of the method were determined. Instrumental precision was measured by replicate (n =6) applications of same oleanolic acid solution. Intra-day assay precision was evaluated by analysis of replicate (n = 6) applications of freshly prepared standard solution of same concentration (100,300 and 500 ng/spot), on the same day. Intermediate precision was evaluated by analysis of replicate (n =6) applications of standard solution of the same concentration (100, 300 and 500 ng/spot) on three different days. The repeatability of sample application and measurement of peak area have been expressed in terms of % CV.
Limit of detection and limit of quantification
Linearity was studied by applying different aliquots of standard stock solution in the ranges 100 to 600 ng/band for oleanolic acid. The calibration curves were developed by plotting peak area versus concentrations. The areas of peaks were treated by least square linear regression analysis. The limit of detection (LOD) and limit of quantification (LOQ) were determined using the following equations:
= 3.3 × ℎ −
ℎ
(1)
=10 × ℎ −
ℎ
Specificity
The specificity of the method was ascertained by analysing standard Oleanolic acid and extracts. The spot for Oleanolic acid in the sample was confirmed by comparing the Rf and spectra of the spot with that of sample. The peak purity of was assessed by comparing the spectra at three different levels, i.e., peak start, peak middle and peak end positions of the spot/ bands.
Robustness
The estimation was performed by varying the selected parameters (mobile phase composition, mobile phase volume and duration of mobile phase saturation) within certain limits (±10%) and there has been no notable alteration found in method performance and in results obtained. The results were indicated by the %RSD between the data at each variable condition.
acid standard (100 ng/spot) were added by spiking. The values of % recovery and average value of % recovery for oleanolic acid were calculated.
Method applicability System suitability
System suitability tests were performed to verify whether resolution and repeatability were adequate for the analysis. System suitability was determined by applying freshly prepared standard solution of Oleanolic acid, concentration 300 ng/spot, 6 times to the same chromatographic conditions then scanned and densitograms were recorded. The measured peak areas for oleanolic acid and their retention factor were noted for each concentration of oleanolic acid and values of the mean peak area, the standard deviation (SD) and the %CV were calculated.
Estimation of oleanolic acid in herbal extracts
To determine the content of Oleanolic acid in the herbal extract, 1 g of powder of bark is extracted with 50 ml of petroleum ether then concentrated, further extracted with hydroalcoholic mixture (70:30), concentrated and finally diluted with methanol. The resulting solution is centrifuged at 3000 rpm for 15 min and the supernatant is analyzed for oleanolic acid content. The filtered solution is applied on the TLC plate followed by development and scanning. The analysis is repeated for 3 times and the possibility of interference from other components of extract in the analysis is studied. The spot at Rf =0.53 corresponding to oleanolic acid was observed in the chromatogram of the extracts along with other components. (Fig. 2).
RESULTS AND DISCUSSION
TLC fingerprint and co-chromatography
Chromatographic fingerprint analysis has revealed to be a coherent and practicable approach for the quality assessment and species authentication of traditional medicine. It utilizes chromatographic techniques to construct specific patterns of identification for medicinal plants. The developed fingerprint pattern of components can then be used qualitative and quantitative analysis. Although high performance thin layer chromatography (HPTLC) has a few limitations, such as the limited developing distance and lower plate efficiency by comparison with HPLC and GC, it is still an effective tool for quality evaluation of medicinal plants due to its simplicity, low cost, and requirement, and it has been successfully utilized to develop the chromatographic fingerprint for medicinal plants. Moreover, the above mentioned shortcomings can be overcome by separately developing fractions of different polarity on two or several thin layer plates. Thus, the unique feature of the picture like image of HPTLC coupled with digital scanning profile is gradually attractive to herbal analysis to construct the herbal chromatographic fingerprint. This HPTLC could provide adequate information and parameters for comprehensive identification and differentiation of two closely related herbal medicines.
HPTLC fingerprint patterns have been evolved for extracts of M.longifolia. Oleanolic acid standard was quantitated accurately using silica gel F254 HPTLC pre-coated plates with mobile phase Toluene: acetic acid: formic acid (9:4:0.5) the Rf value was about 0.53. The chromatographs of Oleanolic acid (O1–O6) and hydroalcoholic extract of bark (B6) of M. longifolia are shown in Figs. 2. The Rf value of oleanolic acid matched with the Rf value of extract was about 0.53 shown in peak in Figs. 5. The previous study has reported the quantitative analysis of oleanolic acid Achyranthes aspera Lby the high performance thin layer chromatographic method [12]. A sensitive, selective and robust densitometric high-performance thin-layer chromatographic method was developed and validated for five
marker compounds, namely betulin, lupeol, oleanolic acid, 3-acetyloleanolic acid and β-sitosterol, known for their
various therapeutic activities [13].
TLC densitometric quantification of oleanolic acid using HPTLC
Figure 1: Chemical Structure of Oleanolic acid
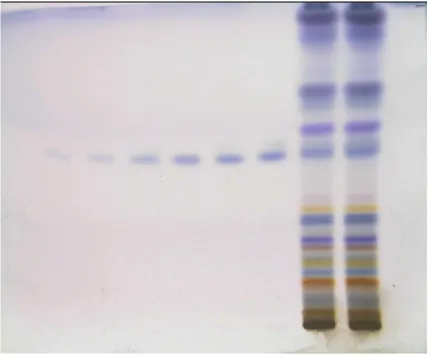
Figure 2 HPTLC chromatoplate of oleanolic acid and hydroalcoholic extract of powdered bark of Madhuca longifolia after derivatization under 366 nm. O1–O6concentration 100, 200, 300, 400, 500 and 600 ng/spot standard Oleanolic acid.M1=Hydroalcoholic
[image:5.595.92.523.265.621.2].
Figure 3 Calibration curve for standard Oleanolic acid (n= 6)
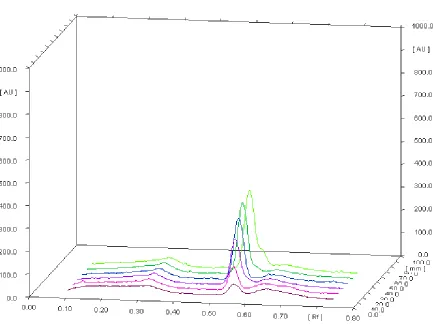
Figure 4 Densitometric chromatogram of oleanolic acid and hydroalcoholic extract of M.longifolia at 560 nm (3D View) 0
1000 2000 3000 4000 5000 6000 7000 8000 9000 10000
0 100 200 300 400 500 600 700
A
b
so
rb
an
e
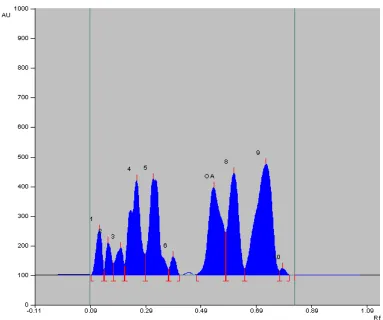
[image:6.595.92.525.370.694.2]Figure 5Densitometric chromatogram of hydroalcoholic extract of powdered bark of Madhuca longifolia afterderivatization at 560 nm
Table 1 Method performance parameters for quantification of oleanolic acid by proposed TLC densitometric method
Parameters Method (Oleanolic acid) Acceptance Criteria
Selectivity Selective
Specificity Specific No interference observed
Linear Range (ng/spot) 100-600 Linearity, accuracy and precision over the range
Correlation Coefficient 0.991 ± 0.412 Within 0.9-1.1
Linear regression equation Y= 16.898x-772.09
LOD (ng/spot) 9.302
LOQ (ng/spot) 28.79
Recovery (%) 95.84 Within 90-110%
Repeatability 0.619 % RSD ≤2
Intraday 1.16-2.30
Interday 0.46-1.16
Table 2 Intra and inter day precision of HPTLC method (n=6).
Concentration (ng/spot)
Inter-day Precision Intra-day Precision
Peak area
(mean ± SD) % RSD
Peak area
(mean ± SD) % RSD
100 1034.44 ± 11.99 1.15 0986.44 ± 22.67 2.29
300 4548.90 ± 23.05 0.50 4473.63 ± 40.53 0.90
500 7443.31 ± 33.94 0.45 7456.87 ± 86.16 1.16
Table 3 Recovery studies of oleanolic acid at 100%, 300%, and 500% addition by the proposed TLC densitometric method.
Concentration of standards (ng/spot) Area Spotted Total area
(Sample + Standard) Total area obtained % Recovery Sample amount Spiked amount Sample area Spiked Area
100 100 1051.8 967.2 2135 2019 94.56674
100 300 1051.8 5043.2 6291 6095 96.88444
[image:7.595.79.538.681.732.2]The method validation was carried out in accordance with the guidelines of ICH [11] by analyzing reference compounds and the analytes. The TLC densitometric method was validated in terms of precision, repeatability, and accuracy (Tables 1 and Table 2). The linearity range for oleanolic acid was 100–600 ng/spot with correlation coefficient, intercept and the slope 0.991 (sdv 0.41), 772.09 and 16.898, respectively (Y=16.898x- 772.09).
The percentage recovery was in the range of 94.56-96.88%. The measurement of the peak area at 3 different concentrations levels showed low values of %CV (<2%) for inter-day (0.46–1.16) and intra-day (1.16-2.30) variation for different concentrations of oleanolic acid which suggested an excellent precision and reproducibility of the method (Table 3). The limits of detection (LOD) and quantification (LOQ) were 9.302 and 28.39 ng, respectively which indicate the adequate sensitivity of the method (Table 1). Low %RSD value of 0.619% (between the peak area values) proved the ruggedness of the method indicating that oleanolic acid is stable during the extraction procedure as well as during analysis. The contents of oleanolic acid quantified using TLC densitometric methods were found to be 0.415 ± 0.005 w/w, barks of M. longifolia.
CONCLUSION
A rapid, simple, precise, accurate and specific HPTLC method for quantitative estimation of oleanolic acid present in the powdered bark of M. logifolia has been developed and validated. The data could be used as a quality control standard. The method used in this work resulted in good peak shape and enabled good resolution of oleanolic acid from other constituents of the plant materials. In summary, the proposed HPTLC method for the simultaneous analysis of oleanolic acid from bark reported here is very simple, sensitive, economic and suitable for rapid routine quality control analysis and quantification of oleanolic acid from bark of M. longifolia and in other herbal preparation and may be useful for standardization purposes.
REFERENCES
[1]Warrier PK; Nambiar VPK; Ramankutty C. Indian Medicinal Plants: A Compendium Of 500 Species. Chennai:
Orient longman Ltd, 1995.
[2]Khare CP. Indian Medicinal Plants: An Illustrated Dictionary. Springer Science, New York, 2007.
[3]Gaikwad RD; Ahmed LM; Khalid MS; Swamy P. Pharm Biol., 2009, 47(7), 592 97.
[4]Roy SP; Shirode D; Patel T; Prabhu K; Shetty SR; Rajendra SV. Ind J Nat Prod., 2008; 24(4):8.
[5]Chandra D. Ind J Pharmacol., 2001, 33, 108-111.
[6]Alvarez E; Rotelli AE; Pelzer LE; Saad JR; Giordano O. Farmaco, 2000, 55 (5), 502–505.
[7]Chiang L; Chiang W; Chang MY; Ng LT; Lin CC. Am J Chin Med, 2003; 31 (1), 37–46.
[8]Cunha WR; Martins C; da Silva Ferreira D; Crotti AE; Lopes NP; Albuquerque S. Planta Med, 2003; 69 (5):
470–472.
[9]Díaz AM; Abad MJ; Fernández L; Recuero C; Villaescusa L; Silván AM; Bermejo P. Biol Pharm Bull., 2000;
23 (11), 1307–1313.
[10]C. Farina; M. Pinza; G. Pifferi. Farmaco 1998, 53 (1), 22–32.
[11]I. C. H. Q2A (R1), Proceedings of the International Conference on Harmonization, Geneva November 2005.
[12]Mehta F; Patel B; Pandya S; Ahir K. JPC-Journal of Planar Chromatography-Modern TLC 2010, 23(4),
289-292.