The Effects of the Rope Jump Training Program in
Physical Education Lessons on Strength, Speed and
VO2 max in Children
Nebahat Eler, Hakan Acar*
School of Physical Education and Sport, Bulent Ecevit University, Zonguldak, Turkey
Copyright©2018 by authors, all rights reserved. Authors agree that this article remains permanently open access under the terms of the Creative Commons Attribution License 4.0 International License
Abstract
The aim of this study is to examine the effects of rope-jump training program in physical education lessons on strength, speed and VO2 max in10-12 year old boys. 240 male students; rope-jump group (n=120) and control group (n=120) participated in the study. Rope-Jump group continued 10 weeks of regular physical education and sport lessons and at the same time rope jump training program exercise 3 days a week, while the control group continued physical education and sports lessons only. Body weight, body fat percentage, leg strength, 20m speed test and VO2 max test measurements
were taken before and after the 10 week period in both groups. The obtained data were evaluated in the SPSS 16 program. In the statistical analysis, t test was used in dependent and independent groups.As a result of pre-test and post-test, significant differences were found in all parameters except speed of control group (p<0.05). When the measurement differences between pre-test and post-test were compared according to the groups, it was determined that weight, body fat ratio, 20m sprint, VO2
max and leg strength measurements were significantly different in favor of rope jump group (p<0.05). In 10-12 year old boys, rope-jump training program was the result of having a positive effect on strength, VO2 max and
especially speed. As a result, the inclusion of rope-jump programs in physical education and sports lesson curriculum, and in sports branch training programs may contribute to the development of children's motor skills and accelerate the development of the children.
Keywords
Rope Jump, Speed, Strength, VO2 max,Physical Education Lesson
1.Introduction
It is important to regularly play sports in the balanced
and healthy development of children. Regular sportive activities performed by children before and after puberty ensure that a healthy physical structure is developed in children; and in further years, it also delays the disruption of physical structure [1]. The period of sports-related movements in children has an important place in psychomotor development
This period concience with the school years of children in their general development years. This period is also the period in which a lot of skill-requiring movements are initiated and developed [2]. Motor development is at the highest level at the age of 8-11 when children are in primary school years, and at the age of 11-13 when they are at secondary school years [3]. Motor development plays an important place in the life of a child, and ensures that s/he participates in kinetic activities that contribute to physical and cognitive growth [4; 5]. It is known that physical education and sportive activities are important to cover the need for activity in children at school age because this need is more in children when compared with adults [6]. It was reported in previous studies that pushing, pulling, throwing, etc. strength properties are among the basic aims of physical education classes at primary schools [7]. It is important that the purpose of this development is to increase the contribution of the physical education course, and to diversify its programs and play contents.. One of the activities that children can enjoy and need to activity can be shown as rope-jump.
easily by children, a small place is needed, and it is cheaper when compared with other sports branches [10].
Rope-jump improves muscles in the arms and legs [11;12], cardiovascular functions and metabolism. It also has positive effects on cardio-circulation, muscle strength, endurance, speed, mobility and flexibility, balance, coordination, vertical jump, timing, rhythm and speed, lean body mass [13], bone density and skill development [14;15].
The strength, which is one of the important components of motor development, is seen as a prerequisite for effective movement [16]. Muscle strength is a primary component of physical fitness skills and increases in proportion to age from early childhood to adolescence in men [17]. There are studies that suggest that speed is related to strength and power of the athlete [18]. In addition, evaluating the effects of exercise in children and commenting on metabolic and cardiorespiratory profiles depends primarily on the measurement of VO2max and
cardiorespiratory profiles depend firstly on the maximal oxygen consumption (VO2max) measurement, and VO2
max is important in this respect [19]. For this reason, it would be advisable to assess rope-jump exercises in terms of strength, speed and VO2 max changes in order to
determine the contribution in the development of children. The aim of this study is to examine the effect of 10-week rope-jump exercise on strength, speed and VO2 max in
10-12 year old boys.
2. Materials and Methods
240 male students, 120 rope groups (age: 11,02 ± 0,84 year) and 120 control groups (age: 11.04± 0,66 years). participated in the study. The groups were assigned without a certain rule. Permissions were received from the families and the school administration for the study. The study group continued physical education and sports lessons regularly for 10 weeks, and in addition, they did rope-jump exercises 3 days a week (1); and the control group only continued Physical Education and Sports lessons.
In the first week, and in the first training, adaptation
exercises were used in the rope-jump group for the skipping tool (hands are rolled in circles, turning the rope with the left hand on the side, turning the rope with the right hand on the side, turning the rope with both hands in the front, turning the rope above the head with the left hand-helicopter, turning the rope above the head with the right hand, turning the rope with the left hand in the sides to form a shape of an ‘8’, turning the rope with the right hand in the sides to form a shape of an ‘8’, turning the rope with the left hand on the left side by jumping, turning the rope with the right hand on the right side by jumping, turning on the rope in the front by jumping) and rope-jump technique was taught “look front when skipping the rope, jump high as much as 3-5 cm to let the rope pass below your feet, this is not done with heels”.
For height measurements, a Charder hm-200 p brand measurement device was used. Body weight measurements were made with an Angel brand weighing device that was as sensitive as 20 grams and were recorded as kg. To determine the body fat rate, measurements were taken from the triceps and calf areas, and a skinfold caliper device was used. The 20-meter speed test measurements were made with New Test 2000 Photocell Device by placing electronic devices to the start and finish lines. When the subjects started to run, the time was started automatically, and when the subject passed the finish line, the timer was stopped. The time of the subjects spent to complete 30-m was measured in seconds (s) with a sensitivity of milliseconds. To determine the aerobic endurance of the subjects maximal oxygen consumption, the VO2 max running test was used. At the end of the test,
the tours that was completed by the participants were counted, and the VO2 value was found as ml.kg-1.min-1
in the evaluation table.
Statistical Analyses: The data were analyzed in the
3. Results
Table 1. Rope-Jump training program
Week Warm up Exercise Cool down
1 10 min. 35 rep. x1min. 30sn. rest (10 min. exercise) 5 min.
2 10 min. 35 rep. x1min. 30sn. rest (10 min. exercise) 5 min.
3 10 min. 40 rep. x1min. 30sn. rest (10 min. exercise) 5 min.
4 10 min. 40 rep. x1min. 30sn. rest (10 min. exercise) 5 min.
5 10 min. 45 rep. x1min. 30sn. rest (15 min. exercise) 5 min.
6 10 min. 45 rep. x1min. 30sn. rest (20 min. exercise) 5 min.
7 10 min. 50 rep. x1min. 30sn. rest (25 min. exercise) 5 min.
8 10 min. 55 rep. x1min. 30sn. rest (30 min. exercise) 5 min.
9 10 min. 60 rep. x1min. 30sn. rest (35 min. exercise) 5 min.
10 10 min. 60 rep. x1min. 30sn. rest (35 min. exercise) 5 min.
Table 2. The comparison of pre-test and post-test data of the control group
N Ave. Std. Dev. t p
Height (cm) pre-test 120 139,61 9,66 -18,152 0,000*
post-test 120 140,41 9,73
Weight (kg) pre-test 120 36,07 9,46 -35,435 0,000*
post-test 120 37,92 9,36
Body fat rate (%) pre-test 120 26,38 7,38 -4,498 0,000*
post-test 120 26,84 7,21
20 m speed (sec) pre-test 120 4,35 0,54 0,239 0,812
post-test 120 4,34 0,53
VO2 max(ml.kg/dk)
pre-test 120 31 1,27
-4,723 0,000*
post-test 120 31,3 1,25
Leg strength (kg) pre-test 120 42,48 9,07 -18,742 0,000*
post-test 120 43,68 9,02
When pre and post measurement results were compared, it was determined that there were statistically significant differences between the height, weight, body fat rate, VO2 max and leg strength average values (p<0.05).
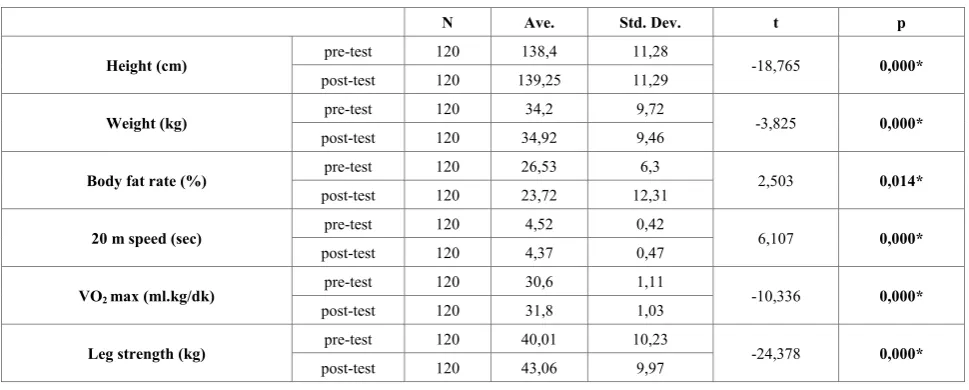
Table 3. Comparison of Pre-test and Post-test Data of the Rope-Jump Group
N Ave. Std. Dev. t p
Height (cm) pre-test 120 138,4 11,28 -18,765 0,000*
post-test 120 139,25 11,29
Weight (kg) pre-test 120 34,2 9,72 -3,825 0,000*
post-test 120 34,92 9,46
Body fat rate (%) pre-test 120 26,53 6,3 2,503 0,014*
post-test 120 23,72 12,31
20 m speed (sec) pre-test 120 4,52 0,42 6,107 0,000*
post-test 120 4,37 0,47
VO2 max(ml.kg/dk)
pre-test 120 30,6 1,11
-10,336 0,000*
post-test 120 31,8 1,03
Leg strength (kg) pre-test 120 40,01 10,23 -24,378 0,000*
post-test 120 43,06 9,97
p<0.05
[image:3.595.57.541.108.493.2] [image:3.595.56.541.536.731.2]statistically significant differences was found (p<0.05). It is determined that while the body fat rate and 20-m speed average values decreased at a significant level, the average values in other measurements increased at a significant level.
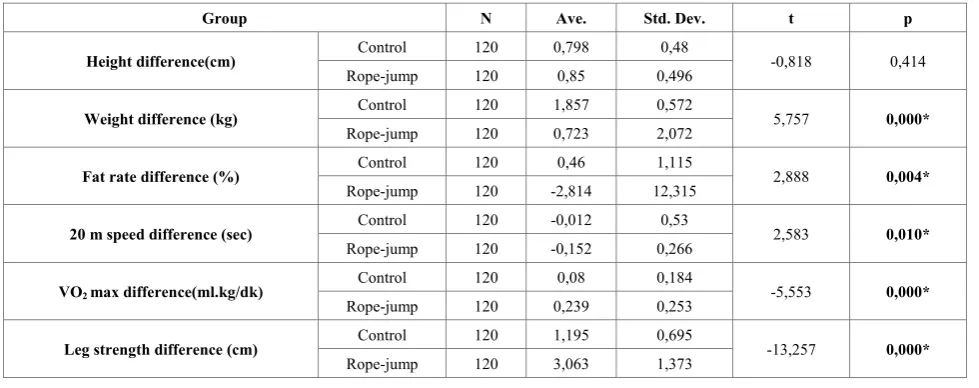
Table 4. Comparison of Measurement Differences according to the Groups
Group N Ave. Std. Dev. t p
Height difference(cm) Control 120 0,798 0,48 -0,818 0,414
Rope-jump 120 0,85 0,496
Weight difference (kg) Control 120 1,857 0,572 5,757 0,000*
Rope-jump 120 0,723 2,072
Fat rate difference (%) Control 120 0,46 1,115 2,888 0,004*
Rope-jump 120 -2,814 12,315
20 m speed difference (sec) Control 120 -0,012 0,53 2,583 0,010*
Rope-jump 120 -0,152 0,266
VO2 maxdifference(ml.kg/dk)
Control 120 0,08 0,184
-5,553 0,000*
Rope-jump 120 0,239 0,253
Leg strength difference (cm) Control 120 1,195 0,695 -13,257 0,000*
Rope-jump 120 3,063 1,373
p<0.05
There was found statistically significant differences between the two groups, weight, body fat rate, 20-m speed, VO2 max and leg strength.
4. Discussion
In this study, the effects of rope-jump training program on speed and VO2 max in 10-12 year old boys were
investigated. As a result of the 10-week Rope-Jump training, it was determined that there were statistically significant differences between the first and second measurements of the rope-jump group and control group aside from the speed values (p<0.05). When the measurement differences were compared between the two groups, it was determined that there were significant differences in the parameters except for the height length in favor of the rope jump group (p<0.05).
In this study, the body fat ratio significantly decreased in the rope-jump group, which was significantly increased in the control group. Hatfield et al. (1985) conducted a study and examined the effects of 8-week rope-jump training in 9-11 years old children on body fat percentage and maximal oxygen intake. They determined that there were no significant differences in the body fat percentage values [20]. Orhan (2008) conducted a study on young volleyball players to investigate the effects of rope-jump and weighted-rope-jump trainings on body fat rate, fat percentage and circumference measurements, and determined that there were significant decreases in the fat rates in the chest, biceps and triceps areas and elbow, chest, hip, and knee as a result of rope-jump training [21]. Kim et al. (2007) investigated the effects of 12-week Rope-Jump exercises in obese adolescent males on body composition, and plasma levels; and found that Rope-Jump decreased
the body fat percentage values at a significant level after rope-jump trainings [22].
As a result of the study, 20-m speed values were significantly lower in the rope-jump group than in the control group (p<0.05). Turgut et al. (2016) conducted a study on adolescent volleyball players, and determined that there were significant increases in the anaerobic strength and speed values of the study group when compared with the control group after a 12-week rope and weighted-rope trainings [23]. Endo et al. (2007) reported that when the rope-jump was used in an efficient way in the growth attack period between 9 and 13 age group, the sprint performance values increased [24]. Partavi (2013) determined that the agility values of the male children (6th
Grade) increased at a significant level (3,17%) after s rope-jump training for 7 weeks [25]. The results of this study are similar to ours. According to these results, it can be said that the rope-jump trainings have improved speed in a positive direction.
In our study, it was also determined that the VO2 max
level [15].
Düzgün et al. (2010) conducted a study on adolescent volleyball players, and reported that weighted-rope-jump training programs increased the shoulder (scapula) outer rotation strength levels [27]. Turgut et al. (2016) conducted a study on adolescent volleyball players and reported that Rope-Jump trainings provided advantage in strength and agility [23]. As a result of 12-week rope and weighted-rope trainings, significant increases were determined in the anaerobic strength and speed values in the weighted-rope-jump group when compared with the control group.
In this study, it was determined that the leg strength in the rope-jump group increased at a significant level when compared with the control group (p<0.05). Masterson and Brown (1993) separated the subjects into 3 groups (weighten rope-jump group, core plyometric exercise group and stretcing exercise group) and examined the changes in the power and anaerobic capacity of the subjects. After 10 weeks, there was a significant improvement between the bench-press, leg push and jump values before and after the training in the rope group and in the other two groups the values before and after the training were not significant [28]. According to these results, it is possible to claim that rope-jump training increases leg strength.
5. Conclusions
As a result, positive effects were determined on weight, fat ratio, speed, leg strength and VO2 max after 10 - week
rope training program. It can be said that the rope-jump training program accelerated and increased the development of these parametres of the children at this age. For this reason, the inclusion of rope programs in physical education and sports curriculum is important to contribute the motor skills. Especially the fact that there is a rapid development of this age group reveals the importance of this program. In addition, placing a rope-jump exercise in all sports branches can accelerate the development of the players, as well as contribute to the variety of training.
REFERENCES
[1] Gündüz N. Antrenman Bilgisi. İzmir: Saray Tıp Kitabevleri;
1997.
[2] Muratlı S. Antrenman Bilimi Yaklaşımıyla Çocuk Ve Spor.
Ankara: Nobel Yayın Dağıtım; 2007.
[3] Dündar U. Antrenman Teorisi. Ankara: Bağırgan Yayımevi;
1998.
[4] Barton, G.V.; Fordyce, K. & Kırby, K. (1999). The İmportance of the Development of Motor Skills to Children. Teaching Elementary Physical Education, 10(4): 9-11.
[5] Goudas, M. & Gıannoudıs, G. (2008). A Team-Sport-Based Life-Skills Program İn Physical Education Context.
Learning and Instruction, 18: 528-536.
[6] Kızılakşam E. (2006). Edirne İl Merkez İlköğretim Okullarındaki 12–14 Yaş Grubu Aktif Olarak Spor Yapan
Ve Yapmayan (Beden Eğitimi Dersine Giren) Öğrencilerin Eurofit Test Bataryaları Uygulama Sonuçlarının Karşılaştırılması. Yüksek Lisans Tezi. Trakya Üniversitesi Sağlık Bilimleri Enstitüsü Beden Eğitimi ve Spor Anabilimdalı.
[7] Harmandar İh. Beden Eğitimi Ve Sporda Özel Öğretim Yöntemleri. Ankara: Nobel Basımevi; 2004.
[8] Brancazio Pj. Sport Science: Physical Laws and Optimum Performance. Newyork: Simon and Schuster; 1984. [9] Aagaard M. (2012). Rope Jumping Fitness: The Complete
Guide to Jump Rope Fitness. Kobehavn: Denmark. Brown, L.E. & Ferrigno, V.A. (2005). Training For Speed, Agility and Quickness. (Pp. 80-81). Human Kinetics.
[10]Hill G and Hannon JC (2008). An Analysis of Middle School Students Physical Education Physical Activity Preferences. The Physical Educator, 180-190.
[11]Chen CC, Lin SY (2011). The İmpact Of Rope Jumping Exercise On Physical Fitness Of Visually İmpaired
Students, Res Dev Disabil, 32: 25–29.
[12]Trecroci A, Cavaggioni L, Caccia R, Alberti G (2015). Jump Rope Training: Balance And Motor Coordination İn
Preadolescent Soccer Players, Journal Of Sports Science & Medicine,; 14(4):792-798.
[13]Cooper K. (2006). Benefits Of Rope Jumping, Http://Www.Jumpropeinstitute.Com/(17.04.2006).
[14]Cahperd (Canadian Association For Health, Physical Education, Recreation And Dance), Rope Skipping Fitness And Activity Program,
Http://Www.Cahperd.Ca./(17.04.2005).
[15]Chao-Chien, C., & Yi-Chun, L. (2012). Jumping Rope Intervention on Health-Related Physical Fitness İn Students
with Intellectual Impairment. The Journal of Human Resource and Adult Learning, 8(1), 56-62.
[16]Pienaar, A.E. (2012). Motoriese Ontwikkeling, Groei,
Motoriese Agterstande, Die Ssessering En İntervensie Daarvan: ʼn Handleiding Vir Nagraadse Studente İn
Kinderkinetika [Trans.: Motor Development, Growth, Motor Deficiencies, The Assessment and İntervention Thereof: Manual For Postgraduate Students İn
Kinderkinetics]. Potchefstroom, Rsa: Xerox Noordwes Universiteit.
[17]Muratlı S. Çocuk Ve Spor. Ankara. 2. Baskı. Bağırgan Yayımevi, 2013.
[18]Polman R., Walsh D., Bloomfield J., Nesti M. (2004). Effective Conditioning of Female Soccer Players. Journal of Sports Sciences, 22: 191-203.
[19]Fawkner S.G. And Armstrong N. (2003). Oxygen Uptake Kinetic Response to Exercise İn Children. Sports Med,
33(9): 651-669.
Eight-Week Precision Jump-Rope Program. Perceptual Motor Skills 61, 1275-1279.
[21]Orhan S (2008). Basketbolcularda İp Ve Ağırlık İpi Çalışmalarının Vücut Yağ Oranı, Yağ Yüzdesi Ve Çevre Ölçümlerine Etkisi. E-Journal of New World Sciences Academy, 3(2): 43-51.
[22]Kim, E.S., Jee-Aee I.M., Kim K.C., Park J.H., Suh S-H.,
Kang E.S., Kim S.H., Et Al. (2007). Improved İnsülin
Sensitivity and Adiponectin Level after Exercise Training
İn Obese Korean Youth. Obesity, 15, 3023-3030.
[23]Turgut E., Çolakoğlu F.F., Atalay Güzel N., Karacan S., Baltacı G (2016). Effects Of Weighted Versus Standard Jump Rope Training On Physical Fitness İn Adolescent
Female Volleyball Players: A Randomized Controlled Trial, Turk J Physiother Rehabil, 27(3):108-115.
[24]Endo, T, Tauchi, K, Kigoshi, K, and Ogata, M. (2007) A
Cross-Sectional Study On Age-Related Development Of Rebound And Counter Movement Jumping Ability. Jpn Soc Phys Educ 52: 149–159.
[25]Partavi S (2013) Effects of 7 Weeks of Rope-Jump Traınıng On Cardıovascular Endurance, Speed, and Agılıty In Mıddle School Student Boys. Sport Science 6(2): 40‐43. [26]Baker JA. Comparison Of Rope Skipping And Jogging As
Methods Of İmproving Cardiovascular Efficiency Of College Men,Res Q Exercise Sport, 39(2):240-243.
[27]Düzgün İ, Baltacı G, Çolakoğlu F, Tunay VB, and Özer D.
(1968) The Effects Of Jump-Rope Training On Shoulder
Isokinetic Strength İn Adolescent Volleyball Players.
Journal of Sport Rehabilitation, 2010, 19, 184-199.