Journal of Chemical and Pharmaceutical Research, 2017, 9(5):175-181
Research Article
CODEN(USA) : JCPRC5
ISSN : 0975-7384
175
Optimization and Validation of A High Performance Liquid
Chromatography Method for the Determination of Nevirapine in Plasma
Shapaya T Masai
1*, Okalebo F Apolot
1,
Oluka M Ngʹwono
1, Kamanu TK Kuria
2,
Chepkwony Hezekiah K
3and Mwaura Nicholas N
31Department of Pharmacology and Pharmacognosy, School of Pharmacy, University of Nairobi, Kenya 2
Department of Statistics and Operations Research, School of Mathematics, University of Nairobi, Kenya
3National Quality Control Laboratory, Kenya
_____________________________________________________________________________
ABSTRACT
Existing methods for bioanalysis of nevirapine can be improved. In this study, a high performance liquid chromatographic method for determination of nevirapine in plasma was optimized and validated. Sample preparation was done by protein precipitation using acetonitrile. The stationary phase was reverse phase C18 column (HyperClone® BDS 150 mm × 4.6 mm, 5 µm) set at 40oC. The injection volume was 30 µL. Step-gradient elution was conducted at a flow rate of 1.2 mL/minute and a run time of 11 minutes using a binary mixture of potassium dihydrogen orthophosphate (20 mM, pH 4.5) and acetonitrile. The ultraviolet detection wavelength was 270 nm. The internal standard was carbamazepine. Two calibration curves were modelled and were linear through the ranges of 0.5-2.5 µg/mL (R2=0.9978) and 2.5-25 µg/mL (R2=0.9992). The lowest limit of quantification was 0.5 µg/mL with 92% mean percentage recovery of nevirapine. The intra- and inter-day precision was 5 and 7% (coefficient of variation) respectively. The accuracy was acceptable with the relative deviation from the nominal concentrations of less than 7%. There was no interference by endogenous substances or by drugs used in HIV/AIDS patients. Nevirapine samples were stable with less than 9% loss on storage. The method met the FDA specifications. The method is simple with a short sample work up and is suitable for day to day quantification of nevirapine and in pharmacokinetics studies in resource limited settings.
Keywords: Nevirapine; High performance liquid chromatography; Validation; Plasma
_____________________________________________________________________________
INTRODUCTION
Nevirapine is a lipophilic dipyridodiazepinone compound used in the management of the most widespread subtype of the human immunodeficiency virus (HIV-1) [1]. Nevirapine is among the first line antiretroviral agents for treatment of HIV as well as prevention of mother-to-child transmission in resource-limited setting [2]. Nevirapine is a non-nucleoside reverse transcriptase inhibitor (NNRTI) that non-competitively binds and inhibits the HIV reverse transcriptase enzyme that is necessary for the replication of the virus [1].
Levels of nevirapine in plasma may indicate the degree of viral suppression in patients under antiretroviral therapy (ART) and high concentrations have been associated with greater viral inhibition and better therapeutic outcomes [3]. Steady-state plasma nevirapine levels may therefore be used to monitor adherence to the nevirapine-based ART treatment, associated pharmacokinetics, and bioequivalence studies[3].
176
Plasma nevirapine levels are quantified using chromatographic methods that differ in selectivity, sensitivity and cost [5-13]. The quantification methods include liquid chromatography with tandem mass spectrophotometric detection (LC-MS) [5], gas chromatography with mass spectrophotometric detection (GC-MS) [6], high performance liquid chromatography utilizing ultraviolet detection (HPLC-UV) [7,8] and HPLC utilizing diode array detection [9]. Typical HPLC-UV methods have other limitations that include low sensitivity, tedious sample preparation, a narrow analytical range, long run-times, and complex mobile phases [10].
This study sought to improve the sensitivity, run-time and analytical range of a HPLC-UV method for quantifying nevirapine. Our method improves a pre-existing bioanalytical method [8]. When the method developed by Kumar et al. was used in our laboratory, we noted co-elution with compounds in plasma and cotrimoxazole which is widely used by HIV patients. Hence we modified this method to improve separation. The optimized method was validated to ensure compliance to Food and Drug Administration (FDA) guidelines [4]. Our method offers a simple mobile phase as well as less tedious requirements for sample preparation. It offers a short run-time and has wide analytical range. This improvements are invaluable in pharmacokinetic and bioequivalence studies [7].
EXPERIMENTAL SECTION
Instrumentation
A Merck Hitachi LaChrom HPLC system (Hitachi Ltd, Tokyo, Japan) was used for quantification of nevirapine in plasma. The HPLC system comprised of a L-7100 quaternary low pressure gradient pump, a L-7400 variable wavelength UV/Vis detector, a L-7200 variable injection volume autosampler, and a L-7350 thermostatic column oven. The components were interfaced using a D-7000 software module. Control of the instrument and data processing were performed on an IBM compatible Windows-based desktop computer running a HPLC System Manager (HSM) software (version 4.1; Merck KGaA, Darmstadt, Germany and Hitachi Instruments Inc., San Jose, USA). An Arium 61316 Water System (Sartorius AG Göttingen, Germany) was used to purify water by sequential reverse osmosis and ultra-filtration.
A SN 70918146 Denley Vibromix (Thermo Electron Corporation, UK) vortex mixer and a D-37520 Osterode Biofuge pico (Heraeus Instruments, Germany) centrifuge were used for sample preparation. We used a AUW220D Shimadzu analytical balance (Shimadzu Corporation, Japan) to weigh the working chemical reference standards and salts for preparation of buffers.
Chemicals
Reference standards of nevirapine, zidovudine, lamivudine, stavudine, tenofovir, trimethoprim, sulphamethoxazole, and the internal standard (IS) carbamazepine were obtained from the National Quality Control Laboratory (NQCL-Kenya) and Universal Corporation Limited (Kenya). The buffers were prepared using analytical grade potassium dihydrogen orthophosphate (KH2PO4) and dipotassium hydrogen phosphate
(K2HPO4) (Merck Chemicals Pty Ltd., Gauteng, South Africa). Preparation of the mobile phase and
solubilization of organic compounds was done using HPLC grade methanol and acetonitrile (Rankem, Avantor Performance Materials Ltd, India). Human plasma was donated by the National Blood Transfusion Services (NBTS).
Preparation of Standard and Buffer Solutions Calibration standard solutions:
A stock solution of 1 mg/mL nevirapine was prepared in methanol and water (50:50% v/v). The stock solution of nevirapine was diluted to prepare the working calibration standards of different concentrations for spiking plasma samples. The working standards were diluted ten-fold to obtain spiked plasma samples with the following concentrations: 0.5, 0.75. 1.0, 2.5, 5.0, 7.5, 10.0, 15.0, 20.0 and 25.0 µg/mL.
Internal standard (IS) solutions:
Carbamazepine was used as the IS owing to its structural and physicochemical similarity to nevirapine [11]. A stock solution of 1 mg/mL carbamazepine was prepared in a methanol and water (50:50% v/v). The stock solution of carbamazepine was then used to prepare a working solution of 5 µg/mL in acetonitrile. A fixed volume (800 µL) of 5 µg/mL carbamazepine was added to all analytic samples. Changes in the chromatography peak of the IS were used to assess variation in sample preparation and treatment [12].
Quality control standard solutions:
177
latter two were termed middle QC (MQC) and high QC (HQC) standards because they corresponded to the middle and high end of the calibration curve, respectively [4].
Buffer solutions:
The buffer solutions were prepared using KH2PO4 and K2HPO4 to obtain 0.015 and 0.02 M of each. The pH of
the buffers were 4.5, 6.8 and 8.4.
Sample Work-up by Protein Precipitation
Plasma was extracted from blood by centrifugation at 5000 g for five minutes and stored at -20°C. Proteins were precipitated by adding 800 µL acetonitrile (containing 5 µg/mL carbamazepine) to 400 µL of thawed plasma with subsequent vortexing for about 20 seconds. The resultant mixture was then stored at -20°C for 10 minutes to enhance precipitation. The supernatant was then withdrawn for analysis after centrifugation at 10000 g for six minutes.
Chromatographic Conditions
We noted poor separation and co-elution of nevirapine with compounds in plasma based on the initial chromatographic conditions reported in Kumar et al. [8]. These authors used an isocratic mobile phase consisting of: a phosphate buffer (PB) - 0.015 M KH2PO4 (pH=5.0) and acetonitrile (45:55% v/v) at a flow rate
of 1 mL/min; a reversed phase octadecylsilane (C18) column measuring 150 mm in length, 4.6 mm internal diameter, 5 µm particle size and 110 Å pore size; a ultraviolet (UV) detection wavelength of 270 nm; and the sample injection volume of 20 µL.
We varied the chromatographic conditions to enhance separation by HPLC with UV detection. The optimal
separation was achieved using reverse phase HyperClone® BDS C18 (150 mm × 4.6 mm) (Phenomenex,
Torrance, California, USA) column with 5 µm particle size and 110 Å pore size. The column was maintained at
40°C. The sample injection volume was 30 µL. Separation was achieved by step-gradient elution with a binary
mixture of KH2PO4 buffer (pH 4.5 ± 0.05, 0.02 M) (A) and acetonitrile (B) with a run time of 11 minutes. The
first step entailed isocractic elution using A: B 85:15% (v/v) for the first 3.5 minutes. In the second step, the mobile phase was changed linearly over a period of one minute to A: B 67:33% (v/v). Isocratic elution with this mixture was maintained for 4.5 minutes (4.5 to 9.0 minutes of the run). The second last step was a linear change of the mobile phase to the original composition of A: B 85:15% (v/v) for 0.2 minutes. The final step was isocratic elution for 2.8 minutes with the original composition to allow for re equilibration and complete the run time of 11 minutes. Automated cleaning of the column between 10 runs was done with water and acetonitrile (50% v/v) for 5 minutes. Ultraviolet (UV) detection was done at a wavelength of 270 nm.
Validation
The FDA (2001) guidelines were adopted to validate the optimized HPLC-UV method [4].
Linearity of the calibration curve:
Six replicates of calibration standards were used to obtain the calibration curves. LQC and HQC were also run in each analysis of the calibration standards. The calibration curves were obtained by plotting the nominal concentration of nevirapine calibration standard solutions against the chromatogram peak area ratios of nevirapine and carbamazepine. The relative deviation from the nominal concentration and coefficient of variation were calculated and used to evaluate the calibration curves. Acceptable curves, as per the FDA guidelines, have 75% of the back-calculated concentrations within ± 15% of the nominal value except at LLOQ where an upper limit of 20% is deemed satisfactory. Residuals from regression were used for model diagnostics to check for homoscedasticity and the typical requirement is that they are zero-mean normally distributed random variables.
Accuracy and precision:
Six replicates of the QC standards (LQC, MQC and HQC) were analyzed on the same day using the optimized HPLC-UV method to determine accuracy and intra-day precision. Additional analysis was done for two more days to determine inter-day precision. The mean and variance of the replicate determinations of the QC standards were calculated. Accuracy was calculated as the percentage relative deviation (RD) of the back-calculated concentrations from the nominal levels of the QC standards. Precision was calculated as the coefficient of variation [4]. Intra- and inter-day precision was determined using univariate analysis of variance (ANOVA). Accuracy and precision are acceptable if they are below 15% as per the FDA guidelines [4].
Sensitivity:
178
concentration where the peak of the analyte was distinguishable from that of the blank matrix and the signal to noise ratio of above three was considered the limit of detection (LOD).
Selectivity:
Selectivity quantifies the ability of the HPLC-UV method to distinguish the test analyte (nevirapine) and internal standard (carbamazepine) from endogenous or exogenous substances found in plasma [4]. Interference by endogenous substances was evaluated by comparing chromatograms of six paired samples. Each paired sample comprised blank pooled plasma and spiked plasma at known concentration of nevirapine at LLOQ. Exogenous interferences from say co-administered drugs were determined from the peak areas at the retention time of nevirapine and carbamazepine after spiking plasma with 10 µg/mL of drugs that are widely used by HIV patients. Selectivity was calculated as a ratio of the peak areas in the presence of the interference relative to that of nevirapine and carbamazepine at LLOQ. The selectivity is acceptable if interference is less than 20%.
Recovery and carryover effect:
Recovery measures the efficiency of extraction of the analyte from the matrix of the QC samples at LLOQ, LQC, MQC and HQC concentrations [4]. The ratios of peak areas of the analyte and internal standard of extracted spiked plasma samples relative to the unextracted QC samples were compared to determine recovery; six paired samples were considered. Unextracted QC samples were prepared by adding the working QC standards to water and methanol (50:50%) rather than plasma. Recovery greater than 70% was considered acceptable.
Carryover effect measures the amount of analyte retained in different components of the chromatographic system after each experimental run that is transferred and is detectable in the subsequent run [4]. Three replicates of HQC were run alternating with a blank plasma sample and the chromatographs were compared to those of six replicates of the LLOQ samples. Carryover effect was then calculated as the percentage of the peak area at the retention time of the analyte compared to the mean peak area at LLOQ. The carryover was acceptable if the response of the blank sample was ≤ 20% that of the analyte at LLOQ and ≤ 2% of area at the retention time of internal standard. If the response was ≥ 20% that of the analyte at LLOQ, then the carryover was not to be greater than 1% of HQC.
Short, long term and freeze-thaw stability testing:
QC standard samples were aliquoted and analyzed before stability testing. Bench top/short term stability was determined by preparing three aliquots of the LQC, MQC and HQC standard samples. These were frozen at -20oC for 24 hours then thawed and left at room temperature for 4-24 hours followed by analysis.
Freeze- thaw stability was determined using three aliquots of the LQC, MQC and HQC standard samples that were frozen and thawed for three cycles. Each cycle consisted of freezing for 24 hours then storage at room temperature until thawing had taken place, then refreezing for 12-24 hours. The concentrations were then determined after the three cycles.
Long term stability was determined by preparing two aliquots of LQC and HQC standard samples. The first aliquots were analyzed after two months and the last was analyzed after five months. The percentage change in the concentration of nevirapine in the QC standard samples during the stability test was evaluated.
Data analysis:
Data was analyzed using Microsoft® Office Excel 2013 and Stata Version 10.1 (College Station, Texas, USA).
The ratio of peak areas of the analyte and internal standard were used except where absolute peak areas were specified. Calibration curves were determined by plotting the ratio of peak areas of nevirapine and carbamazepine against the nominal concentration of nevirapine. Interpolation was used to estimate the concentration in between data-points. Simple linear regression was used to generate the equation for the calibration curve. A coefficient of determination (R2) greater than 0.99 was considered acceptable. Univariate ANOVA was used to determine the coefficient of variation for intra- and inter-day precision.
RESULTS
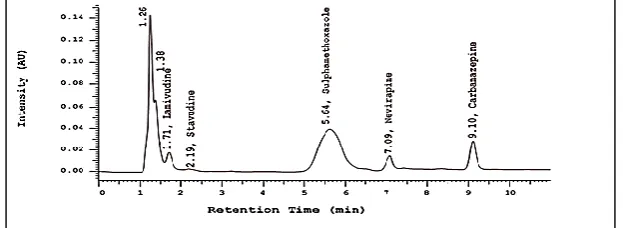
Figure 1 shows a chromatogram of the separation achieved using the optimized chromatographic conditions over a run time of 11 minutes. The retention times of carbamazepine and nevirapine were 7.11 ± 0.03 and 9.11 ± 0.03 minutes, respectively.
Calibration Curve and Linearity
The data satisfied the linear regression equation y= 0.1014 × – 0.1399 (R2 =0.999) for concentrations above 2.5
µg/mL (Table 1). The model y=0.0406 × – 0.0109 (R2 =0.998) was found to be best for lower concentrations of
179
[image:5.595.143.458.96.201.2]approximate normality with standard deviations of 2.5% and 7.7% for the high and low concentration calibration curves, respectively.
Figure 1: Typical chromatogram of nevirapine and carbamazepine (10.0 and 5.0 µg/mL respectively) in plasma sample separated using the optimized chromatographic conditions
Table 1: Relative deviation from nominal concentrations at low plasma nevirapine levels using low and high concentrations calibration curves
Nominal Conc (µg/mL) Regression model A Regression model B Calculated Conc (µg/mL) RD (%) Calculated Conc (µg/mL) RD (%)
0.507 0.539 6.3 1.487 193.4
0.76 0.731 -3.9 1.564 105.5
1.014 0.987 -2.6 1.666 64.4
1.52 1.502 -1.2 1.872 23.1
2.027 1.95 -3.8 2.051 1.2
2.534 2.543 0.4 2.288 -9.7
5.068 9.633 90.1 5.124 1.1
Conc: Concentration; RD: Relative deviation; Regression model A: Determined levels using low concentration curve (RD) (0.5-2.5 µg/mL); Regression model B: Determined levels using high concentration curve (RD) (2.5-25 µg/mL)
Accuracy and precision
The accuracy and precision of the HPLC-UV method are summarized in Table 2. Accuracy ranged from -2.1 to 4.9% relative deviation from nominal concentrations. The mean intra-day precision was 4.7 ± 1.2% while the mean inter-day precision was 7.2 ± 4.4% and were both within the acceptable limit
s.
Table 2: Accuracy and precision of the HPLC-UV method for determination of nevirapine in plasma
Label (n=6)
Nominal Concentration (µg/ml)
Mean observed (µg/ml)
Relative deviation (% RD)
Intra-day precision (% CV)
Inter-day precision (% CV)
LLOQ 0.507 0.59 16.4 5.3 6.6
LQC 1.52 1.595 4.9 4.3 4.6
MQC 12.669 13.184 4.1 3.8 4.7
HQC 22.804 22.315 -2.1 6 12.2
RD: Relative deviation; CV: Coefficient of variation
Sensitivity and Selectivity
[image:5.595.142.457.563.685.2]The LOD was 0.25 µg/mL while the LLOQ was 0.5 µg/mL. There was no interference by endogenous substances found in plasma at the retention time of nevirapine and carbamazepine as illustrated in Figure 2 (A chromatogram of blank pooled plasma).
Figure 2: Typical chromatogram of blank pooled plasma
180
Table 3: Selectivity for nevirapine in a matrix of plasma spiked with some drugs commonly used by HIV patients of the HPLC-UV method
Drug Relative retention time Drug Relative retention time
Nevirapine 0.78 Trimethoprim 0.41
Lamivudine 0.18 Sulphamethoxazole 0.57
Stavudine 0.23 Carbamazepine 1
Zidovudine 0.29 Tenofovir 1.07
Recovery, Carryover and Stability of Nevirapine
The mean recovery of nevirapine from the plasma matrix ranged from 89.2 to 96.6% which was above the predefined set limit of 70%. Carryover effect was not detected (0%). Table 4 summarizes the results for benchtop, freeze-thaw and long term stability tests. Nevirapine was stable with minimum loss under different environmental conditions. The mean loss in concentration in the bench top and freeze-thaw stability tests was 5.8 ± 5.0% and 8.8 ± 4.0%, respectively. Nevirapine (in plasma) was stable after five months when stored at -20°C with a mean loss in concentration of 5.9 ± 0.8%.
Table 4: Change in concentration during stability testing of nevirapine
Stability (n=6) Label Spiked plasma
(µg/ml) Comparison sample (µg/ml)
Stability sample (µg/ml)
Percent change (%)
Bench top
HQC 22.804 24.184 23.936 1
MQC 12.669 14.709 13.673 5.4
LQC 1.52 1.709 1.521 11
Freeze-thaw
HQC 22.804 21.628 19.629 9.2
MQC 12.669 13.167 11.503 12.6
LQC 1.52 1.433 1.367 4.6
Long term HQC 22.804 24.184 22.901 5.3
LQC 1.52 1.71 1.599 6.5
LQC: Low quality control standard; MQC: Middle quality control standard; HQC: High quality control standard
Application of the Method for Analysis of Patient Samples
Blood samples, collected from three patients who had been on nevirapine based antiretroviral therapy for more than six months, were extracted and analyzed using the HPLC method. The chromatograms were similar to that of spiked plasma samples as shown in Figure 3.
Figure 3: Typical chromatogram of plasma samples of patients on nevirapine
DISCUSSION
In this study we optimized a HPLC-UV method for the determination of nevirapine in plasma for use in resource limited settings. The proposed method was validated using parameters in the FDA, 2001 guidelines. The HPLC-UV method showed improved separation and resolution of nevirapine and carbamazepine. We noted difficulty in resolving the sulphamethoxazole and nevirapine peaks but gradient elution enabled seperation of the two drugs. Our method had a short run time of 11 minutes compared to other HPLC-UV methods [13]. Short run times may allow analysis of large numbers of plasma samples. The method proposed here may therefore be more useful in routine monitoring of large patients pools especially where both viral load evaluation and levels of nevirapine are of interest. Other HPLC-UV methods with similar short run times often require laborious, tedious and lengthy sample preparation protocols such as liquid-liquid extraction where the sample has to be evaporated and re-dissolved in suitable solvents [7,14]. Our HPLC-UV method requires simple protein precipitation using acetonitrile and is therefore easy to perform [9]. As a consequence, the method can be adopted in resource-limited settings because the required materials and reagents are often available [14].
181
CONCLUSION
The analytic range (0.5 to 25 µg/mL) considered here is wider than that provided for by comparable HPLC-UV methods, some of which require pre-dilution of the sample before analysis [7,9,14]. The wider analytical range of concentrations avails our method for use in populations with high variability of plasma nevirapine levels. High variability of plasma nevirapine levels has been noted in patient populations due to factors such as gender, adherence, and or even in suspected overdose [16]. Our method can thus be used in therapeutic drug monitoring of nevirapine in patients with poor compliance or poor metabolism because it has a wide analytical range. Our method can be further evaluated for analysis of other drugs such as zidovudine, trimethoprim, sulphamethoxazole and tenofovir and used in determination of their levels in plasma during therapeutic drug monitoring.
ACKNOWLEDGEMENTS
The authors appreciate the National Quality Control Laboratory that donated reagents and supported the analysis at the facility. We thank Daniel Siminyu Juma and William Njihia Ngugi for technical support and assistance. We also thank the University of Nairobi African Institute of Biomedical Science and Technology (UoN-AiBST) laboratory and the Department of Pharmacognosy and Pharmacology for providing the facilities to work in and the Nation Blood Transfusion Services for providing the pooled plasma. We appreciate Dr. George Mureithi of Universal Corporation Limited (Kenya) for kindly donating the reference standards.
Conflict of Interest Declaration
The authors declare no conflict of interest.
REFERENCES
[1] K Cohen; J Hopkins; R Ingraham; C Pargellis; J Wu; D Palladino; P Kinkade; T Warren; S Rogers; J
Adams. J Biol Chem.1991, 266(22), 14670-14674.
[2] World Health Organisation. Consolidated Guidelines on HIV Prevention; Diagnosis, Treatment and
Care for Key Populations-2016 Update, 2016.
[3] AI Veldkamp; GJ Weverling; JM Lange; JS Montaner; P Reiss; DA Cooper; S Vella; D Hall; JH
Beijnen; RM Hoetelmans. AIDS. 2001, 15(9), 1089-1095.
[4] US Department of Health and Human Services, Food and Drug Administration, Center for Drug
Evaluation and Research (CDER), Center for Veterinary Medicine (CVM), 2001.
[5] C Ren; P Fan-Havard; N Schlabritz-Loutsevitch; Y Ling; KK Chan; Z Liu. Biomed Chromatogr. 2010,
24(7), 717-726.
[6] M Vogel; N Bertram; JC Wasmuth; J Emmelkamp; JK Rockstroh; C Reichel. J Chromatogr Sci.2010,
48(2), 91-94.
[7] P Hamrapurkar; M Phale; P Patil; N Shah. Int J PharmTech Res.2010, 2(2), 1316-1324.
[8] DA Kumar; MVN Babu; JVLNS Rao; VJ Rao. J Chem.2010, 7(1), 180-184.
[9] V Kabra; V Agrahari; C Karthikeyan; P Trivedi. Trop J Pharm Res. (2009, 8(1), 79-86.
[10] PS Ranaware; AM Ingle; A Ladke; AR Madgulkar; MC Damle. J Chem Pharm Res.2012, 4(6),
3003-3009.
[11] S Mustafa; W Nazirah; W Yusoff; NB Hassan. Int J PharmTech Res.2014, 6(1), 49-57.
[12] BS Kappelhoff; H Rosing; ADR Huitema; JH Beijnen. J Chromatogr B. 2003, 792(2), 353-362.
[13] CHK Venkata, DA Kumar; JVLNS Rao. J Chem.2010, 7(3), 821-826.
[14] OMS Minzi; E Ngaimisi. J Chem Pharm Res. 2010, 2(2), 431-439.
[15] MN Oluka; FA Okalebo; AN Guantai; RS McClelland; SM Graham. AIDS Res Ther.2015, 12(10),
1-9.
[16] BS Kappelhoff; F Van Leth; TR MacGregor; JMA Lange; JH Beijnen; ADR Huitema. Antivir Ther.