Lancaster University Management School
Working Paper
2003/066
The Design Features of Forecasting Support Systems and
their Effectiveness
Robert Fildes and Paul Goodwin
The Department of Management Science Lancaster University Management School
Lancaster LA1 4YX UK
©Robert Fildes and Paul Goodwin
All rights reserved. Short sections of text, not to exceed two paragraphs, may be quoted without explicit permission,
provided that full acknowledgement is given.
The LUMS Working Papers series can be accessed at http://www.lums.co.uk/publications
Effectiveness
Robert Fildes
The Management School
Lancaster University
Lancaster
LA1 4YX
United Kingdom
E-mail: [email protected]
Paul Goodwin
The Management School
University of Bath
Bath
BA2 7AY
United Kingdom
Tel: (44) + 122 538 3594
Fax: (44) +122 582 6473
Email: [email protected]
and
Michael Lawrence
School of Information Systems
University of New South Wales
Sydney 2052
Australia
Tel: 61 2 9385 4417
Fax: 61 2 9662 4061
Email: [email protected]
October 2003
Abstract
Forecasts play a key role in the management of the supply chain. In most organisations such forecasts form part of an information system on which other functions such as scheduling, resource planning and marketing depend. Forecast accuracy is, therefore, an important component in the delivery of an effective supply chain. Typically, the forecasts are produced by integrating managerial judgment with quantitative forecasts within a forecasting support system (FSS). However, there is much evidence that this integration is often carried out poorly with deleterious effects on accuracy. This study considers the role that a well-designed FSS might have in improving this situation. It integrates the
literatures on forecasting and decision support to explain the causes of the problem and to identify design features of FSSs that might help to ameliorate it. An assessment is made of the extent to which currently available business forecasting packages, which are widely employed in supply chain management, possess these features.
1. Introduction
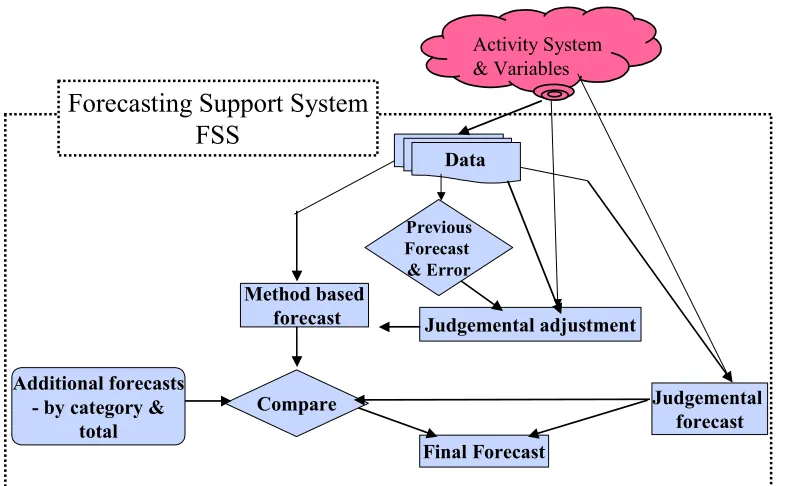
Enterprise resource planning (ERP) systems and, more specifically, systems that support the supply chain activities of purchasing, manufacturing, staffing and logistics have grown rapidly in importance across a wide range of organisational settings. In almost all of these systems, forecasting plays a key role, in that, before any functional activity can take place a detailed forecast must be prepared as an essential input to the planning system. Forecast estimation is usually done through a Forecasting Support System (FSS), an information system that embodies a database, various forecasting methods and
interventions made by the system users. A formal definition of a FSS is given in The Forecasting Dictionary (Armstrong, 2001) as:
“A set of procedures (typically computer based) that supports forecasting. It allows the analyst to easily access, organize and analyze a variety of information. It might also enable the analyst to incorporate judgment and monitor forecast accuracy.”
Such an FSS may be an integral part of the wider ERP system or, alternatively, a stand-alone system that delivers an output file of forecasts, which are then used in other functional areas. The key features of FSS are thus, a set of quantitative forecasting techniques such as exponential smoothing, (Fildes and Beard,1992) and managerial judgments which are, ideally, designed to take into account special factors such as
within the information system to support this belief. Additional forecast information may also be introduced before the final forecast is cast in stone. Current forecasting practice shows examples of both approaches.
Activity System & Variables
Additional forecasts - by category &
total
Previous Forecast & Error
Judgemental forecast Method based
forecast
Data
Judgemental adjustment
[image:5.612.95.488.160.403.2]Final Forecast Compare
Figure 1 The Forecasting Support System
Forecasting Support System
FSS
A FSS is an example of a decision support system (DSS) (Lawrence, Goodwin and Fildes, 2002), the critical element of which is that the system supports but does not replace the decision maker. Keen and Scott Morton (1978) define the decision task appropriate for a DSS as:
This paper draws on the forecasting and decision support system literatures and uses information obtained from a number of case organisations, and the commercial software they use, to identify how FSS design can be improved so that the integration of
management judgment and quantitative model based forecasts can be carried out more effectively. A particular advantage of studying FSSs is the (relatively) unambiguous measure of system quality, based on measures of forecast accuracy. This enables an estimation to be made of the relative value of the forecaster’s intervention with the aim of improving overall system performance. The paper’s main contribution is its focus on the interaction between the forecaster and the quantitative forecasting system model.
The paper first describes the design features of an FSS with brief reference to three case examples as well as some limited experimental evidence on usage. In section 3 we describe the ideal roles assigned to the quantitative forecast on the one hand and
managerial judgement on the other and discuss how this integration, in practice, departs from the ideal. Section 4 examines the key question of FSS design and how various system features can be manipulated to improve effective usage. Section 5 examines the software used in the case organisations, as well as drawing on various reviews of additional packages, to examine whether the desirable design principles, that have been identified, have their counterparts in commercial software. The paper concludes by considering the research issues raised by the gap between FSS design potential and their usage in organisations.
2. Forecasting Support Systems and their use in organisations
Quantitative forecasting methods have seen widespread adoption in support of company operations and supply chain activities – in 2001 the international market for these systems was worth $250m in the US and UK alone. In most practical supply chain management contexts, timely disaggregate forecasts are needed by a variety of users (e.g. logisitics, personnel, production, marketing and finance specialists) who will each use the forecasts to inform decisions within their own functional areas. The specific features of the
need to produce a large number of forecasts on a regular basis, (e.g. the requirement to make forecasts for over 10,000 products is common, (Fildes and Beard, 1992)), speedy feedback of forecast errors and the need to reconcile forecasts derived from different sources or methods including forecast adjustments. The scale of the problem, with forecasts often needed weekly, ensures that much of the task is computer-based; but the managerial aspects of the forecasting task are vital. Fildes and Hastings (1994) in an examination of various divisions of a multi-national organisation found the forecasters adopted very different roles depending on the organisational priority given to forecasting, the data availability and the product market. Moon, Mentzer and Smith (2003) have recently documented the forecasting function in a variety of US companies on four dimensions including functional integration and systems, arguing that for forecasting to be effective, information must be shared across ‘owners’ of the forecasting process and that information needs to be integrated within the components of the information system. However, none of these studies has focussed on how FSS are used in organisations and on the critical element of the interaction of the managerial judgement and the model.
In order to gain more detailed knowledge of the process within which an FSS is used, three case analyses of UK food and drink manufacturers were carried out. Interviews with the organisations’ forecasters and observation of the forecasting process has been used to provide the evidence on how managerial judgement is integrated into formal modelling (detailed descriptions are given in appendix A). All three organisations have strong similarities, supplying ‘food and drink’ to retailing outlets and supermarkets. Organisations 1 & 2 have sales that are dominated by supermarket accounts and the account managers’ forecasts must be taken into consideration (so much so that in organisation 1 they were ultimately responsible for the final forecasts). In each organisation the forecasting process is lead by the ‘Senior forecaster/ forecasting
manager’, though only in organisation 3 was the forecasting manager responsible for the final forecast. All three organisations introduced additional information into the
information may be injected through a joint meeting of the forecaster(s) and the account or brand managers or sequentially, for example via electronic communication. In
organisation 3 where there are many customers for their brands and the market is not promotion driven, marketing information is less relevant which explains the relative importance of the forecast manager in the process. Whatever process is used this may lead to over-rides of the system forecasts and in the three organisations this happened, though with different frequencies.
In summary, all three organisations accepted the importance of different types of managerial judgementally-based intervention in the estimation of the final forecast. However, there appeared to be little stress on evaluating the impact of such intervention, and seemingly little concern for attaining the optimal forecast accuracy (as statisticians would define it). When employing the system forecasts, users were usually content to accept the default parameterisation, particularly in series where promotional impact was high and therefore managerial intervention more frequent. Nevertheless, all of these organisations recognised that accuracy had an important impact on supply chain
operations and planning. While there has been limited user involvement in FSS design, all three organisations tailored the FSS when using it to meet the particular requirements of the product market being forecast. In organisation 1, for example, the need to take into account cross-product ‘steal’ when making the forecasts has led to supplementary report writing screens in Excel.
Is the balance between managerial expertise and the system-based quantitative forecasts in these organisations, and others, appropriate? The next two sections examine evidence on how best to integrate judgement with model based forecasts and how an FSS could be specified to ensure it is effective in operation.
3. The integration of judgement with a quantitative model
complex for the manager to perform, while leaving the judgments that the algorithm could neither make, nor recognize were needed, to the human”. Evidence has accumulated that integrating such judgement with quantitative forecasts when the
manager has access to information that has not been taken into account by the quantitative method leads to improved accuracy (e.g. see Donihue 1993, Mathews and
Diamantopoulos ,1990, Goodwin and Fildes,1999). However, judgmental adjustments are also often applied unnecessarily, when the manager has no extra information to bring to the forecast, with deleterious effects on forecast accuracy (Lim and O'Connor, 1995, Sanders and Ritzman, 2001). Even when the manager does have access to relevant information that is unavailable to the quantitative method, adjustments tend to be applied inefficiently so that the potential complementary benefits of judgment and quantitative method are not fully realised (Blattberg and Hoch,1990 ; Goodwin and Fildes,1999). A clear understanding of the role of the ‘mechanical system’ (i.e. the quantitative forecasts in an FSS) and the human judge is crucial to the success of an FSS. However,
understanding these roles is of course a necessary, but not a sufficient condition of success. Success also requires that the quantitative method and judgment perform their respective roles optimally. We now discuss the ideal balance between managerial judgement and the model before presenting research findings on the observed balance
1. The ideal balance
We can characterise a typical time series as consisting of three components:
1. Regular patterns or relationships (e.g. trends, seasonals, stable relationships between advertising expenditure and sales);
2. Irregular components arising from foreseeable events like promotions, either transitory or leading to non-reversionary changes in the medium term;
3. Noise (including the effects of known events that could not have been foreseen).
Case 1: Sufficient data for the quantitative method to identify regular patterns. Ideally, the FSS model should fully explain any regular patterns or relationships in the data, while the forecaster’s judgment should explain the effects of any foreseeable events that lead to irregularities in data. The judgemental forecaster is not as accurate as the quantitative forecasting method for the regular component. This limitation arises from the various human information processing inadequacies that have been identified in a wide variety of circumstances, including time series forecasting (see for example, Kahneman and Tversky, 2000). However, the quantitative model is unable to accurately forecast the irregular component as, by definition, it includes only those situations where there is inadequate data from which to build a formal model.
Case 2: Insufficient data available for the quantitative method to confidently identify regular patterns.
In circumstances where there is, as yet, insufficient data for the quantitative method to reliably estimate the regular component, the judgmental forecaster must attempt to make up for this deficit and also forecast a part of the effects of foreseeable events that will lead to irregularities.
Of course, in neither case can the quantitative model or the judge be expected to forecast the noise in the series. For both these cases, if the ideal balance could be achieved between the system forecasts and the human forecaster, there are several reasons why more accurate forecasts could be expected in the long run. First, the fact that the
Confining the judgemental forecaster’s attention to the irregular component will also make the best use of the forecaster’s available effort (Jones and Brown, 2002). Payne et al. (1993) have demonstrated that people determine the amount of effort that they are willing to devote to judgmental tasks by balancing the perceived benefits of performing the task accurately against the perceived effort that achieving given levels of accuracy will require. This suggests that in a given task people will have an ‘effort budget’.
Clearly, it is desirable that this budget should be expended to maximum advantage and, if effort is wasted in duplicating the role of the quantitative method, then less will be available for assessing the effects of special events or new circumstances. In addition, partially duplicating the role of the quantitative forecast may mean that the effects of some factors that drive the forecast variable are double counted (Goodwin, 2002).
2. The actual balance when using FSSs
also offer an automatic routine (Kusters and Bell, Forecasting Report, 1999). In the case examples, the forecasters could either operate the models in default mode or search out a ‘best model’ for the problem they faced, either judgementally or through optimisation.
With both types of system there is evidence from research that the usage of FSSs in practice falls far short of the ideals that were outlined earlier. When users have the ability to choose the quantitative method, their choice is often quite poor (Lawrence, Goodwin and Fildes, 2002). Default parameter values or sub-optimal methods are often selected (Fildes and Beard,1992) and forecasters attempt to make up for this (unnecessary) shortfall by making large judgmental adjustments to the quantitative forecast. However, these adjustments are a poor substitute for improved quantitative forecasts (Lawrence et al.,2002; Goodwin et al.,2001).
When it comes tomaking judgmental adjustments toquantitative forecasts provided automatically by the system, a number of problems arise. First judgment is not restricted to its ‘ideal role’. People attempt to forecast perceived regularities, when this is
unnecessary, and to forecast noise –largely because these two components are usually confused (Goodwin and Wright,1993; Harvey,1995; Lim and O'Connor,1995; Goodwin and Fildes,1999; Sanders and Ritzman,2001). This means that they make unnecessary and damaging adjustments to the quantitative forecasts and are then over confident in the accuracy of their adjusted forecasts (Lawrence and Sim,1999). When making
judgmental adjustments to take into account foreseeable special events, like sales promotions, people ignore the quantitative forecast altogether, even when it offers an accurate prediction of the underlying regular time series pattern (Goodwin and
Fildes,1999). For example, in case organisation 2, little attention was paid to the model-based forecasts when a product was being promoted.
involvement. However, in experimental studies of the interaction between the forecaster and the model based forecasts, the results have been far from optimal. The chief
problems identified are:
a) Excessive trust by managers in their own judgement and unwillingness to sufficiently trust the model to forecast the “regular pattern”,
b) Managerial judgement influenced by randomness,
c) Poor understanding by managers of appropriate level of confidence in system.
The question is, how can FSSs be designed to overcome these problems and improve forecasting effectiveness.
4. Designing FSSs to improve effectiveness
How should FSSs be designed to overcome the inefficiencies that are commonly
associated with the integration of judgment and quantitative methods? An examination of the DSS literature suggests six approaches. We examine and evaluate these approaches below.
1) Manipulating effort-versus-perceived-accuracy trade-offs
Research by Payne et al. (1993) suggests that decision makers seek to balance effort and accuracy considerations. Other frameworks suggest a similar trade-off. For example, the Technology Acceptance model of Davis (Davis,1989) posits that users’ willingness to use computer technology is based on the technology’s ease of use (which is akin to effort involved in using the technology) and perceived usefulness (which correlates with
perceived accuracy). This suggests that FSS designers can manipulate users towards using superior forecasting methods by making more desirable forecasting strategies less
At first sight this appears to conflict with research on judgmental forecasting where people presented with automated quantitative forecasts regularly make the effort to judgmentally adjust these forecasts. However, presumably when the effort involved in adjustment is low and is perceived to be associated with an increase in accuracy, this small extra effort appears to be worthwhile (the adjustment may simply involve using a mouse to click on a graph in order to indicate the revised forecast). Indeed, (Goodwin, 2000b) showed how propensity to make damaging adjustments was reduced by making adjustments involve only a small amount of extra effort: -simply asking users to request an adjustment led to a significant reduction in damaging adjustments. Asking users also to click on a list to select the reason for their adjustment led to further reductions. This was achieved without deterring the forecaster from making adjustments when it was clear they were required in order to improve accuracy.
There are a number of ways in which the relative effort associated with the desirable strategy can be reduced in an FSS. These include the following.
a) Providing automated quantitative forecasts, where these are appropriate, and making the judgmental adjustment of these more demanding;
b) Designing easy-to-use facilities that are necessary to obtain the appropriate quantitative forecast Fildes and Beard (1992) suggest that these facilities should:
i) allow data series to be adjusted easily for exceptional and missing observations;
ii) enable identification of series by type (e.g., new product, intermittent demand, declining demand);
iii) provide the ability to forecast at both individual item and aggregate levels so that common aggregate effects can be driven down the product hierarchy; iv) include the availability of an experimental module to allow comparison of different methods;
While the software in use in the three case companies included features (i) to (iii), features (iv) and (v) were absent.
c) Providing menu structures that deliberately guide users towards the adoption of appropriate strategies (Silver,1991); this was not available in the cases studied. d) Avoiding overwhelming the user with information (see O'Donnell and David (2000) for a discussion of issues relating to the handling of large data sets within systems designed to support decisions); a typical example in an FSS is through exception reporting of extreme errors, further simplified to class A skus, and the tailoring of appropriate reports. (This facility was available in all three cases.)
e) Providing memory support (Singh,1998); for example, to avoid repetition of strategies already tried. In a study that involved tracing user’s selection of a quantitative
forecasting method (Goodwin et al.,2001) some users returned several times to look at the application of a given quantitative forecasting method to a series. Memory aids, such as the display of small graphs showing the result of the applications already tried, might have helped (this was unavailable in the software used in the case companies). f) Providing ‘strategy support’(Singh,1998); this enables users to monitor their execution of a desirable decision making strategy by warning them of necessary steps they have omitted or steps they have unnecessarily repeated. For example, in an FSS it may be possible to identify an organized and systematic procedure for searching for the most appropriate quantitative method –deviations from this procedure would be flagged allowing the user’s effort not to be wasted (this was unavailable in the software used in the case companies).
g) Providing decomposition facilities; on the assumption that a set of decomposed judgements are more accurate than a single holistic judgement. An experiment
involving Webby’s prototypical FSS, Griffin, showed that forecasters were able to take more information into account and to produce more accurate forecast when they used the decomposition facility available in the system (Webby et al.,2001) (this was unavailable in the software used in the case companies).
In the last section we discussed designing the FSS to manipulate the effort involved in adopting particular strategies so that the appropriateness of a strategy is inversely related to the effort required to implement it. The other side of Payne et al’s trade-off is the perceived accuracy of the available alternative strategies. In making choices about which quantitative method to employ and whether judgmentally to adjust the resulting forecasts, FSS users will, at least implicitly, be making assessments of their confidence in the
relative accuracy of these alternatives. Calibration refers to the extent to which the user’s confidence in a chosen course of action equates with the objective accuracy of that act. Poor calibration can be manifested as overconfidence, which can result in the selection of a poor course of action, or underconfidence, which may mean that accurate strategies are foregone. Thus the widely observed tendency of users to make damaging adjustments to quantitative forecasts (Goodwin and Fildes,1999; Lim and O'Connor,1995) or to
overweight their less accurate judgmental forecasts relative to quantitative forecasts(Lim and O'Connor,1996) can be explained by their overconfidence in the accuracy of their judgment. Poor calibration has been reported in a wide range of domains, including forecasting (e.g. Lawrence and Sim,1999).
It is evident that the design of computerised support systems can play a role in
influencing confidence and hence calibration. For example, providing more information can lead to miscalibration because it leads to unwarranted increases in confidence (Oskamp,1965). Similarly, decisions based on information displayed as text leads to greater confidence than decisions based on numeric information, while the availability of a “what-if” facility leads to overconfidence because it creates an “illusion of control” (Davis and Kotteman ,1994). In a forecasting task, Lawrence and O'Connor (1993) showed that confidence associated with point forecasts was influenced by several factors including the scale of the graph that displayed the time series. Similarly, Jiang et
How should FSS’s be designed to improve user calibration so that the perceived accuracy of options available within the FSS more closely approximate objective accuracy? Much work remains to be carried out in this area but Kasper (1996) has proposed a theory on how support systems should be designed to enable the user to achieve, what he calls, “perfect calibration”. Underpinning this theory is the notion that a person’s calibration depends upon two factors: i) what they know and ii) what they think they know and that these factors, in turn, are based on their mental representation of a problem (Gigerenzer et al.,1991). Knowing what one does not know requires inquiry and this is predominantly based in exploratory reasoning. (Other researchers also stress the role of support systems in matching and extending the users’ mental models, e.g. Montazemi et al.,1996;
O'Donnell and David,2000).
Kasper proposes a design theory to address user calibration. This theory asserts that a user’s calibration is impacted by the properties of the i) expressiveness, ii) visibility and iii) inquirability of the system.
(i) Expressiveness refers to the ‘tone in which dialogue symbols are presented to the user’ through. for example, screen or audio media. People’s perceptions, emotional reactions and motivations will all be affected by the words and phrases used in the computer dialogue (Shneiderman,1987). Furthermore, the way in which dialogue is framed (e.g. “actual sales” versus “deviation of sales from target”) is also known to have a major impact on user’s decisions (Kahneman and Tversky,2000). Further research is needed to find appropriate forms of expressiveness for FSSs. In particular, the
opportunities presented by multimedia channels remain largely unexplored (O'Donnell and David, 2000). For example, an FSS offering advice and explanation via an audio channel is likely to affect user confidence through the tone and accent of the voice delivering the message.
tabular displays for untrended series and graphical displays for trended series1 (Harvey and Bolger, 1996; Onkal-Atay et al.,2002) so an FSS that automatically produced the most appropriate form of display, given the nature of the series would be expected to improve calibration. For some series, deeper user understanding is likely to be achieved by using graphs to show how the forecast is assembled from components such as trends and seasonal factors (Edmundson,1990). Indeed, at the current time we have little
knowledge of the impact of different forms of visual representation (which might include animation and realistic versus abstract imagery) on user confidence. Again, more research is needed to determine the design of visual imagery that would lead to improved
calibration in particular forecasting contexts.
(iii) Inquirability refers to the extent to which the support system engenders an ‘accurate feeling of knowing’ (Kasper,1996)). Inquirability features include those designed to suggest or prompt courses of action or to give advice. Other systems may have facilities that challenge the user’s position and assumptions though dialectic inquiry. The evidence of the DSS literature is that dialectical inquiry is most likely to improve calibration, while systems which merely give advice without any supporting explanation lead to
miscalibration. This is because they fail to reveal assumptions or encourage alternative views of the problem (Gregor & Benbasat, 1999). As Muir (1987) points out, such systems place the user in the difficult position of needing to make changes, when appropriate, to the recommendations of a system which is presumed to be more competent than them. In forecasting, when users are presented with a quantitative forecast, without any supporting explanation or justification, they tend to be
overconfident in their ability to improve the forecast by judgmentally adjusting it (Lim and O'Connor,1995;Goodwin and Fildes,1999). In contrast, providing short explanations of quantitative forecasts did lead to improvements in accuracy (Goodwin and Fildes (1999), Lawrence, Davies, O’Connor and, Goodwin, (2002)).
Once again, little research has been carried out into how FSSs might be designed to allow dialectical inquiry. However, a study by Goodwin (2000b) found that requiring
1 Though the graphs versus table issue has attracted a large literature and many issues remain unresolved
forecasters to give a reason for their decision to adjust a quantitative forecast led to a reduction in the number of damaging adjustments, without affecting the propensity to make adjustments when they were needed (though this policy may also have succeeded because documenting the reason for an adjustment increases effort and therefore will act as a deterrence - unless the benefits of the adjustment are perceived to warrant it). In contrast, in Lim and O’Connor’s study (Lim and O'Connor,1995) user’s overconfidence in their judgment was unaffected when they were challenged by the system.
3) Providing learning facilities
One obvious way of enhancing the utility of an FSS is to allow users to learn about the tool. However, we need to distinguish between training in the use of the FSS as a
computer package (i.e. learning about its facilities and how to apply them) and the need for users to learn about the forecasting task through experience.
As might be expected, there is evidence that to make effective use of a DSS, users must have sufficient training (Mackay and Elam,1992). In a forecasting context, (Goodwin et al.,2001) found that users who spent a larger percentage of their total time practising using the FSS on a trial run, before applying the package to the forecasting task, tended to achieve more accurate forecasts. This suggests time spent exploring and practicing the use of an FSS is beneficial and thus FSS designs should incorporate training facilities such as tutorial support and a comprehensive and easily available help menu.
Learning through experience can be facilitated if the FSS provides feedback. In their list of the features that would be present in an ideal forecasting system Fildes and Beard (1992) propose that feedback should be available to allow the evaluation of judgmental adjustments (e.g. due to promotion activity). Feedback can take a number of forms (Benson and Onkal,1992; Balzer et al.,1989) including:
i) simply supplying the user with the latest outcome (e.g. the latest sales figure) (outcome feedback),
iii) informing the user about his or her apparent forecasting strategy (cognitive process feedback)
and iv) giving the user statistical information about the task (e.g. correlations of possible predictor variables with the forecast variable or details of underlying time series structure) (task properties feedback).
A large body of psychological research suggests that feedback is most effective in promoting learning when it takes the form of task properties feedback. (Balzer et al.,1989) and this result has been found to apply in the forecasting context (Remus et al.,1996). Indeed, outcome feedback may actually damage performance by drawing attention to the most recent observation (which will contain noise) and thereby
accentuating the tendency to overweight this observation in the subsequent forecast. This was the most prominent form of feedback in the case organisations. However, the relative merits of task properties feedback present a dilemma in the context of an ideal FSS. If we restrict the role of judgment to that of estimating the effect of events for which there is a paucity of statistical data, then by definition, there will be an absence of data to formulate the feedback. More research is therefore needed on the effectiveness of providing
performance or cognitive process feedback in a forecasting context (for example Remus et al’s study did not compare providing cognitive process feedback, on its own, with other types of feedback). There may, of course, be an interaction between the effectiveness of feedback and the form in which it is presented, given the notions of expressiveness and visibility that were discussed earlier.
4) Fostering a sense of ownership of the forecasts
choice of quantitative model and its parameters. Such operational involvement is only possible within an interactive system (see our earlier definition).
Given the tendency of users to underweight the value of advice and information provided by an FSS it seems reasonable to hypothesise that such advice might be given greater attention and credibility if the user has been involved in its derivation. Indeed, for this reason, Lawrence (1996) has argued that FSS should be behaviourally, rather than mathematically, based in that the fundamental method for producing the forecast is management judgment with quantitative methods merely providing support. He cites Edmundson’s GRAFFECT software (Edmundson,1990), which guided users through a judgmental decomposition of a time series into trend, seasonal and random components and extrapolated the resulting estimates, as an example of such a tool. The idea that user involvement might increase their acceptance of FSS advice was supported by the results of a study by Lawrence et al. (2000). Here users had a lower propensity to adjust
quantitative forecasts that they had helped to derive. However, this greater acceptance of the system’s advice came at a price. Users tended to derive poor quantitative forecasts (often obtaining these by using inappropriate default parameter values). This meant that they were more willing to accept poor advice that they had been involved in deriving, than more accurate advice which was presented to them without their involvement. The challenge facing systems designers is therefore to foster the user’s sense of involvement while at the same time guiding them towards the most appropriate choices. Designs which incorporate memory and strategy support (Singh,1998), and which manipulate user effort and user confidence in order to achieve this goal, may offer the best way forward. Alternatively, the effect of involving the user in the initial design of the FSS is worth exploring. Indeed, in the future, software may contain the facility for users to design their own support tool.
However, the need to foster a sense of ownership might rule out their use within the FSS unless these are used simply to provide additional information, such as feedback, to the forecaster.
5) Overall acceptance of the FSS
Clearly, the design features of an FSS must make it acceptable to the forecaster otherwise it will either be abandoned, or if its use is compulsory, the performance obtained from it will probably fall short of its potential. Unless care is taken with the details of the FSS design, the need for user acceptance may conflict with other desirable attributes. For example, while a system that criticises and challenges the user may help to enhance that user’s mental model of the forecasting problem, criticism that is tactless or irritating may result in a refusal to use the system at all.
Venkatesh and Davis’s extension of the technology acceptance model (TAM2)
(Venkatesh and Davis, 2000) specifies the factors that determine users’ acceptance of IT tools these being: i) ease of use ii) result demonstrability iii) output quality, iv) job
relevance v) image and vi) subjective norm. These factors vary in the extent to which they can be controlled directly through the design of the tool.
Ease of use is clearly a design factor. The Supply Chain software used in the case
organisations are all seen as adequately meeting current user standards, in contrast to the software examined ten years earlier in Fildes and Beard (1992). However, the complexity of handling many thousand data series have led to various software design compromises, e.g. providing few summaries of the data series and the system’s forecasting accuracy. Thus, ‘ease of use’ has dominated other desirable aspects.
Result demonstrability –which is defined as “the tangibility of the results of using the innovation ”(Moore and Benbasat,1991) is also a design factor. In an FSS the
is a bound on forecast accuracy. Bunn and Taylor (2001) discuss a method that estimates this irreducible uncertainty and therefore provides a benchmark for what the FSS can reasonably be expected to achieve. Also, individual large errors may be rare but they will also be salient (Taylor and Thomas,1982) and may create the perception that the system is less accurate than it really is. This suggests that it may be wise for the FSS to draw the user’s attention to performance over a relative long period, and if possible, to demonstrate its accuracy relative to non-use of the system. Confusion between forecasts, decisions, targets and plans may also bias users’ perceptions of accuracy so clearly conveying what the FSS is designed to achieve is crucial (Goodwin,1998). All of this suggests that result demonstrability will be achieved by the existence and clarity of explanations of forecasts and accuracy measures.
Output quality refers to users’ or potential users’ judgments about how well the system performs its tasks. TAM2 suggests that this perception is important when the potential user has to select one system from a choice of several alternative systems. During the decision to adopt software in case organisation 3, comparative tests were carried out with alternatives. More typically, data base specifications and compatibility with existing ERP software apparently dominate the adoption decision.
The remaining three determinants of the acceptance of technology identified by TAM2 are primarily influenced by the organisational context within which it is intended that the technology will be employed. As such, these determinants are less capable of being directly influenced through the support system design. Subjective norm is defined as a “person’s perception that most people who are important to him think he should, or should not, perform the behaviour in question”. In the FSS context this may relate to the attitude to the system (or facilities within the system) of top managers or fellow team members. Image is defined as “the degree to which the use of an innovation is perceived to enhance one’s status in one’s social system”. It is, of course, possible that the
determinant. In the case organisations, neither of these issues are important in that the FSS is both deemed a necessary part of the forecasting activity and once adopted its use, even if primarily as a data base, is not optional.
Job relevance is defined as “an individual’s perception regarding the degree to which the target system is applicable to his or her job. Job relevance is a function of the importance within one’s job of the set of tasks the system is capable of supporting”. This implies that acceptance of an FSS will be imperilled when forecasting is seen as a small part of the user’s job or is perceived not to be important within the organisation. In case organisation 1 this could apply to the off-line forecasts produced to understand the impact of price promotions, but for all three organisations, the forecasting systems and the associated data bases are integral to supply chain planning and therefore could not be abandoned.
5. Evaluation and Conclusions
So far we have proposed four design principles for FSS: i) manipulate effort ii)
manipulate confidence iii) provide facilities for learning iv) foster a sense of ownership of the forecasts. All these need to be incorporated into an FSS without endangering the final requirement: the FSS must be acceptable to the user. To what extent do commercial software packages, available to support supply chain management meet the design principles outlined above? Evidence from the software used in the case organisations and various surveys of forecasting software (see Appendix B) reveals major gaps as we now show.
quantitative methods, facilities for memory and strategy support (see above) are generally absent.
All the supply chain FSSs provide facilities for judgmental overrides or adjustments of quantitative forecasts. They also advertise the ease with which such adjustments can be made, whereas the effort-manipulation principle would suggest that such adjustments should be made more effortful. Clearly, there is a potential conflict here between the acceptability (and hence sales) of the system and the need to discourage gratuitous judgmental adjustments. Also, when judgmental adjustments are likely to be beneficial, decomposition into the particular features (or reasons) for making the adjustment may prove helpful, but none of the packages in our sample had a facility for structuring adjustments in this way.
Manipulating confidence. Most methods that might improve users’ calibration require more research before they can justifiably be included in commercial programs. However, there is strong evidence to date to suggest that dialectical inquiry systems will be
beneficial. Such systems are not seen in commercial software, but Prophecy, a primarily judgmental FSS, does warn users of possible problems with their forecasts. For example, they are warned when they have forecast a percentage increase in sales (relative to the moving annual average) which exceeds that of any increase that has previously been observed for that series. Moreover, statistical forecasts in this package are presented as a ‘sanity check’ on the judgmental forecast.
The supply chain FSSs collect error information on the judgemental adjustment processes and this could be used to generate reports summarising the accuracy of the interventions but seemingly isn’t. Some Packages like Forecast Pro allow users to comment as to why the judgemental overrides were implemented. These facilities may encourage learning, but only if users are prepared, at a later stage, to review the rationale for adjustments and their effects.
Fostering a sense of ownership. All of the packages in our sample were interactive in that they allowed users to ‘design’ their quantitative forecasts by choosing the method and parameter values. They also allow user control of output reports.
Overall acceptability. Most of the supply chain FSSs in our sample are likely to be acceptable to users because of their ease of use. However, another key factor influencing acceptance, result demonstrability, is less obviously present. For example, none of the packages in organisational use had a specific facilityenabling users to compare their forecasting accuracy with simple naïve benchmarks. Also, no package was able to communicate the idea of an irreducible error and an estimate of its size to users (Bunn & Taylor, 2001) though ForecastPro supplies a time series decomposition which gives a weak estimate of the series randomness. Even when different methods are available within many packages, no comparisons of forecast accuracy are readily available.
In summary, the design principles we have proposed face the designers of computerised support for forecasting in supply chain management with a fundamental dilemma. If such systems are to approach the ideal outlined in section 3 then they have to discourage the natural tendency of users to substitute their own estimates of regularities in the data for those of quantitative methods (assuming that sufficient data is available to support the estimates of the quantitative method). The ideal system needs to encourage them to confine their attention to rigorously applying their knowledge of significant forthcoming events that are not incorporated into the quantitative forecast. However, the devices for achieving this suggested by DSS and forecasting research: -making unwarranted adjustments of statistical forecasts more difficult, increasing the structure and
mental model through dialectical inquiry- are unlikely to make such software attractive to potential purchasers and users, unless designed with care.
The proposed design features that might help to resolve this dilemma are currently under researched and their effectiveness is not assured. Moreover, in a supply chain
management context as described in Figure 1, such design features would need to take into account the large number of forecasts that need to be made on a regular basis and hence the limited time that the forecaster is able to devote to each forecast. In the light of this, it is not surprising that developers of commercial forecasting software have paid little attention to forecasting support as opposed to forecasting per se. For supply chain FSSs, even the focus on statistical forecasting methods has been lost with the design features associated with ease-of-use and data base management (such as product classification and product hierarchy facilities) emphasised. As we have argued such an emphasis can only increase forecast error. Thus, the development of commercially attractive software systems that encourage the appropriate use of both quantitative methods and judgment offers many opportunities for researchers and software designers in the future.
References
Alavi,M. & Joachimsthaler,E.A. (1992 ). Revisiting DSS implementation research: a meta-analysis of the literature and suggestions for researchers. MIS Quarterly 16, 95-116.
Armstrong,J.S. (2001). Principles of Forecasting, Boston: Kluwer Academic Publishers.
Balzer,W.K., Doherty,M.E. & O'Connor,R. (1989 ). Effects of cognitive feedback on performance. Psychological Bulletin 106, 410-433.
Benson,P.G. & Onkal,D. (1992 ). The effects of feedback and training on the performance of probability forecasters. International Journal of Forecasting 8, 559-573.
Bunn,D.W. & Taylor,J.W. (2001 ). Setting accuracy targets for short-term judgmental forecasts.
International Journal of Forecasting 17, 159-169.
Davis,F.D. (1989 ). Perceived usefulness, perceived ease of use, and user acceptance of information technology. MIS Quarterly 13, 319-340.
Davis,F.D. & Kottemann,J.E. (1994 ). User perceptions of decision support effectiveness: two production planning experiments. Decision Sciences 25, 57-78.
Donihue,M.R. (1993 ). Evaluating the role judgment plays in forecast accuracy. Journal of Forecasting 12, 81-92.
Edmundson,R. (1990 ). Decomposition: A strategy for judgemental forecasting. Journal of Forecasting 9, 305-314.
Fildes,R. & Beard,C. (1992 ). Forecasting systems for production and inventory control.
International Journal of Operations and Production Management 12, 4-27.
Fildes R, Hastings R. (1994). The organisation and improvement of market forecasting. Journal of the Operational Research Society 45, 1-16.
Fildes, R. & Ord, J.K. (2002) “Forecasting Competitions – their role in improving forecasting practice and research”, with J. Keith Ord, in: A Companion to Economic Forecasting, M. Clements and D. Hendry (eds.), Oxford, Blackwell, 322-353.
Finlay,P.N. & Marples,C.G. (1997 ). A classification of management support systems. Systems Practice 10, 85-108.
Gigerenzer,G., Hoffrage,U. & Kleinbolting,H. (1991 ). Probabilistic mental models: a Brunswikian theory of confidence. Psychological Review 98, 506-528.
Goodwin,P. (1998). Enhancing judgmental sales forecasting: The role of laboratory research. In: G.Wright & P.Goodwin (Eds.), Forecasting with Judgment (pp. 91-111). Chichester, UK: John Wiley.
Goodwin,P. (2000a ). Correct or combine? Mechanically integrating judgmental forecasts with statistical methods. International Journal of Forecasting 16, 261-275.
Goodwin,P. (2000b ). Improving the voluntary integration of statistical forecasts and judgment.
International Journal of Forecasting 16, 85-99.
Goodwin,P. (2002 ). Integrating management judgment with statistical methods to improve short-term forecasts. Omega: International Journal of Management Science 30, 127-135.
Goodwin,P. & Fildes,R. (1999 ). Judgmental forecasts of time series affected by special events: Does providing a statistical forecast improve accuracy? Journal of Behavioral Decision Making.
Goodwin,P, Fildes,R, & Lawrence,M. (2001) Tracing the process of using a forecasting support system. Twenty-First International Symposium on Forecasting, Atlanta.
Goodwin,P. & Wright,G. (1993 ). Improving judgmental time series forecasting: A review of the guidance provided by research. International Journal of Forecasting, 9, 147-161.
Gregor, S. & Benbasat, I., (1999) Explanations from intelligent systems: theoretical foundations and implications for practice. MIS Quarterly, 23, 4, 497-530.
Harvey,N. (1995 ). Why are judgments less consistent in less predictable task situations?
Organizational Behavior and Human Decision Processes 63, 247-263.
Harvey,N. & Bolger,F. (1996 ). Graphs versus tables: Effects of data presentation format in judgmental forecasting. International Journal of Forecasting 12, 119-137.
Jiang,J.J., Muhanna,W.A. & Pick,R.A. (1996 ). The impact of model performance history
information on users' confidence in decision models: An experimental examination. Computers in Human Behavior 12, 193-207.
Jones,D.R. & Brown,D. (2002 ). The division of labor between human and computer in the presence of decision support system advice. Decision Support Systems, 33, 375-388.
Kahneman,D. & Tversky,A. (2000). Choices, Values and Frames, Cambridge: Cambridge University Press.
Kasper,G.M. (1996 ). A theory of decision support system design for user calibration. Information Systems Research 7, 215-232.
Keen,P.G.W. & Scott Morton, M.S. (1978). Decision Support Systems: An Organizational Perspective, Reading, UK: Addison-Wesley.
Küsters, U. & Bell, M. (1999). The Forecasting Report, Höhenkirchen, Germany and Brookline, MA: IT Research.
Lawrence,M. (1996). Design and testing of a DSS to help reduce bias in judgmental forecasting. In: P.Humphreys (Ed.), Implementing Systems for Supporting Management Decisions: Concepts Methods and Experiences (pp. 261-269).: Chapman and Hall.
Lawrence M., Davies L., O’Connor M. & Goodwin P., “Influence of Explanations and Affect on DSS use and Decision Accuracy”. International Symposium on Forecasting Dublin 2002.
Lawrence,M. & O'Connor,M. (1993 ). Scale, randomness and the calibration of judgemental confidence intervals. Organizational Behavior and Human Decision Processes 56, 441-458.
Lawrence,M.J. & Sim,W. (1999 ). Prototyping a financial DSS. Omega 27, 445-450.
Lim,J.S. & O'Connor,M. (1995 ). Judgemental Adjustment of Initial Forecasts: Its effectiveness and biases. Journal of Behavioral Decision Making 8, 149-168.
Lim,J.S. & O'Connor,M. (1996 ). Judgmental forecasting with interactive forecasting support systems. Decision Support Systems 16, 339-357.
Mackay,J.M. & Elam,J.J. (1992 ). A comparative study of how experts and novices use a decision aid to solve problems in complex knowledge domains. Information Systems Research 3, 150-172.
Mathews,B.P. & Diamantopoulos,A. (1990 ). Judgemental revision of sales forecasts: Effectiveness of forecast selection. Journal of Forecasting 9, 407-415.
Montazemi,A.R., Wang,F., Nainar,S.M.K. & Bart,C.K. (1996 ). On the effectiveness of decisional guidance. Decision Support Systems 18, 181-198.
Moon, M.A., Mentzer, J.T., & Smith, C.D. (2003).Conducting a sales forecasting audit,
International Journal of Forecasting, 18, forthcoming.
Moore,G.C. & Benbasat,I. (1991 ). Development of an instrument to measure the perceptions of adopting an information technology innovation. Information Systems Research 2, 192-222.
Muir,B.M. (1987). Trust between humans and machines, and the design of decision aids.
International Journal of Man-Machine Studies 27, 527-539.
O’Connor, M., Remus, W, & Griggs, K. (1993). Judgemental forecasting in times of change.
International Journal of Forecasting, 9, 163-172.
O'Donnell,E. & David,J.S. (2000). How information systems influence user decisions: a research framework and literature review. International Journal of Accounting Information Systems 1, 178-203.
Onkal-Atay,D., Thomson,M.E., & Pollock,A.C. (2002). Judgmental forecasting. In:
M.P.Clements & D.F.Hendry (Eds.), A Companion to Economic Forecasting (pp. 133-151). Oxford: Blackwell.
Ord ,K., Hibon,M. & Makridakis,S. (2000 ). The M3-Competition. International Journal of Forecasting 16, 433-436.
Payne,J.W., Bettman,J.R., & Johnson,E.J. (1993). The Adaptive Decision Maker, Cambridge, UK: Cambridge University Press.
Quintanar,L.R., Crowell,C.R., Pryor,J.B. & Adamopoulos,J. (1982 ). Human computer interaction: a preliminary social psychological analysis. Behavior Research Methods & Instrumentation 14, 210-220.
Remus,W., O'Connor,M. & Griggs,K. (1996 ). Does feedback improve the accuracy of recurrent judgemental forecasts? Organizational Behavior and Human Decision Processes 66, 22-30.
Sanders,N. & Ritzman,L. (2001). Judgmental Adjustments of Statistical Forecasts. In:
J.S.Armstrong (Ed.), Principles of Forecasting: A Handbook for Researchers and Practitioners,
(pp. 405-416). Norwell, MA: Kluwer Academic Publishers.
Schultz,R.L. (1984 ). The implementation of forecasting models. Journal of Forecasting 3, 43-55.
Shneiderman,B. (1987). Designing the User Interface: Strategies for Effective Human-Computer Interaction, Reading, MA: Addison-Wesley.
Silver,M.S. (1991 ). Decisional guidance for computer-based support. MIS Quarterly 15, 105-133.
Singh,D.T. (1998 ). Incorporating cognitive aids into decision support systems: the case of the strategy execution process. Decision Support Systems 24, 145-163.
Tashman,L.J. & Hoover,J. (2001). Diffusion of forecasting principles through software. In: J.S.Armstrong (Ed.), Principles of Forecasting: A Handbook for Researchers and Practitioners
(pp. 651-676). Boston: Kluwer Academic Publishers.
Taylor,P.F. & Thomas,M.E. (1982 ). Short term forecasting: Horses for courses. Journal of the Operational Research Society 33, 685-694.
Todd,P. & Benbasat,I. (1999 ). Evaluating the impact of DSS, cognitive effort, and incentives on strategy selection. Information Systems Research 10, 356-374.
Turban,E. (1995). Decision Support and Expert Systems: Management Support Systems, Engelwood Cliffs, N.J: Prentice Hall.
Venkatesh,V. & Davis,F.D. (2000 ). A theoretical extension of the Technology Acceptance Model: Four longitudinal field studies. Management Science 46, 186-204.
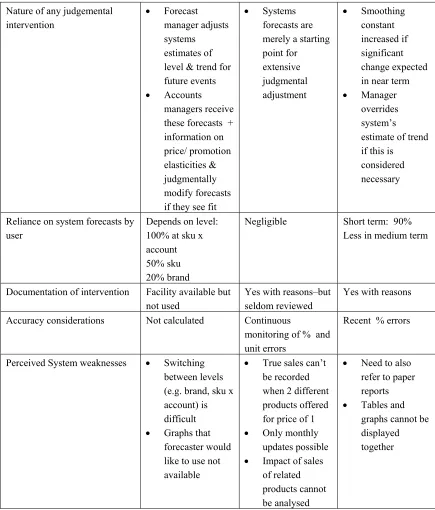
6. Appendix A A comparison of forecasting in the three case organisations
The table below gives details of the forecasting tasks in the three case organizations. Organisation’s 1 and 3 are both alcoholic drinks producers, while Organisation 2 is a food producer, whose goods are sold mainly in cans or bottles. All 3 organisations supply their products to retailers throughout the UK.
Organisation 1 Organisation 2 Organisation 3
Frequency of forecasting Monthly Monthly Weekly
Number of products forecast 200 skus x 50 accounts
2000 skus 70 skus
Nature of time series Upward trend and two seasonal peaks, overlaid with weather, pricing and event effects
Dominated by effects of previous and current promotions and promotions of other products
Generally stable with downward trend & seasonality. Some weather effects.
Forecast horizon 24 months 24 months 57 weeks
Information available a) sales history b) price promotions c) past (rolling) forecasts d) Account managers
forecasts
e) customer information f) weather forecasts g) competitors’ sales
4 yrs weekly
9 9 9
9
1year monthly (?)
9 9 9 9 9 9
3 years weekly n.a.
9
n.a.
9 9
Lowest Level of Aggregation Sku x Account (weekly shipments)
Sku x Account (weekly sales)
Sku x Depot (weekly shipments) Organisational Importance of
forecasting
High High High
Involvement in system choice - major criteria?
Yes Yes Yes
Involved in system design No No Yes
Range of methods Smoothing models Bayesian smoothing
models + intermittent demand
Smoothing Models
Choice of method Alternatives
considered
Default Only one method
generally used
- how chosen Forecaster chooses Default Forecaster chooses
Parameterisation RMSE minimisation
over all available history (after removing effects of promotions)
Default Default or
Nature of any judgemental intervention
• Forecast manager adjusts systems estimates of level & trend for future events
• Accounts managers receive these forecasts + information on price/ promotion elasticities & judgmentally modify forecasts if they see fit
• Systems forecasts are merely a starting point for extensive judgmental adjustment
• Smoothing constant increased if significant change expected in near term
• Manager overrides system’s estimate of trend if this is
considered necessary
Reliance on system forecasts by user
Depends on level: 100% at sku x account 50% sku 20% brand
Negligible Short term: 90%
Less in medium term
Documentation of intervention Facility available but not used
Yes with reasons–but seldom reviewed
Yes with reasons
Accuracy considerations Not calculated Continuous
monitoring of % and unit errors
Recent % errors
Perceived System weaknesses • Switching between levels (e.g. brand, sku x account) is difficult
• Graphs that forecaster would like to use not available
• True sales can’t be recorded when 2 different products offered for price of 1
• Only monthly updates possible
• Impact of sales of related products cannot be analysed
• Need to also refer to paper reports
[image:33.612.82.517.69.579.2]• Tables and graphs cannot be displayed together
7. Appendix B
The following features of commercial supply chain systems that reflect these
requirements, taken from an appraisal of commercial software, The Forecasting Report (Küsters and Bell, 1999)2 are as follows:
1. Preprocessing of data
(a) Annotation (allows user to describe particular data points) (b) Calendar
i) Day, week, month, quarter, year
ii) Trading day adjustments (different ‘months’ or periods include different numbers of basic ‘days’).
2. Product classifications
(a) New products, sporadic (amongst the many products being forecast, some will be new products, some replacements for existing products, some will only
sporadically sell, usually at a low level etc and different methods are often used for these various classifications.)
3. Additional data (a) Prices
(b) Promotion information (c) orders
4. Range of methods 5. Judgemental adjustments 6. Error tracking
(a) Model based (b) Final forecast
(c) Judgmental adjustment 7. Classification keys
(a) Region, customer, ABC (since the accounts into which account managers sell are critical, information is stored on sku sales by account; also products are classified according to their relative importance, see Fildes and Beard (1992))
8. Aggregation across time (while the raw data may be in days, the relevant forecast interval may be in weeks or months)
9. Product hierarchies
(a) Proration (splitting a forecast total downward from a high level of aggregation such as ‘health care’ into its component parts using various rules which forecast the percentage of sales that a particular sku contributes to the total.)
2 No complete list of commercial packages is kept up-to-date but the Forecasting Report (Küsters and Bell,