An Intelligence Approach to Predict Fire Flame Length
under Tunnel Ceiling
Behzad Niknam
PhD student of Department ofMining, Metallurgy, and Petroleum Engineering, Amirkabir University of
Technology, Hafez 424, Tehran 15875-4413, Iran
Kourosh Shahriar
Professor of Department ofMining, Metallurgy and Petroleum Engineering,
Amirkabir University of Technology,
Hafez 424, Tehran 15875-4413, Iran
Hassan Madani
Assistance professor ofDepartment of Mining, Metallurgy and Petroleum
Engineering, Amirkabir University of Technology,
Hafez 424, Tehran 15875-4413, Iran
ABSTRACT
Various analytical models have developed to determine fire flame length under tunnel ceilings during fire emergency based on the regression and dimensional analysis. Artificial intelligence techniques are now being used as an alternate to statistical techniques. In this study, the artificial neural network (ANN) is applied to forecast fire flame length in tunnels. Moreover, particle swarm optimization algorithms were used for ANN training in order to overcome very slow convergence and easy entrapment in a local minimum of back propagation training algorithms. The model predicts flame length using Fire Heat Release Rate, Air velocity, Tunnel Width, Tunnel Height and Tunnel Cross Section. The predictive PSO-ANN model was implemented on the MATLAB and developed based on a database including 44 data sets from large scale fire test programs. The coefficient of determination (R2), the variance account for (VAF) and the root mean square error (RMSE) were calculated to check the prediction performance of the model. The R2, VAF and RMSE indices were obtained as95.884, 99.86% and 1.05.These indices revealed that the developed model is suitable for practical use in tunnels.
Keywords
Fire, large scale fire test, flame length, ANN, PSO.
1.
INTRODUCTION
We ask that authors follow some simple guidelines. In essence, we ask you to make your paper look exactly like this document. The easiest way to do this is simply to download the template, and replace the content with your own material. Tunnel fires are always a challenging task for researchers and tunnel operators due to the potential fire hazard and tremendous loss in terms of human lives and asset damage. When a catastrophic tunnel fire took place in the Holland Tunnel (New York, US) in 1949 in which 66 people were injured, fire authorities began to revise the requirements on fire service systems from time to time. However, tunnel fires continue to occur such as the one, which occurred in Mont Blanc Tunnel in 1999 that resulted in 39 fatalities and 34 injuries and serious damage to the tunnel’s lining up to an extent of 1.2 km [1]. In these fires, the cargo in Heavy Goods Vehicle (HGV) trailers played a major role for the outcome, the main reason being that the trailers contain a very high fire load and thefire could easily spread with the assistance of the ventilation. In all the major tunnel fires mentioned above, at least tenHGVs were involved in the fire together with other
vehicles. The fire started in one or two vehicles and then spread to the other vehicles. This fire spread is very important for the outcome of these fires since the fire becomes large and difficult to attack for the fire fighters. The large fuel load leads to a fire that can burn for a long time [2].
The extended flame under the ceiling in a tunnel is an important factor to consider when studying fire spread and severity. Researchers for fire flame properties prediction have presented a large number of correlations. Wang and Joulain[3] numerically simulated the wind-aided flame propagation over the horizontal surface of liquid fuel in a model tunnel and concluded that there is defined flow velocity which controls flame back propagation .Additionally, high air velocity causes the fire flame to tilt on the surface and enlarge 8 to 9 times versus natural venation. Lavid and Berlad[4]develop a new analytical model to determine the critical air velocity to suppress the back layering flow upstream of the fire section. Putnam [5] studies the fire flame shape with a combination of Froude number preservation and experimental data.
40 be trained with non-linear transfers to approximate and
accurately generalize virtually any smooth, measurable function whilst taking no prior assumptions concerning the data distribution [10]. Although the back propagation (BP) algorithm is commonly used in recent years to perform the training task, some drawbacks are often encountered in the use of this gradient-based method. They include: the training convergence speed which is very slow and easy entrapment in a local minimum. [11] discussed several data-driven optimization training algorithms, such as the Levenberg– Marquardt algorithm and scaled the conjugate gradient algorithm, which may overcome these drawbacks.Rogers [12]used the genetic algorithm for optimal field-scale groundwater remediation together with ANN. Kumar et al. [13] employed the Bayesian regularization for neural network training in order to improve the performance in pulse radar detection. The PSO technique can act as an alternative training algorithm for ANNs that can be used for engineering applications
.
Particle swarm optimization (PSO) algorithm, with the capability to optimize complex numerical functions, is initially developed as a tool for modeling social behavior [14,15]. Moreover, it is recognized as an evolutionary technique under the domain of computational intelligence [15]. In this paper, a PSO-based neural network approach for tunnel fire flame length prediction is developed by adopting PSO to train multilayer perceptions
2.
MULTI-LAYER FEED-FORWARD
PERCEPTRON
The multi-layer feed-forward perceptron represents a non-linear mapping between input vector and output vector through a system of simple interconnected neurons to everyone in the next and previous layer [10]. The output of a neuron is scaled by the connecting weight and fed forward to become an input through a non-linear activation function to the neurons in the next layer of the network. In the course of training, the perceptron is repeatedly presented with the training data. The weights in the network are then adjusted until the errors between the target and the predicted outputs are small enough, or a pre-determined number of epochs are passed. The perceptron is then validated by an input vector not belonging to the training pairs. The training processes of ANN are usually complex and high dimensional problems.
3.
PARTICLE SWARM OPTIMIZATION
(PSO)
Lying somewhere between evolutionary programming and genetic algorithms, PSO is an optimization paradigm that mimics the ability of human societies to process knowledge. It has roots in two main component methodologies: artificial life (such as bird flocking, fish schooling and swarming); and, evolutionary computation [15].
3.1
PSO Algorithm
The principle of the PSO algorithm founded on the assumption that potential solutions will be flown through hyperspace with acceleration towards more optimum solutions. It is a populated search method for optimization of
non-linear functions resembling the movement of organisms in a bird flock or fish school. Candidate solutions to the problem are termed particles or individuals. Instead of employing genetic operators, the evolution of generations of a population of these individuals in such a system is by cooperation and competition among the individuals themselves. In essence, each particle adjusts its flying based on the flying experiences of both itself and its companions. During the process, it keeps track of its coordinates in hyperspace which are associated with its previous best fitness solution, and also of its counterpart corresponding to the overall best value acquired thus far by any other particle in the population.
In the algorithm, vectors are taken as representation of particles since most optimization problems are convenient for such variable presentations. The population is responding to the quality factors of the previous best individual values and the previous best group values. The allocation of responses between the individual and group values ensures a diversity of responses. Its major advantages are the relatively simple and computationally inexpensive coding and its adaptability corresponding to the change of the best group value. The stochastic PSO algorithm has found to be able to find the global optimum with a large probability and high convergence rate [15]. Hence, it adopted to train the multi-layer perceptions’, within which matrices learning problems are dealt with.
3.2
Adaptation to Network Training
A three-layered perceptron is chosen for this application case. Here, W[1] and W[2] represent the connection weight matrix between the input layer and the hidden layer, and that between the hidden layer and the output layer, respectively. When a PSO is employed to train the multi-layer perceptions’, the ith
particle is denoted by:
1 2
,
1
i i i
w
w
w
The position representing the previous best fitness value of any particle is recorded and denoted by:
1 2
,
2
i i i
p
p
p
If, among all the particles in the current population, the index of the best particle is represented by the symbol b,then the best matrix is denoted by:
1 2
,
3
b b b
p
p
p
The velocity of particle i is denoted by:
1 2
,
4
i i i
v
v
v
"
,
,
,
,
5
,
,
j j
i i
j j
i i
j j
b i
v
m n
v
m n
r
p
m n
w
m n
t
s
p
m n
w
m n
And
"6
j j j
i i i
w
w
v t
where j = 1, 2; m = 1,. . . ,Mj; n = 1,. . . ,Nj; Mj and Nj are the
row and column sizes of the matrices W, P, and V; r and s are positive constants; a and b are random numbers in the range from 0 to 1; t is the time step between observations and is often taken as unity; V00 and W00 represent the new values. Eq. (5) is employed to compute the new velocity of the particle based on its previous velocity and the distances of its current position from the best experiences both in its own and as a group. In the context of the social behavior, the cognition part, i.e., the second element on the right hand side of Eq. (5), represents the private thinking of the particle itself whilst the social part, i.e., the third element on the right hand side of Eq.
(5), denotes the collaboration among the particles as a group. Eq. (6) then determines the new position according to the new velocity. The fitness of the ith particle is expressed in terms of
an output mean squared error of the neural networks as follows:
2
1 1
1
=
7
s o
i kl kl i
k l
f w
t
p
w
s
Where f is the fitness value, tkl is the target output; pkl is the
predicted output based on Wi; S is the number of training set
samples; and, O is the number of output neurons.
4.
FIRE FLAME LENGTH (FFL)
PREDICTION USING HYBRID
PSO-BASED ANN
To simulate FFL using hybrid PSO-based ANN, all relevant parameters should be determined, due to the fact that ANNs work based on given data and do not have previous knowledge about the subject of prediction. The following sections describe the input and output parameters and simulation of FFL using the hybrid PSO-based ANN model.
4.1
Input and Output Data
In PSO-based ANN modeling, any type of the input can be used aslong as they have effects on output results. However, the selected parameters have to represent the fire, tunnel and ventilation systems site conditions, be measurable and easy to obtain simultaneously.
The value of FFL in each tunnel fire accident has a direct relationship with the fire characteristic, tunnel geometry and ventilation systems condition. In simple words, FFL is the function of fire heat release rate, fire growth rate, gas temperature, burner diameters, and tunnel height and width and air velocity in the fire upstream. Any changes in these
parameters influence FFL magnitude. For example, according to Ingason,s research [16], rapidly growing fire of trucks produce a peak heat release rate of 200 MW, with maximum flame length of up to about 100 meters. Additionally,
Ingason,s research results showed that the effect of ventilation on the flame length is limited. The heat release rate and the width of the tunnel play two key roles in the flame length in a large tunnel fire.
In order to utilize the PSO-based ANN model to predict FFL, three large scale fire test programs such as the Runehamer tunnel fire test[16], memorial[17] and eureka project[18]were investigated. To train and verify the ability and accuracy of the PSO-based ANN model, a total of 44 FFL records from the fire test were used in this research. In total, five input parameters including, Fire Heat Release Rate (HRR), Air velocity (AV), Tunnel Width (TW), Tunnel Height (TH) and Tunnel Cross Section (TCS) and one output including the measured FFL were used to predict FFL produced by tunnel fires. Table 1 shows the recorded input and output parameters from the large scale fire test.
Table1:Summary of results of the flame length from large scale tunnel fire tests [16,17 and 18]
Runehamar tunnel tests (H=5m, W=7.1m, A=32.1 m2).
Q V Lf Q V Lf
kW m/s m kW m/s m
3000 3 0 80000 2.8 20
…. …. … …. … ….
79000 2.4 22 201890 2.2 88.19
Eureka 499 (H=5.5m, W=6.15m, A=33.8m2).
51000 6.8 10 106000 2.8 30
…. …. … …. … ….
90000 6.8 23
Memorial tunnel tests (H=7,9m, W=8,75m, A=60m2). 50000 1.2 24 100000 2.4 63 50000 2.2 21
4.2. Network Design
42
Fig1:The ANN structure was developed for fire flame length prediction.
5.
RESULT AND DISCUSSION
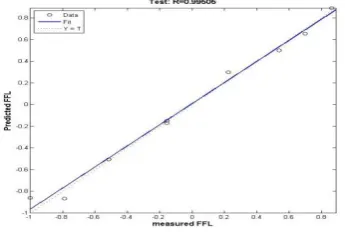
In order to increase the accuracy and applicability of ANN for FFL prediction, the POS algorithm was used for weighting ANN instead of back propagation. PSO-based ANN models were trained and tested using obtained data from a large scale fire test. Performances of the constructed PSO-based ANN model using training and testing datasets are shown in Figs. 2 and 3.As can be seen in these figures, the correlation coefficient for training and testing obtained are 0.95884 and 0.99505, respectively. The predicted FFL fit the measured FFL almost perfectly for testing datasets. Nevertheless, the predicted FFL does not fit perfectly to the measured FFL for training datasets. This might be caused by a chaotic flame length data in that range. Another cause could be that there are some points in the data set which have different flame lengths in similar velocity. In general, it can be said that the proposed PSO-based ANN model is able to predict FFL induced by tunnel fires with a high degree of accuracy. With the aim of evaluating the applicability of the presented model, FFL values were obtained by means of modified Rew and Deaves [19] empirical formulas for the Runehamer fire test (Eq. 8) as well as the proposed PSO-based ANN model for 44 datasets.
0.437.9
8
120000
10
f
Q
u
L
Where Lf is flame length (m),Q fire heat release rate(kw) and
u is the air velocity. Subsequently, a comparison was conducted between the results obtained by the empirical formula and the PSO-based ANN model. Table 2 shows the FFL values predicted by the empirical approach and the proposed PSO-based ANN model.
As can be seen in Table2, the proposed PSO-based ANN model yields better results compared to the Rew and Deaves[19] empirical formula. However, in most cases, the values of FFL predicted by the PSO-based ANN model are much closer to the measured FFL compared to the empirical formula. In addition, in some cases, considerable differences can be seen between the predicted FFL by empirical formula and measured FFL.
Fig2: Normalized values of measured and predicted FFL for training datasets.
Fig3: Normalized values of measured and predicted FFL for testing datasets.
Table2:FFL predicted by Rew and Deaves empirical approach and proposed PSO-based ANN model. Data Measured FFL PSO_ANN Eq 8
1 0 0.000253108 1.533666
….. ….. ….. …..
7 20 19.99991356 9.665309
14 20 19.99931567 26.80186
….. ….. ….. …..
21 40 39.98787592 41.85835
….. ….. ….. …..
27 57.95 57.94938728 60.18971
….. ….. ….. …..
….. ….. ….. …..
[image:4.595.346.519.74.190.2]44 88.19 91.14475612 116.8433 Fig. 4 shows an illustrative comparison between the measured FFL, predicted FFL by PSO-based ANN model, and empirical Eq.(8) proposed by Rew and Deaves. According to the figure, results of Eq. (8) are in the worst agreement with the measured FFL values in some cases. However, the PSO-based ANN model presents a more accurate prediction compared to the empirical equation. It is worth mentioning that similar to other kinds of ANNs, the range of applicability of the proposed PSO-based ANN model is constrained by the data used in the training step.
Furthermore, the variance account for (VAF) (Eq. (9)) and root mean square error (RMSE) (Eq. (10)) indices were calculated to assess the prediction capacity performance of the model [20].VAF is used to investigate to what degree the model can explain the variance in data. In other words, the higher the VAF, the better the model performs. If the actual and predicted values are exactly the same, VAF will be equal to 100%. The RMSE is a measure of the bias in the data and the model performance increases as the RMSE decreases. If the RMSE is 0, then the model will be excellent.
2
1 var
1 100 9
var 1
10
i i
i
N
i i
i
A p
V A F
A
R M S E A p
N
43 Wherevar is used for symbolizing the variance, Ai, the
measured (actual) value, Pi, the predicted value and N is the
number of samples. The VAF and RMSE obtained were 99.86 and 1.05 for the pso_ANN predicted FFL, 75.68 and14.7for the predicted FFL of Eq.8.
6.
CONCLUSION
In this study, a multi-input/output ANN model was developed to predict the fire flame length under the tunnel ceiling during fire emergency. The additional particle swarm optimization model was used for ANN training in order to overcome very slow convergence and easy entrapment in a local minimum of back propagation training algorithms. Fire flame length predictions in the present PSO_ANN model have been computed as a function of Fire Heat Release Rate, Air velocity, Tunnel Width, Tunnel Height and Tunnel Cross Section. The model was trained based on a database including 44 data sets from a large scale fire test in road tunnels using the ANN toolbox of MATLAB.35 data sets out of this data base were used for training and 9 data were used for testing and verifying the adequacy of the trained pso-ANN model. The results of the developed pso_ ANN model were quite satisfactory in terms of R2, VAF and RMSE performance indices. The R2, VAF and RMSE indices were obtained as95.884, 99.86% and 1.05.Hence, it is concluded that the developed pso- ANN model is a suitable and practical technique that can be effectively used in the prediction of fire flame length with minor error.
Fig4:Comparison between predicted FFL by the PSO-based ANN model, Eq. (8) and measured FFL
7.
REFERENCES
[1] Baccard, E., Corvisier, J.M., Gaillardon, D., Schuliar, Y., Vignal, J.M., 1999. Mont-Blanc Road tunnel mass disaster: forensic examination in dangerous surroundings. Journal of Clinical Forensic Medicine 6 (3), 193.
[2] Lönnermark A.2005, On the Characteristics of Fires in Tunnels, Doctoral thesis, Department of Fire Safety Engineering, Lund University, Lund, Sweden,
[3] Wang, H.Y. and Joulain, P.,2007, Numerical simulation of wind-aided flame propagation over horizontal surface of liquid fuel in a model tunnel. Journal of Loss Prevention in the Process Industries, 541–550.
[4] Lavid, M., and Berlad, A. L. 1976.Gravitational effects on chemically reacting boundary layer flows over a horizontal flat plate. In Proceedings of the 16th symposium (international) on combustion(p. 1157). Pittsburgh: The Combustion Institute.
[5] Putnam, A. A. ,1963,. A model study of wind-blown free-burning fires.In Proceedings of the 10th symposium
(international) on combustion (p. 1039). Pittsburgh: The Combustion Institute.
[6] Lonnermark ,A and Ingason,H,2006, Fire Spread and Flame Length in Large-Scale Tunnel Fires. Fire Technology, 42,283–302.
[7] Ingason H., Li Y.Z.2010, Model scale tunnel fire tests with longitudinal ventilation, Fire Safety Journal, , 45,371-384
[8] Ingason H., Li Y.Z.2010, Model scale tunnel fire tests with point extraction ventilation, SP Report 2010:03, SP Technical Research Institute of Sweden, Borås, Sweden, [9] Chau, K.W., Chen, W., 2001. A fifth generation numerical modellingsystem in coastal zone. Applied Mathematical Modelling 25 (10),887–900.
[10]Rumelhart, D.E., Hinton, E., Williams, J., 1986. Learning internal representation by error propagation. Parallel Distributed Processing 1, 318–362.
[11]Haykin, S., 1999. Neural Networks, A Comprehensive Foundation. Prentice Hall, Upper Saddle River
[12]Rogers, L.L., Dowla, F.U., Johnson, V.M., 1995. Optimal field-scale groundwater remediation using neural networks and the genetic algorithm. Environmental Science and Technology 29 (5), 1145– 1155.
[13]Kumar, P., Merchant, S.N., Desai, U.B., 2004. Improving performance in pulse radar detection using Bayesian regularization for neural network training.Digital Signal Processing 14 (5), 438–448. [14]Kennedy, J., 1997. The Particle swarm: Social adaptation
of knowledge. In: Proceedings of the 1997 International Conference on Evolutionary Computation, Indianapolis, pp. 303–308.
[15]Kennedy, J., Eberhart, R., 1995. Particle swarm optimization. In: Proceedings of the 1995 IEEE International Conference on Neural Networks, Perth, pp. 1942–1948.
[16]Ingason H., Li Y.Z.2012. Runehamar Tunnel Fire Tests SP Report 2011:55, SP Technical Research Institute of Sweden, Borås, Sweden,.
[17]Massachusetts Highway Department and Federal Highway Administration, 1995.Memorial Tunnel Fire Ventilation Test Program—Test Report.
[18] French S.E. 1994, EUREKA 499—HGV Fire Test (Nov. 1992)—Summary Report, in Proceedings of the International Conference on Fires in Tunnels, E. Iverson (Ed.), SP Swedish National Testing and Research Institute, Bor˚ as, Sweden ,pp. 63–85
[19]Raw .C and Deaves.D,1999, Fire Spread and Flame Length in Ventilated Tunnels—A Model Used in Channel Tunnel Assessments,” Proceedings of the International Conference on Tunnel Fire sand Escape from Tunnels, Lyon, France, 5–7 May, 1999, pp. 397– 406.