http://dx.doi.org/10.4236/ojgas.2014.44024
How to cite this paper: Monsef, W.A., Mostafa, I. and Zaky, D. (2014) Assessment of the Nutritional Status of the Egyptian Patient with End Stage Liver Disease Prior to Liver Transplantation. Open Journal of Gastroenterology, 4, 159-169. http://dx.doi.org/10.4236/ojgas.2014.44024
Assessment of the Nutritional Status of the
Egyptian Patient with End Stage Liver
Disease Prior to Liver Transplantation
Waheed A. Monsef1, Ibrahim Mostafa2, Doaa Zaky1*1Tropical Medicine Department, Ain Shams University, Cairo, Egypt
2Theodor Bilharz Researh Institute, Gastroenterology and Hepatology Department, Cairo, Egypt
Email: *drdoaazakaria@gmail.com
Received 20 February 2014; revised 23 March 2014; accepted 31 March 2014 Copyright © 2014 by authors and Scientific Research Publishing Inc.
This work is licensed under the Creative Commons Attribution International License (CC BY).
http://creativecommons.org/licenses/by/4.0/
Abstract
Background and Aim: Patients with advanced liver disease have several risk factors to develop nutritional deficiencies. Accurate nutritional assessment is a real challenge because many of the traditionally measured parameters of nutritional status vary with severity of liver disease inde-pendently of nutritional status. The objective of this study was to assess the Egyptian patients with end stage liver disease and to compare different tools used to assess their nutritional status. Pa-tients and Methods: 60 paPa-tients were nutritionally assessed by SGA, RFH-SGA anthropometry, handgrip dynamometry and biochemical tests. Clinical variables were cross analyzed with the nu-tritional assessment methods. Results: Malnutrition ranged from 7% by BMI and 100% by SGA. Agreement among all the methods was low compared with the SGA. Correlation between Malnu-trition prevalence and the severity of liver disease was verified using Child-Pugh score more than MELD score. Conclusion: Malnutrition is highly prevalent among the Egyptian patients with end stage liver disease prior to liver transplantation. Although the diagnosis of nutritional status is not easy among this category of patients, it varied according to the method used. Nutritional support should be an important part of the preoperative care of liver transplantation patients.
Keywords
Liver Transplantation; Nutritionalstatus; SGA; RFH-SGA and MELD
1. Introduction
Hepatic cirrhosis (HC) is characterized by chronic and irreversible change in liver parenchyma, leading to alte-
rations in both liver structure and in the functional capacity of hepatocytes. Together, these changes result in pro- gressive liver function loss, thus affecting nutritional status and body homeostasis in patients with HC to varying degrees. Protein caloric malnutrition (PCM) is highly prevalent in patients with terminal liver disease [1]. Roongpi- sunthinpong et al. suggest that PCM is dependent on its severity regardless of disease cause. However, malnutri- tion is associated with high morbidity and mortality, influencing the short and long term patient survival [2].
Impairment of cellular and humeral immune response in patients with HC may contribute to increased risk for infections [3], decreased quality of life and survival, increased length of hospitalizations and, therefore, increas- ed hospital costs [4].
Malnutrition has been estimated to be present in 65% to 100% of patients with chronic hepatic diseases [5]-[8]. It has also been associated with increased edmorbidity and mortality in patients undergoing liver trans-plantation [4] [7] [9] [10], and the costs of transplant are significantly higher [11]. Thus, the nutritional status of these patients should be assessed early and routinely. However, commonly used methods, such as subjective global assessment, anthropometrics and bioimpedance analysis, are influenced or potentially influenced by the presence of liver disease per se [12] [13].
The subjective global assessment proposed by Detsky et al. [14] has been considered a good approach for subjective assessment of patients with liver disease [15], but water retention complicates its applicability since the estimated weight loss, which is part of this assessment, becomes impaired [16].
Royal Free Hospital-Subjective Global Assessment (RFH-SGA), a more advanced version which combines both subjective and objective parameters for nutritional assessment including measures of BMI calculated from estimated dry weight, MAMC, and details of dietary intake [17].
Although no consensus on parameter has the greatest value in assessing the nutritional state in CLDs [18], anthropometry can be comparable in accuracy to more sophisticated major tools [19]. The SFT has been identi-fied as the most reliable measure that detects the effect of CLDs on nutritional status especially in the presence of ascites and/or edema [20]. SGA, anthropometric measurements and the HGS (handgrip strength) are more commonly used in routine nutritional assessment. However, there is no gold standard method of easy application and low cost, without subjective data and not influenced by the professional who performs it [21].
Thus, it is a challenge to adequately nutritionally assess these individuals, as none of the methods can be con-sidered a gold standard [22].
Given the high prevalence of malnutrition and its relationship with morbidity and mortality in patients with liver cirrhosis as well as the absence of a gold-standard method for nutritional evaluation of these patients, we conducted the present study to assess the Egyptian patient with chronic liver disease patients on the waiting list for liver transplantation using different nutritional assessment tools.
2. Patients and Methods
Sixty patients with liver cirrhosis of different etiologies treated in hepatology department in Ain Shams Univer-sity hospitals and Wady El-Nile Hospital, were evaluated between June 2012 and June 2013, after approval by the Ethics Committee of Ain Shams University. Patients older than 20 yrs. who were on the waiting list for liver transplantation at the time of the study were included. All subjects provided written informed consent
All patients that were included in the liver transplant waiting list presented major complications related to liv-er disease, with highliv-er Meld and Child score at the time of inclusion.
2.1. Clinical Evaluation
Disease severity was classified according to the criteria proposed by Child-Pugh et al. [23], and MELD—the Model for End stage Liver Disease MELD [24]. Complications of cirrhosis, such as presence of ascites and/or edema at the time of evaluation and previous episode of encephalopathy, were also investigated. Due to the var-iation of the score of Child and Meld while on transplant waiting list, the values reported here in represent the values obtained in one given moment at the nutritional evaluation.
2.2. Nutritional Evaluation
Nutritional assessment was always undertaken by one observer as following:
• The subjective global assessment (SGA): The technique of uses clinical information collected during history taking and physical examination to determine nutritional status without recourse to objective measurements. This method of assessment has been successfully used to assess nutritional status in general medical and surgical patients, it shows good to excellent inter observer reproducibility and good convergent validity. The subjective global nutritional assessment (SGA) was carried out according to Detsky [14].
• Royal Free Hospital-Subjective Global Assessment (RFH-SGA): which include both subjective and objec-tive parameters like BMI calculated from estimated dry weight, MAMC, and details of dietary intake. In-takes were categorized as adequate if they met estimated requirements, inadequate if they failed to meet es-timated requirements but exceeded 500 kcal/day, or negligible if they provided fewer than 500 kcal/day. The three variables were incorporated into a semi structured, algorithmic construct, which allocates patients to one of three nutritional categories [17].
2) Anthropometric measurement:
• BW and BMI Before liver transplantation body weight (kg) was always measured after treating ascites and/or water retention with diuretics and/or paracentesis. Dry weight was estimated also considering the amount of the remaining fluid in ascites and edema evaluated clinically and by ultrasonography [25].
• Mid-arm circumference (MAC, cm) was measured at the midpoint between the tip of the acromion and the olecranon process on the non-dominant side of the body by using a flexible tape measure [26].
• Triceps skinfold (TSF) measurement (mm) was determined according to Durmin and Wormersley [27]. All the measurements were taken on the non-dominant side of the body, with the patients standing in a relaxed position, usinga Harpender skinfold caliper (John Bull British Indicators Ltd., St. Albans, UK).
• Mid-arm muscle circumference (MAMC), was calculated using the MAC and the TSF according to standard equations. MAMC = MAC (cm) – [0.314 - TST (cm)] [28].
• Functional methods: handgrip strength was measured by Hand Power Strength Measurement Grip Dyna-mometer which is considered a sensitive marker of body cell mass depletion. Three measurements were made on each arm and an average taken from all measurements.
3) Laboratory determinists:
• Biochemical evaluation included hemoglobin, hematocrit, total lymphocyte count and serum albumin. He-moglobin and hematocrit were compared with reference values for males (14 - 18 g/dl and 40% - 57%, re-spectively) and females (12 - 16 g/dl and 37% - 47%, rere-spectively).Total lymphocyte count values lower and 1500/mm3 for TLC were considered indicative of malnutrition [29]. The cutoff value for albumin was <3.5 g/dl for depletion diagnosis.
4) Statistics:
All data were statistically analyzed through statistical package for social science (SPSS) software version 13.0. Descriptive Data were expressed as number and percentage for categorized data, mean and SD for parametric data and mean, SD and median for laboratory variables. Analytical Data: Paired test: for comparing between 2 dependent means. Mann Whitney U test: for two-group comparisons in nonparametric data. The kappa test was applied to evaluate the extent of agreement between different methods used. For association of liver disease se-verity, nutritional indicators, Pearson’s correlation was used.
Significance Was Evaluated as Follows: P-value: > 0.05 (non-significant). P-value: < 0.05 (significant). P-value: < 0.01 (highly significant).
3. Results
Table 1. Descriptive data of all studied patients.
Parameter Male (No = 44) Female (No = 16) Total
No % No % No %
Age group
• <50 years
• >= 50: < 60 years
• >= 60 years
12 21 11 27.3 47.7 25.0 4 5 7 25.0 31.3 43.7 16 26 18 26.7 43.3 30.0 Occupation
Managerial (high income)
University graduated (high Intermediate income)
Employee (low Intermediate income)
Else House-wife 18 10 6 10 0 41.0 23.0 14.0 23.0 0.0 0 0 1 1 14 0.0 0.0 6.0 6.0 88.0 18 10 7 11 14 30.0 16.7 11.7 18.3 23.3 Residence Urban Rural 19 25 43.2 56.8 7 9 43.8 56.3 26 34 43.3 56.7
Indication for liver transplantation Focal lesion
Viral Viral & HFL Viral & bilharzial
5 24 13 2 11.4 54.5 29.5 4.5 1 15 0 0.0 6.3 93.7 0.0 0.0 6 39 13 2 10.0 65.0 21.7 3.3 Childpugh classification A B C 0 8 36 0.0 18.2 81.8 0.0 3 13 0.0 18.8 81.2 0.0 11 49 0.0 18.3 81.7
MELD Score 18.2 ± 3.43 15.22 ± 4.31 17.42 ± 4.2
81.7% of the enrolled patients confirmed they had decreased appetite, the majority of the patients had ascites and/or edema at the time of assessment (93.3%), and almost half of the patients had had a previous episode of encephalopathy (53.3%). The clinical data of patients according to liver disease are depicted in Table 2.
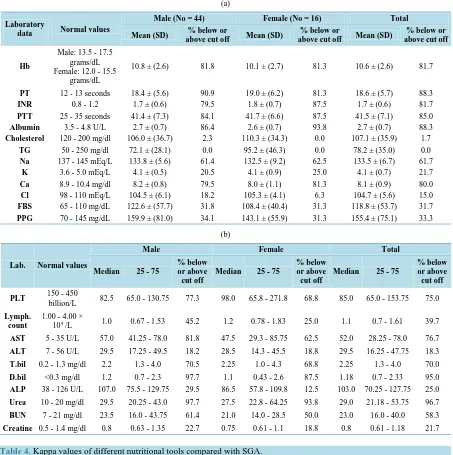
Laboratory assessment if the studied patients revealed that the percentage below and above cut off more fre-quent in Hb, PT, INR, PTT, Albumin, Na and Ca presenting in 81.7%, 88.3%, 81.7%, 85%, 88.3%, 61.7% and 80% respectively. The rest of lab. showed Median, As regard percentage below and above cut off more frequent in PLT, AST, T. bilirubine, D. bilirubine, urea and BUN presenting in 75%, 76.7%, 70%, 95%, 96.7% and 58.3% respectively, laboratory assessments of the patients are reported inTable 3.
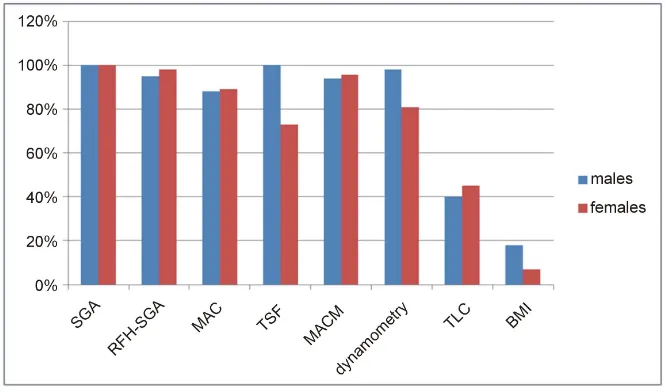
Malnutrition ranged from 7% to 100% according to the different methods investigated. No significant differ-ences were observed in the rates of malnutrition when comparing SGA, dynamometry, albumin and TLC (Figure 1). According to SGA, malnutrition was present in 100% of the patients, and of these, 24 patients (40%) were moderately and 36 (60%) were severely malnourished. The mean BMI was 21.2 ± 5.3 kg/m2, dynamome- try was 30.8 ± 15.4 kgf for males and 22.9 ± 13.4 for females, MAC was 20.6 ± 6.9 cm2.
As for TSF, the median was 8.3 ± 1.8 and TLC median was 1164.0/mm3 (108 – 4416). The percentage of malnutrition according to sex, using the different tools is sown in Figure 1.
Agreement among all the methods, as performed by the kappa test, was low, except for RFH-SGA it showed perfect agreement with SGA (Table 4).
Kappa test, k < 0 = no agreement; 0 < k < 0.19 = poor agreement; 0.2 < k < 0.39 = fair agreement; 0.4 < k < 0.59 = moderate agreement; 0.6 < k < 0.79 = substantial agreement; 0.8 < k < 1.0 = almost perfect agreement.
RFH-SGA, Royal Free Hospital -subjective global assessment; TLC, total lymphocyte count; MAC, midarm circumference; AMA, arm muscle area; TSF, triceps skinfold thickness; BMI, body mass index
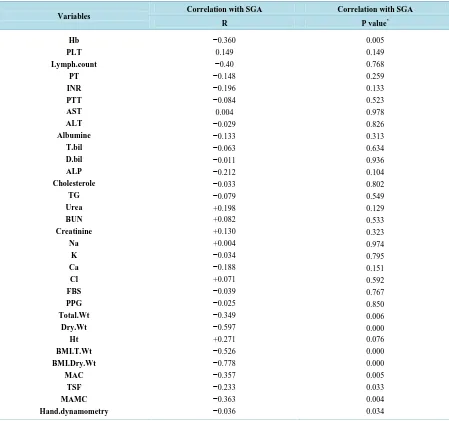
The correlation between laboratory and anthropometric variables & SGA showed that there is no correlation with most laboratory variables (p value > 0.05) except with Hb, there are negative correlation with SGA ( p val-ue <0.05). As regard anthropometric variables, there is negative correlation between most anthropometric va-riables represent in (Total BW, dry BW, BMI total BW, BMI dry BW, MAC, TSF, MAMC and hand dynamo-metery.) & SGA (p value < 0.01) Table 6.
Figure 1. Percentage of malnutrition among male and female patients on the waiting list for liver transplantation according to different nutritional assessment tools SGA, subjective global assessment; RFH-SGA, Royal Free Hospital subjective global assessment; TLC, to-tal lymphocyte count; MAC, midarm circumference; AMA, arm muscle area; TSF, triceps skinfold thickness; SSF, subscapular skinfold thickness; BMI, body mass index.
Table 2.Clinical examination of the patients.
Symptoms & signs Male (No = 44) Female (No = 16) Total
No % No % No %
Decrease of Appetite 36 81.8 13 81.3 49 81.7
Dyspepsia 35 79.5 13 81.3 48 80.0
Nausea 25 56.8 11 68.8 36 60.0
Vomiting 3 6.8 3 18.8 6 10.0
Diarrhea 2 4.5 1 6.3 3 5.0
Constipation 43 97.7 15 93.8 58 96.7
Fever 8 18.2 4 25.0 12 20.0
Jaundice 25 56.8 8 50.0 33 55.0
Hepatic encephalopathy 25 56.8 7 43.7 32 53.3
LL.edema Nil Mild/Minimal Moderate Severe 3 8 19 14 6.8 18.2 43.2 31.8 1 3 7 5 6.3 18.8 43.7 31.2 4 11 26 19 6.7 18.3 43.3 31.7 Ascites
Clinical U/S
[image:5.595.147.480.157.353.2]Table 3.(a):Descriptives of laboratory data of studied patients at Start of Study presented as Mean (+/− SD) (normally distri- buted). (b): Descriptives of laboratory data of studied patients at Start of Study presented as Median (Interquartile Range) (Ab- normally distributed).
(a)
Laboratory
data Normal values
Male (No = 44) Female (No = 16) Total
Mean (SD) % below or
above cut off Mean (SD)
% below or
above cut off Mean (SD)
% below or above cut off
Hb
Male: 13.5 - 17.5 grams/dL Female: 12.0 - 15.5
grams/dL
10.8 ± (2.6) 81.8 10.1 ± (2.7) 81.3 10.6 ± (2.6) 81.7
PT 12 - 13 seconds 18.4 ± (5.6) 90.9 19.0 ± (6.2) 81.3 18.6 ± (5.7) 88.3
INR 0.8 - 1.2 1.7 ± (0.6) 79.5 1.8 ± (0.7) 87.5 1.7 ± (0.6) 81.7
PTT 25 - 35 seconds 41.4 ± (7.3) 84.1 41.7 ± (6.6) 87.5 41.5 ± (7.1) 85.0
Albumin 3.5 - 4.8 U/L 2.7 ± (0.7) 86.4 2.6 ± (0.7) 93.8 2.7 ± (0.7) 88.3
Cholesterol 120 - 200 mg/dl 106.0 ± (36.7) 2.3 110.3 ± (34.3) 0.0 107.1 ± (35.9) 1.7
TG 50 - 250 mg/dl 72.1 ± (28.1) 0.0 95.2 ± (46.3) 0.0 78.2 ± (35.0) 0.0
Na 137 - 145 mEq/L 133.8 ± (5.6) 61.4 132.5 ± (9.2) 62.5 133.5 ± (6.7) 61.7
K 3.6 - 5.0 mEq/L 4.1 ± (0.5) 20.5 4.1 ± (0.9) 25.0 4.1 ± (0.7) 21.7
Ca 8.9 - 10.4 mg/dl 8.2 ± (0.8) 79.5 8.0 ± (1.1) 81.3 8.1 ± (0.9) 80.0
Cl 98 - 110 mEq/L 104.5 ± (6.1) 18.2 105.3 ± (4.1) 6.3 104.7 ± (5.6) 15.0
FBS 65 - 110 mg/dL 122.6 ± (57.7) 31.8 108.4 ± (40.4) 31.3 118.8 ± (53.7) 31.7
PPG 70 - 145 mg/dL 159.9 ± (81.0) 34.1 143.1 ± (55.9) 31.3 155.4 ± (75.1) 33.3
(b)
Lab. Normal values
Male Female Total
Median 25 - 75
% below or above cut off
Median 25 - 75
% below or above cut off
Median 25 - 75
% below or above cut off
PLT 150 - 450
billion/L 82.5 65.0 - 130.75 77.3 98.0 65.8 - 271.8 68.8 85.0 65.0 - 153.75 75.0
Lymph. count
1.00 - 4.00 ×
109 /L 1.0 0.67 - 1.53 45.2 1.2 0.78 - 1.83 25.0 1.1 0.7 - 1.61 39.7
AST 5 - 35 U/L 57.0 41.25 - 78.0 81.8 47.5 29.3 - 85.75 62.5 52.0 28.25 - 78.0 76.7
ALT 7 - 56 U/L 29.5 17.25 - 49.5 18.2 28.5 14.3 - 45.5 18.8 29.5 16.25 - 47.75 18.3
T.bil 0.2 - 1.3 mg/dl 2.2 1.3 - 4.0 70.5 2.25 1.0 - 4.3 68.8 2.25 1.3 - 4.0 70.0
D.bil <0.3 mg/dl 1.2 0.7 - 2.3 97.7 1.1 0.43 - 2.6 87.5 1.18 0.7 - 2.33 95.0
ALP 38 - 126 U/L 107.0 75.5 - 129.75 29.5 86.5 57.8 - 109.8 12.5 103.0 70.25 - 127.75 25.0
Urea 10 - 20 mg/dl 29.5 20.25 - 43.0 97.7 27.5 22.8 - 64.25 93.8 29.0 21.18 - 53.75 96.7
BUN 7 - 21 mg/dl 23.5 16.0 - 43.75 61.4 21.0 14.0 - 28.5 50.0 23.0 16.0 - 40.0 58.3
[image:6.595.87.540.123.578.2]Creatine 0.5 - 1.4 mg/dl 0.8 0.63 - 1.35 22.7 0.75 0.61 - 1.1 18.8 0.8 0.61 - 1.18 21.7
Table 4. Kappa values of different nutritional tools compared with SGA.
RFH-SGA BMI MAC MAMC TSF Dynamometry TLC
Kappa 0.81 −0.01 0.26 0.24 0.19 0.83 0.18
[image:6.595.88.538.651.718.2]Level of agreement perfect No Fair Fair poor substantial poor
Table 5. Pearson’s correlation between nutritional indicators and liver disease severity.
BMI MAC MAMC TS Dynamometry TLC
MELD R-value −0.0039 −0.1143 −0.13872 −0.28618 −0.18248 −0.14836
P-value 0.6572 0.4022 0. 18032 0.0628 0.2415 0.3424
CHILD R-value −0.1039 −0.1043 −0.3872 −0.28618 −0.32785 −0.33717
Table 6. Laboratory & anthropometric variables correlation with SGA among studied patients at start of study.
Variables Correlation with SGA Correlation with SGA
R P value*
Hb PLT Lymph.count PT INR PTT AST ALT Albumine T.bil D.bil ALP Cholesterole TG Urea BUN Creatinine Na K Ca Cl FBS PPG Total.Wt Dry.Wt Ht BMI.T.Wt BMI.Dry.Wt MAC TSF MAMC Hand.dynamometry −0.360 0.149 −0.40 −0.148 −0.196 −0.084 0.004 −0.029 −0.133 −0.063 −0.011 −0.212 −0.033 −0.079 +0.198 +0.082 +0.130 +0.004 −0.034 −0.188 +0.071 −0.039 −0.025 −0.349 −0.597 +0.271 −0.526 −0.778 −0.357 −0.233 −0.363 −0.036 0.005 0.149 0.768 0.259 0.133 0.523 0.978 0.826 0.313 0.634 0.936 0.104 0.802 0.549 0.129 0.533 0.323 0.974 0.795 0.151 0.592 0.767 0.850 0.006 0.000 0.076 0.000 0.000 0.005 0.033 0.004 0.034 *
= Ranked Spearman correlation test.
4. Discussion
For many years, malnutrition has been related to worse clinical outcomes and higher incidence of complications such as ascites, hepatic encephalopathy and infections, hepatorenal syndrome and diabetes mellitus [6]. It is con- sidered a risk factor for morbidity and mortality in short and long term before and after transplantation [30] [31] as well as in abdominal surgery [30] [31]. A recent study by Sam and Nguyen 23 showed the association of PCM with longer hospitalization (8.7 days versus 5.7 days, p < 0.0001), higher in-hospital mortality and a high-er rate of readmissions [30].
In this study, we have been able to show how difficult it can be to diagnose the nutritional status of these pa-tients, because the prevalence of malnutrition ranged from 7% (by BMI) to 100% (by SGA) according to the different methods used [15]. Furthermore our results showed a low agreement rate among methods, as pre-viously described by other authors [34]. We compared the different used nutritional tools with the SGA, the RFH-SGA showed perfect agreement (kappa = 0.81), both MAC and MAMC showed fair agreement, only the BMI showed no agreement at all.
SGA is a practical method for nutritional diagnosis. Its applicability to cirrhotic patients and to liver transplant candidates is valid, since liver disease changes the majority of objective indicators. The choice of SGA as the reference method was made because there is evidence that clinical evaluation is better than anthropometric or biochemical assessments [33]. SGA is recommended by ESPEN as a practical bedside method in assessing un-dernourished patients [35].
The study by Vulcano et al., they found that according to SGA, 46.5% of the patients on the waiting list ` for liver transplantation showed a certain degree of malnutrition, and when weighed against the Child-Pugh criteria, for each unit of increase there is a 2.93 fold chance that the patient is malnourished. The other nutritional indi-cators did not show such strong association with the severity of liver disease [36]. Roongpisunthinpong et al. 2 also reported that SGA correlates with liver disease severity, thus indicating the usefulness of SGA in patients with chronic liver disease [2].
Adopting the SGA as a tool to diagnose malnutrition, revealed that our patients were 100% malnourised at the time of transplantation, this percentage is higher than that found by other authors [36], this may be explained by the late stage of liver disease in our study (all patients were Child class B & C, with average MELD score 17.42 ± 4.2) However, SGA has limitations, such as the fact that some of the parameters evaluated (weight change, functional capacity and presence of ascites and edema) may be because of chronic liver failure and its treatment and may not be related to malnutrition.
Campillo et al. [37] proposed different BMI cut-off values for patients with liver cirrhosis depending on the presence and severity of ascites. Although we used the clinically estimated dry weight to assess the BMI of the patients, the lowest rates of malnutrition among all tools was that diagnosed by BMI in spite of exclusion of the factor of the ascites and lower limb edema. As reported in other study [38] malnutrition was also under diag-nosed when Body Mass Index (BMI) was used, regardless of gender. However, malnutrition was more severe when AC and AMA were measured for females and males respectively. Further studies are needed to investigate if there is any relation between this finding and the high prevalence of obesity in Egypt.
In this study, the loss of muscle mass assessed by MAMC but not the decrease of fat reserve assessed by TSF was associated with severity of disease by Child-Pugh criteria, In study by Merli et al. [39], the reduction in muscle mass in Child-Pugh classes A and B assessed by MAMC was associated with decreased survival, but the depletion of fat did not influence survival in any Child-Pugh class. Nonetheless, techniques that use two com-partments provide inadequate estimation of body composition in patients with cirrhosis, when compared with models that use four body compartments [17]. Alberino et al. [1] also refer a negative correlation between AMA and the Child-Pugh criteria, but not with TSF.
Dynamometry was a more sensible method to diagnose malnutrition in our patients. moroever, this parameter was associated with Child-Pugh classes, but not the MELD, Alvares-da-Silva and Reverbel da Silveira [34] recommended this method to assess nutritional status in the early phases of liver disease. However, the authors imply that dynamometry can lead to increased numbers of false positive diagnoses.
The use of biochemical tests for nutritional assessment in individuals with liver disease is questioned, because it may represent liver dysfunction and does not necessarily represent changes in nutritional status. Some authors use albumin as a nutritional index [2] [40], but Piquet et al. [41] found that the decrease in albumin in patients with cirrhosis is related to liver function and not to nutritional indices. In this study, we couldn’t test the albumin as a nutritional marker as all included patients were Child B&C which means below normal albumin level by default.
Low lymphocyte count was found in the majority of chronic liver disease patients, probably influenced by the presence of infection, electrolyte imbalance, renal failure, metabolic stress, inflammatory bowel diseases or im-munosuppression, conditions observed in patients with liver failure and thus impairing its use as a nutritional in-dicator [36]. TLC showed negative correlation with liver disease severity by Child and MELD, however showed poor agreement in diagnosis of malnutrition by SGA.
inde-pendent of hepatic metabolism, they may be altered in patients with severe portal hypertension and hypersplen-ism as well as in the presence of gastrointestinal hemorrhages. It is noteworthy that laboratory parameters are affected by liver disease severity as well as by the etiological factors of the disease. Hence, they are more strongly correlated with disease severity than with malnutrition per se. further studies are needed to explore the correlation between hemoglobin and the nutritional status of the liver disease patients and the possible causes regardless the liver condition.
Unlike the Child-Pugh score, the MELD score is not associated with the prevalence of malnutrition in regard to the severity of liver disease. The fact that only albumin and TLC were associated with MELD indicates that this parameter is related to the degree of liver failure rather than to malnutrition. In Egypt, since liver transplan-tation priority is based on MELD scores. We might thus assume that those who are transplanted first are not necessarily the more severely malnourished. On the other hand, mortality while on the waiting list might be as-sociated with malnutrition the longer they remain on it. However, to confirm this theory, further studies are needed.
Similar studies proved the same outcome in which nutritional indicators showed higher correlation with the Child-Pugh criteria than with Meld [36]. It is noteworthy that, in the previous version of the Child-Pugh criteria, malnutrition level was considered as an indicator; however, the absence of an accurate tool for nutritional diag-nosis has led to its exclusion. On the other hand, Meld estimation, so far, does not take nutritional status into account. Possibly, according to Stickel et al. [42], this model fails in predicting survival in 15-20% of recipients of liver transplants for not considering the nutritional status.
The methods utilized for the assessment of nutritional status in patients with liver cirrhosis in this study are simple and inexpensive, thus easily utilized in clinical practice. There are, of course, more sophisticated methods for the analysis of body composition, such as bioelectrical impedance analysis, dual-energy X-ray absorptiome-try, K measurement or deuterium concentration, which are only used in special centers, require complex equip-ment and are certainly not as cost effective as the methods previously reported [43].
5. Conclusion
Malnutrition is highly prevalent among the Egyptian patients with end stage liver disease prior to liver trans-plantation. The diagnosis of nutritional status is not easy among this category of patients; it varied according to the method used. The agreement between the different methods is low. Body mass index was less suitable for malnutrition detection. The nutritional indicators that best correlated with the severity criteria proposed by Child-Pugh were, arm muscle circumference, arm muscle area and global assessment of nutritional status.
References
[1] Alberino, F., Gatta, A. and Amodio, P. (2001) Nutrition and Survival in Patients with Liver Cirrhosis. Nutrition, 17, 445-450. http://dx.doi.org/10.1016/S0899-9007(01)00521-4
[2] Roongpisunthinpong, C., Sobhonslidsuk, A., Nantiruj, K. and Songchitsomboon, S. (2001) Nutritional Assessment in Various Stages of Liver Cirrhosis. Nutrition, 17, 761-765. http://dx.doi.org/10.1016/S0899-9007(01)00626-8
[3] Mattos, A.A., Coral, G.P., Menti, E., Valiatti, F. and Kramer, C. (2003) Infecção bacteriana no paciente cirrótico. Arq Gastroenterol, 40, 11-15. http://dx.doi.org/10.1590/S0004-28032003000100003
[4] Pikul, J., Sharpe, M.D., Lowndes, R. and Ghent, C.N. (1994) Degree of Preoperative Malnutrition Is Predictive of Postoperative Morbidity and Mortality in Liver Transplant Recipients. Transplantation, 57, 469-472.
http://dx.doi.org/10.1097/00007890-199402150-00030
[5] Lautz, H.U., Selberg, O., Korber, J., Burger, M. and Muller, M.J. (1992) Protein-Calorie Malnutrition in Liver Cirrhosis. Clinical Investigation, 70, 478. http://dx.doi.org/10.1007/BF00210228
[6] DiCecco, S.R., Wieners, E.J., Wiesner, R.H., Southorn, P.A., Plevak, D.J. and Krom, R.A. (1989) Assessment of Nu-tritional Status of Patients with End-Stage Liver Disease Undergoing Liver Transplantation. Mayo Clinical Process, 64, 95. http://dx.doi.org/10.1016/S0025-6196(12)65308-7
[7] Stephenson, G.R., Moretti, E.W., El-Moalem, H., Clavien, P.A. and Tuttle-Newhall, J.E. (2001) Malnutrition in Liver Transplant Patients: Preoperative Subjective Global Assessment Is Predictive of Outcome after Liver Transplantation. Transplantation, 72, 666. http://dx.doi.org/10.1097/00007890-200108270-00018
[9] Selberg, O., Bottcher, J., Tusch, G., Pichlmayr, R., Henkel, E. and Muller, M.J. (1997) Identification of High- and Low-Risk Patients before Liver Transplantation: A Prospective Cohort Study of Nutritional and Metabolic Parameters in 150 Patients. Hepatology, 25, 652. http://dx.doi.org/10.1002/hep.510250327
[10] Harrison, J., McKiernan, J. and Neuberger, J.M. (1997) A Prospective Study on the Effect of Recipient Nutritional Status on Outcome in Liver Transplantation. Transplant International, 10, 369.
http://dx.doi.org/10.1111/j.1432-2277.1997.tb00931.x
[11] O’Grady, J.G. (1997) Clinical Economics Review: Liver Transplantation. Alimentary Pharmacology & Therapeutics,
11, 445. http://dx.doi.org/10.1046/j.1365-2036.1997.00164.x
[12] McCullough, A.J. (2000) Malnutrition in Liver Disease. Liver Transplantation, 4, S85.
http://dx.doi.org/10.1002/lt.500060516
[13] DiCecco, S.R. and Francisco-Ziller, N. (2006) Nutrition in Alcoholic Liver Disease. Nutrition in Clinical Practice, 21, 245. http://dx.doi.org/10.1177/0115426506021003245
[14] Detsky, A.S., McLaughlin, J.R., Baker, J.P., Johnston, N., Whittaker, S., Mendelson, R.A. and Jeejeebhoy, K.N. (1987) What Is Subjective Global Assessment of Nutritional Status? JPEN, 11, 8-13.
http://dx.doi.org/10.1177/014860718701100108
[15] Barbosa-Silva, M.C.G. and Barros, A.J.D. (2002) Avaliação nutricional subjetiva: Parte 2—Revisão de suas adapta- ções e utilizações nas diversas especialidades clínicas. Arq Gastroenterol, 39, 248-252.
[16] Gottschall, C.A., Álvares-da-Silva, M.R., Camargo, A.C., Burtett, R.M. and Silveira, T.R. (2004) Avaliação nutricional de pacientes com cirrose pelo vírusa da hepatite C: A aplicação da calorimetria indireta. Arq Gastroenterol, 41, 220- 224. http://dx.doi.org/10.1590/S0004-28032004000400004
[17] Morgan, M.Y., Madden, A.M., Soulsby, C.T. and Morris, R.W. (2006) Derivation and Validation of a New Global Me- thod for Assessing Nutritional Status in Patients with Cirrhosis. Hepatology, 44, 823-835.
http://dx.doi.org/10.1002/hep.21358
[18] Teran, F. and McCullough, A. (2001) Nutrition in Liver Diseases. In: Gottshlich, M.M., Ed., American Society for Pa-renteral and Enteral Nutrition, Kendall Hant Publishing Company, St. Louis, 537-552.
[19] Matos, C., Porayko, M.K., Francisco-Ziller, N. and DiCecco, S. (2002) Nutrition and Chronic Liver Disease. Journal of Clinical Gastroenterology, 35, 391-397. http://dx.doi.org/10.1097/00004836-200211000-00007
[20] Loguercco, C., Sava, E., Murmo, R., et al. (1990) Malnutrition in Cirrhotic Patient Anthropometric Measurements as a Method of Assessing Nutritional Status. British Journal of Clinical Nutrition, 3, 98-181.
[21] Teiusanu, A., Anderei, M., Arbanas, T., Nicolaie, U. and Diculescui, M. (2012) Nutritional Status in Cirrhotic Patients. Mædica (Buchar), 7, 284-289.
[22] Barbosa-Silva, M.C. and Barros, A.J. (2005) Bioelectric Impedance and Individual Characteristics as Prognostic Fac- tors for Post-Operative Complications. Clinical Nutrition, 24, 830-838. http://dx.doi.org/10.1016/j.clnu.2005.05.005
[23] Pugh, R.N., Murray-Lyon, I.M., Dawson, J.L., Pietroni, M.C. and Williams, R. (1973) Transection of the Oesophagus for Bleeding Oesophageal Varices. British Journal of Surgery, 60, 646-649. http://dx.doi.org/10.1002/bjs.1800600817
[24] Kamath, P.S., Wiesner, R.H., Malinchoc, M., Kremers, W., Therneau, T.M., Kosberg, C.L.,D’Amico, G., Dickson, E.R. and Ray Kim, W. (2001) A Model to Predict Survival in Patients with End-Stage Liver Disease. Hepatology, 33, 464-470. http://dx.doi.org/10.1053/jhep.2001.22172
[25] Mendenhall, C.L., Moritz, T.E., Roselle, G.A., et al. and VA Cooperative Study Group # 275 (1995) Protein Energy Malnutrition in Severe Alcoholic Hepatitis: Diagnosis and Response to Treatment. Journal of Parenteral and Enteral Nutrition, 19, 258-265. http://dx.doi.org/10.1177/0148607195019004258
[26] Lee, R.D. and Nieman, D.C. (2003) Nutritional Assessment. McGraw Hill, New York.
[27] Durnin, J.W.G.A. and Womersley, J. (1974) Body Fat Assessed from Total Body Density and Its Estimation from Skinfold Thickness: Measurements on 481 Men and Women Aged from 16 to 72 Years. British Journal of Nutrition,
32, 77-97.
[28] Frisancho, A.R. (1984) New Standards of Weight and Body Composition by Frame Size and Height for Assessment of Nutritional Status of Adults and the Elderly. American Journal of Clinical Nutrition, 40, 808-819.
[29] Kondrup, J. (2004) Basic Concepts in Nutrition. In: Sobotka, L., Ed., Basics in Clinical Nutrition, Gale´n, Prague, 1.
[30] Sam, J. and Nguyen, G.C. (2009) Protein-Calorie Malnutrition as a Prognostic Indicator of Mortality among Patients Hospitalized with Cirrhosis and Portal Hypertension. Liver International, 29, 1396-1402.
http://dx.doi.org/10.1111/j.1478-3231.2009.02077.x
[31] Gunsar, F., Riamondo, M.L., Jones, S.,Terreni, N., Wong, C., Patch, D., Sabin, C. and Burroughs, A.K. (2006) Nutritional Status and Prognosis in Cirrhotic Patients. Alimentary Pharmacology & Therapeutics, 24, 563-572.
[32] Zaina, F.E., Parolin, M.B., Lopes, R.W. and Coelho, J.C. (2004) Prevalence of Malnutrition in Liver Transplant Candi- dates. Transplantation Proceedings, 36, 923-925. http://dx.doi.org/10.1016/j.transproceed.2004.04.068
[33] Muller, M.J., Bottcher, J., Selberg, O., Weselmann, S., Böker, K.H., Schwarze, M., von zur Mühlen, A. and Manns, M.P. (1999) Hypermetabolism in Clinically Stable Patients with Liver Cirrhosis. American Journal of Clinical Nutrition,
69, 1194-1201.
[34] Alvares-da-Silva, M.R. and Reverbel da Silveira, T. (2005) Comparison between Handgrip Strength, Subjective Global Assessment, and Prognostic Nutritional Index in Assessing Malnutrition and Predicting Clinical Outcome in Cirrhotic Outpatients. Nutrition, 21, 113-117. http://dx.doi.org/10.1016/j.nut.2004.02.002
[35] Plauth, M., Cabre, E., Riggio, O., et al. (2006) ESPEN Guidelines on Enteral Nutrition: Liver Disease. Clinical Nutrition,
25, 285-294. http://dx.doi.org/10.1016/j.clnu.2006.01.018
[36] Vulcano, D.S.B., de Barros Leite Carvalhaes, M.A. and Bakonyi Neto, A. (2013) Evaluation of Nutritional Indicators and Body Composition in Patients with Advanced Liver Disease Enrolled for Liver Transplantation. Acta Cirúrgica Brasileira, 28, 733-739.
[37] Campillo, B., Richardet, J.P. and Bories, P.N. (2006) Validation of Body Mass Index for the Diagnosis of Malnutrition in Patients with Liver Cirrhosis. Gastroentérologie Clinique et Biologique, 30, 1137-1143.
http://dx.doi.org/10.1016/S0399-8320(06)73491-1
[38] Antaki, F., French, M.M., Moonka, D.K. and Gordon, S.C. (2008) Bioelectrical Impedance Analysis for the Evaluation of Hepatic Fibrosis in Patients with Chronic Hepatitis C Infection.Digestive Diseases and Sciences, 53, 1957-1960.
http://dx.doi.org/10.1007/s10620-007-0071-3
[39] Merli, M., Riggio, O. and Dally, L. (1996) Does Malnutrition Affect Survival in Cirrhosis? PINC (Policentrica Italiana Nutrizione Cirrosi). Hepatology, 23, 1041-1046. http://dx.doi.org/10.1002/hep.510230516
[40] Caly, W.R., Strauss, E., Carrilho, F.J. and Laudanna, A.A. (2003) Different Degrees of Malnutrition and Immunologi- cal Alterations According to the Aetiology of Cirrhosis: A Prospective and Sequential Study. Nutrition Journal, 7, 2. [41] Piquet, M.A., Ollivier, I., Gloro, R., Castel, H., Tiengou, L.E. and Dao T. (2006) Nutritional Indices in Cirrhotic Patients.
Nutrition, 22, 8-9. http://dx.doi.org/10.1016/j.nut.2005.06.004
[42] Stickel, F., Inderbitzin, D. and Condinas, D. (2008) Role of Nutrition in Liver Transplantation for End-Stage Chronic Liver Disease. Nutrition and Clinical Care, 66, 47-54.
[43] Tsiaousi, E.T., Hatzitolios, A.I., Trygonis, S.K. and Savopoulos, C.G. (2008) Malnutrition in End Stage Liver Disease: Recommendations and Nutritional Support. Journal of Gastroenterology and Hepatology, 23, 527-533.
http://dx.doi.org/10.1111/j.1440-1746.2008.05369.x
Abbreviation
SGA: Subjective global assessment