Munich Personal RePEc Archive
Happiness over the life cycle: exploring
age-specific preferences
Lelkes, Orsolya
European Centre, Vienna, LSE, London
20 February 2008
Online at
https://mpra.ub.uni-muenchen.de/7302/
H
APPINESS OVER THE LIFE CYCLE:
EXPLORING AGE-
SPECIFIC PREFERENCES1Orsolya Lelkes
European Centre, Vienna and CASE, LSE, London *
February 2008
Abstract
Existing evidence suggests a U-shaped relationship between age and life satisfaction, when controlling for income and education and other personal characteristics. On the other hand, there is no clear pattern between old age and happiness without the use of controls. Thus, it is not ageing as such, which results declining happiness, but rather the circumstances which are associated with ageing. Which of these circumstances could be averted? Are the preferences of the elderly are similar to others? The paper aims to explore these issues, using the
European Social Survey. The results imply that the varying level of life satisfaction during the life cycle may be explained partly by changing preferences (by the decreasing importance of
work, the increasing importance of religion, and the declining disutility of being single), and
partly by changing circumstances. While changing preferences seem to increase well-being, changing circumstances seem to decrease it. Exceptions are the few positive changes in circumstances, which are likely to contribute to higher well-being, include increasing
religiosity and relatively low pensioners’ poverty across the 21 European countries examined here. Old days thus are happy above all due to changing priorities in life.
Keywords: Life Satisfaction, Age, Preferences.
! " # $ % &' (( )' * +,+
- ' * . / ( % ( 0 #% 0&
Countless different measures suggest that youth is blissful: the young enjoy the highest well-being. On the other hand, there is no uniform pattern for older ages. There is a U-shaped relationship between age and life satisfaction, when controlling for income and education and other personal characteristics, which suggests that the elderly are happier than middle aged people. On the other hand, there is no clear pattern between old age and happiness in a simple bivariate relationship, without the use of controls. This divergence has caused remarkable controversy in the literature.
The implication of this difference is that it is not ageing as such, which results declining happiness, but rather the circumstances which are associated with ageing. Had the elderly not been confronted with these circumstances, they would live a much happier period of their lives than in their middle-ages. In an ageing society the question arises: which of these circumstances could be averted in order to provide high well-being for the old? In order to answer these questions, we also need to explore whether the attitudes and preferences of the elderly are similar to others. The paper aims to provide more evidence on this subject, using cross-sectional cross-country data.
1. Introduction
What makes people happy? The existing results show that although there are certain things that tend to make people more happy in general, including e.g. more income, marriage, good health, there is considerable variation across people. Income, for example, does not make all happy to the same extent, for the religious, it is less of a source of happiness (Lelkes 2006b). People also compare themselves to their past situation, and to the situation of others. Current satisfaction greatly depends on people’s ranks and their relative incomes within the
organization they work in (Luttmer 2005).
The paper aims to explore whether the attitudes and preferences of the elderly are distinct to those of others. Are they affected by circumstances in the same way as other age groups? Do their aspirations differ significantly? Why does happiness increase in old age after a dip in the middle age, once the negative impact of unpleasant life circumstances is eliminated? Which aspects of their lives may be influenced by policy, and which may need to be left for the choice of individuals, however important they might be for the promotion of happiness?
Although the relationship between age and self-happiness appears to be methodologically simple (age being an “exogenous” variable), and has been studied since the beginnings of well-being research, surprisingly, there is considerable controversy between the various findings. The effects, however, are normally found to be small.
Surprisingly, in one of the very first systematic studies on life satisfaction, Cantril (1965) studied 12 nations and found a positive, although small positive impact of old age on life
satisfaction2. Those aged 50 or over were more likely to be satisfied than their younger
counterparts3.
2 3 4 5 1 16 *1 ( ! ' !
16 *1 ( 7 1 ! 8 4 5
1 + +' ( ! ! !
4 * ( ( 5' '
1
92,: ( ;+ ! ' ! 22: ( 9+ <,' 2<: 1 9+
! # ,=;' 2;,& ( 1 '
Some psychologists tend to claim that life satisfaction shows little, or mostly no change at all over the life cycle (Lucas and Gohm 2000, pp. 296-7). Recent work of Mroczek and
colleagues (Mroczek and Kolarz 1998; Mroczek and Spiro 2005), much cited in the
psychology literature, finds a curvilinear relationship, with happiness peaking at age 65. This finding-g, i.e. inverted U-shaped curve, is the reverse of the emerging consensus in the
economic literature. This controversy seems to signal the apparent lack of interaction between these two disciplines (Clark and Oswald 2006).
Recent economics literature, using multivariate analysis, tends to agree on the prevalence of a U-shaped pattern, with happiness reaching the minimum in middle age, controlling for
differences in income, health, and education. (e.g. Oswald 1997; Blanchflower and Oswald 2004; Clark, Etilé et al. 2005; Lelkes 2006b).
The following analysis shows that the age-happiness relationship is rather different in a bivariate and a multivariate setting, in other words, whether additional factors, which also influence this relationship are also considered.
Although age may appear to be a favoured variable to economists, as it is exogenous (people cannot choose their age), the direction of causality is not as obvious as it may seem at first. As the previous theories suggested, age causes differences in SWB. On the other hand, SWB also influences longevity, in other words, those who are happy are more likely to have a longer life (Frijters, Haisken-DeNew and Shields 2005, discussed in the final section).
The first part of the paper presents evidence on life satisfaction and happiness across Europe and its variation by age. The main finding, i.e. that there is a U-shaped relationship between age and subjective well-being, is already widely known among economists, although perhaps less so among followers of other disciplines. The second section aims to explore the reasons of this pattern, and analyses the variation of preferences across the life cycle.
2. Data
The analysis is based on a cross-national dataset, the European Social Survey 2002/2003 (ESS), which contains nationally representative samples of individuals in twenty-two countries. The survey contains information on a wide range of attitudinal and
socio-demographic characteristics. Since the survey design includes strict quality controls, such as random probability sampling, a minimum target response rate of 70% and rigorous translation protocols, we can expect high quality data. The main questions of interest are:
“All things considered, how satisfied are you with your life as a whole nowadays? Please answer using this card, where 0 means extremely dissatisfied and 10 means extremely satisfied”.
“Taken all things together, how happy would you say you are?” Answers are given also on an eleven-point scale, where 0=extremely unhappy, and 10=extremely happy.
The average value of life satisfaction and happiness are both 7, and the means are 8,
indicating that the distribution of responses is left-skewed (see Table A1 in the annex), that the majority of people tend to give relatively high scores.
In applied economics, self-reported life satisfaction and self-reported happiness are both used as measures of utility. These have long been studied by psychologists, and are regarded as two of the numerous measures of subjective well-being. Further, these measures have a high degree of validity, reliability and consistency (see e.g. the review of Diener, Suh et al. 1999). The measures are shown to correlate strongly with other methods of well-being measurement, such as reports of significant others, number of positive and negative events recalled, and clinical interviews (Sandvik, Diener and Seidlitz 1993; Kahneman and Krueger 2006). Others, however, emphasise that individuals’ judgments involve pronounced context effects, thus there is room for methodological concerns (Schwarz and Strack 1999).
This survey is cross-sectional, thus does not allow the separation of life cycle (ageing) and cohort effects. As mentioned before, we do not think it poses a major problem to our analysis, as earlier research, using a single-country panel dataset (Clark 2006) or a multi-country pooled cross-sectional survey with cohort dummies (Blanchflower and Oswald 2007), showed that there is a clear life-cycle effect of happiness.
As that data suggests, the level of life satisfaction varies across countries: on one end stand many East-European countries, Hungary, Poland, the Czech republic and Slovenia in
particular with low levels, while Nordic countries, including Denmark, Finland, Sweden and Norway, but also Switzerland represent the other extreme, with high levels of satisfaction (Figure 1). For this latter group, the average values of self-reported life satisfaction and happiness tend to be very similar. There is greater divergence between life satisfaction and happiness for countries with lower values. The correlation between life satisfaction and happiness in the total sample is 0.7, indicating a strong relationship. In a recent study, Peiró (2006) finds that while happiness is relatively independent of economic factors (e.g. income), satisfaction is strongly dependent.
3. Happiness over the life-cycle: European evidence
The following analysis shows that the age-happiness relationship is rather different in a bivariate and a multivariate setting, in other words, whether additional factors, which also influence this relationship are also considered.
3.1 No clear U-shape in bivariate analysis
The bivariate relationship suggests that happiness declines gradually over age, reaching a minimum among those older than 70, and although life satisfaction increases somewhat in older age, it never reaches the level of the youngest. The graph thus has no resemblance to the U-shaped pattern. There seem to be systematic differences between the two alternative
notions of well-being, i.e. life satisfaction and happiness, despite the fact that these two are often used interchangeably in the empirical literature.
affect balance (defined as the difference between pleasant and unpleasant affect) find that positive affect declines steadily across all age groups from the age of 20 up until the age of 80, while negative affect tends to decline only until the age of 60. These results have been repeated on various samples, including 43 nations (see the review of Lucas and Gohm 2000). This might give an explanation for the declining well-being until the age of 60, and if we assume that happiness is more influenced by positive and negative affects than life
satisfaction, than it can provide support for divergence between life satisfaction and happiness in old age.
Some of the differences in life satisfaction presented in Figure 2 may not be statistically significant, in other words, the group means may differ in the sample population analysed here, but we cannot be certain if that is the case in the original population as well. In order to illustrate this problem, Figure 2 presents not only the mean values (indicated by circles), but also the 95% confidence intervals. For example, average life satisfaction for those between 17 and 29 is estimated to be 7,24, and with a 95% probability this mean value is between 7,19 and 7,30 in the original population. In addition, we also tested whether the differences in mean values of life satisfaction are statistically significant. The t-tests show that the
differences between the mean values of life satisfaction are statistically significant between the age groups 16-29 and 30-39, 30-39 and 40-49, and also 50-59 and 60-69. There is no significant difference in life satisfaction during a longer period in middle age (between 40 and 59) and in old age (from the age of 60 upwards). This suggests that there is indeed a U-shaped pattern between age and life satisfaction, where the young are the most satisfied, and those between the age of 40 and 59 are the least satisfied.
In may not be ageing per se which alters the level of life satisfaction, but other factors related to age groups. In particular, education may play a role, and the lower education level of the elderly may contribute to their lower life satisfaction. Income may also be an explanatory factor. As discussed before, lower income tends to lower life satisfaction, so the lower average income of elderly may also partly explain their lower life satisfaction. Therefore it is important to control for other factors and go beyond the simple presentation of bivariate relationships. These two factors, education and income will be highlighted in the following two charts. The key question is whether controlling for education and income makes the age-satisfaction pattern stronger or weaker. Based on the existing literature, we expect it to become stronger.
Adjustment for differences in education levels presents a more pronounced age pattern, with increasing levels of satisfaction for the groups above 50 (Figure 2). This suggests that the cause of the lower life satisfaction of the older groups may be their lower levels of education.
Adjustment for differences in income (Figure 2) also makes the U-shaped pattern more pronounced. The middle aged group remains to be the least satisfied age group, despite their (probably) highest incomes.
Income and education are not the sole factors which influence life satisfaction, therefore the use of other controls are also essential. In a later section we would explore how the use of other controls influences the relationship between age and life satisfaction.
3.2 Happiness and age: U-shaped relationship in multivariate models
age variable, which does not have any specific a priori assumption about the relationship of age and satisfaction. For comparison, a continuous age variable is also used, together with its quadratic form.
SWB i = f (AGEi, HEALTHi, INCi, EDUi,, EMPi,, MARITALi, CHURCHi, X,i)
where SWBi is satisfaction with life or happiness for individual i, AGEi refers to the age
(expressed in age groups or years) of individual i, HEALTHi indicates health conditions or
self-reported health, INCOMEi, indicates income quintile group, based on annual household
income corrected for household size4, EDUi refers to the educational attainment, EMPi stands
for the labour market status of individual i, MARITALi is a categorical variable showing the
marital status of individual i, CHURCHi is a dummy, taking a value of 1 if the individual is a
regular churchgoer, and Xit stands for other personal characteristics and country fixed effects.
Two sets of alternative regressions are estimated: one of them includes life satisfaction as an explanatory variable, and the other self-reported happiness (Table 1). The right-hand side variables are identical in order to facilitate comparison.
The relationship between age and life satisfaction is U-shaped. The categorical age variables suggest that the minimum is between the age of 40 and 49. With the use of the continuous age variable, the minimum value can be specified: satisfaction is lowest around the age of 45, controlling for country and individual demographic differences, including health (column 5 in Table 1).
Similar to existing evidence, the estimated life satisfaction equations show significant and positive coefficients for marriage, children, higher levels of education and churchgoing, and are increasing in income, ceteris paribus. Health problems, just as separation and divorce, have a negative sign.
The relationship between age and subjective well-being is U-shaped when personal characteristics are controlled for. The coefficients of the younger and older age groups are positive and significant at 1% level compared to the reference group of those aged 40-49. This pattern is equally valid for both measure of subjective well-being: happiness and life
satisfaction. This suggests that although happiness tends to decline with age (as shown by Figure 2), there would not be such difference by age, had the elderly had similar education and incomes as the average population.
Interestingly, this finding holds irrespective of whether we control for differences in health. In other words, the middle-aged groups tend to have lower levels of well-being than the elderly, even when differences in health are not controlled for.
4. Possible explanations: do preferences vary by age?
There are various explanations for the observed relationship between well-being and age.
• Ageing brings greater emotional control, and also lower aspirations (Campbell,
Converse and Rodgers 1976; Lawton 1996). These two might contribute to an increase of subjective well-being with age.
<> 7 ( 1 ?+ ) 7 ( (
• The objective conditions of live tend to worsen with age, thus the old are more likely to experience lower incomes, worse health, or the death of spouse. These
circumstances or events typically lower subjective well-being.
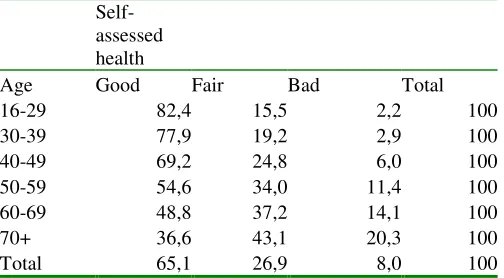
Ageing often brings deteriorating external circumstances. People over the age of 60
increasingly report bad health, and suffer from social isolation or marital dissolution. 1 out of 7 people have no friends with them they could discuss personal matters and social contacts less often than a month among those in their 60s. This ratio increases to 1 out of 6 among those aged 70 and over. This group suffers the most from the death of spouse, with widows making up almost one third of the 70+ age group. Note, however, that they are less hurt by divorce than the middle-aged groups, as the occurrence is not as high.
Contrary to popular belief, the elderly do not tend to be poor in general. As Table 2 shows, poverty among the pensioner age group between 60-69 years is lower than among the general population (smaller percentage belongs to the poorest fifth). The financial situation of those over 70 years, however, is more difficult and they tend to be poor in high numbers.
Country-specific data from other sources suggests that poverty among the elderly (those aged 65 and over) varies between 4% (Czech Republic) and 52% (Cyprus) (Zaidi, Makovec et al. 2006). In nearly half of European Union countries, the elderly seem to be less exposed to the risk of financial poverty than the working age population, largely due to the pension
provisions.
As we aim to understand the U-shaped relationship, including the relative contentment of the elderly, we may formulate the following alternatives:
1. people change preferences, in other words they are feeling less or more happy while experiencing the same things (e.g. they get “wiser”)
2. people change circumstances, in other words the change of circumstances make them less or more happy
3. these two interact: people change circumstances or start doing things which bring
increasing pleasure to them, and stop doing those which are a source of greater
dissatisfaction. Naturally, this presumption makes sense only related to those circumstances which are under the individuals’ control.
Heterogeneity in preferences is an interesting, but relatively novel subject within economics. For example the marginal impact of income on well-being may differ for specific population groups (Clark, Etilé et al. 2005; Di Tella and MacCulloch 2005; Lelkes 2006a; 2006b). It is expected to have an impact on behaviour and in preferences for redistribution.
Two approaches are used: one explores stated preferences or “aspirations”, the other estimates preferences with the help of well-being functions. The key question in both cases is whether preferences vary by age, and if they do, how exactly.
4.1 Stated preferences
The data allows distinction between specific “aspirations”, and suggests that there is some variety in the nature of aspirations during ageing. The survey asks people about the
tend to misjudge what brings them pleasure and therefore tend to invest too much in earning money on the expense of personal relationships.
Leisure is also regarded to be rather important, although with declining importance with age. Religion tends to gain importance over the years.
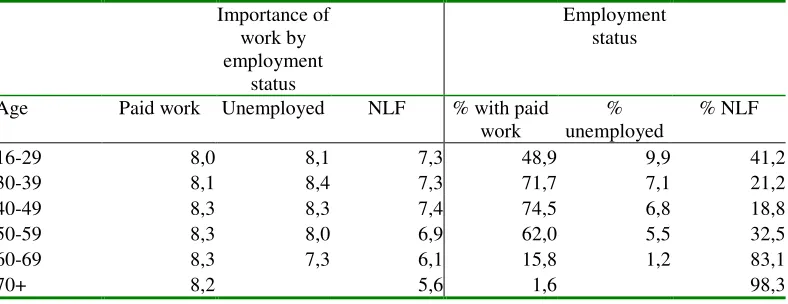
Work is regarded to be rather important (as important as friends) among those who have a paid job, and among the working age unemployed. Work is less important for those who are out of the labour force, either due to child-care, to retirement, or other reasons. The causality is not obvious here. These people may not work, because they do not regard paid work an essential element of their fulfilment, or the other way round, they cannot get a job (e.g. they are “discouraged” long-term unemployed) and they reduce their frustration by believing that it is not important for them.
Overall, ageing seems to change preferences only to a limited extent. Family and friends are very important for people, and remain so over the years . With ageing leisure time loses importance (maybe because it becomes abundant), just as work does, especially among those who do not work any more. This latter suggests lowering aspirations, or rather, a convergence between aspirations and achievements.
The divergence between aspirations and achievements may be a major source of discontent. Attitudes towards paid work may be an example of declining aspirations by age. Labour market issues, in particular individuals’ frustration about joblessness tends to affect the working age population. Job is regarded to be an important aspect of life, and therefore the lack of it “hurts”, as shown by literature on the negative psychological impact of
unemployment. The elderly, however, tend to be less affected by this problem: they are less likely to be on the labour market, and attach smaller importance to it (Table 4). On the other hand, the elderly are more affected by the loss of spouse, and the departure of children, which both influence family life, which is regarded to be extremely important by most people Religion, on the other hand, seems to become more and more important over time including even those who are not churchgoers (!), and it is also reflected in increasing religious
activities (Table 5). How much do these changes in life circumstances affect their well-being?
4.2 Estimated preferences
Age-specific preferences were estimated with the use of the same explanatory variables as presented before (Table 1), and the introduction of an interaction term, interacting age and the specific variable of interest. The following charts (Figure 6-10) indicate the outcome of these regression equations, showing the estimated value of life satisfaction. These results thus show the “pure” relationship between the variables of interest, controlling for a series of other factors.
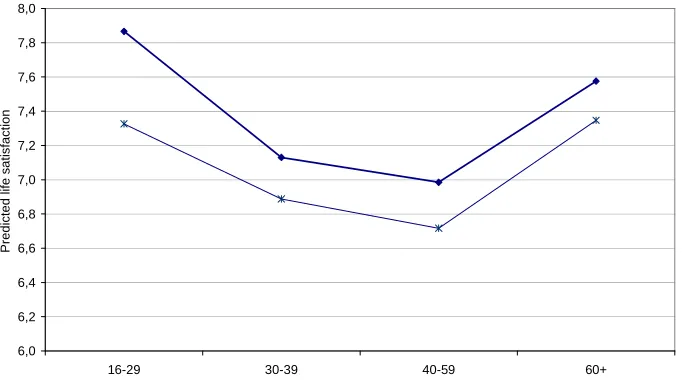
The pattern is less clear among the oldest and in particular among the youngest age groups. Higher levels of education do not seem result higher well-being among those below the age of 30. Studying might be stressful, or simply many of these people have not yet tested “their values” on the labour market. Tertiary education has no outstanding role among those aged 60 or more, these people are not the most satisfied subgroup. This might suggest that knowledge has a positive impact on well-being, but the role of formal education by the end of life lessens above a certain level of qualifications. Life long learning, or self-education may play a major and cumulative role in the acquisition of knowledge and as a result, the appreciation of life. These factors are not observable in this dataset, but could be potentially analysed in depth.
The relationship between age and income seems to be rather homogenous, as shown by Figure 7. In other words, higher income quintile groups tend to be consistently more satisfied in all age groups. The only minor exception is among the youngest age group, many of whom are still participating in full-time education, family incomes and personal incomes may greatly differ, or aspirations may greatly diverge from achievements (actual incomes).
We might define the bottom fifth as the “poor”, as in these countries the level of poverty is normally below this level, using alternative common thresholds. This leads to the conclusion that contrary to the widespread belief, income does have a positive impact on well-being above the poverty level as well (Lane 2000).
On the other hand, the role of income is limited in determining the shape of the function. The young and the old are the most content groups compared to others, irrespective of their levels of incomes. The U-shaped pattern prevails for all income quintile groups.
These calculations are based on household income adjusted for household size, so the incomes “enjoyed” by individuals depend on the incomes of other household members. Studies, which compared alternative income concepts, including personal income, with respect to well-being, found that there is no significant difference between these (e.g. Lelkes 2006).
Note, that the quintiles are defined within the total population, and not within the specific age groups. An alternative option would be to explore this latter, although there is little reason to assume that these age groups function as important reference groups for individuals. Rather, family, friends, colleagues, people with similar qualification, neighbours seem to be important basis for comparison (Clark 2003; Luttmer 2005). In addition, the incomes reflect incomes at one particular point in time, thus do not reveal the impacts of income mobility across the life cycle. Income changes, and the adaptation process are also expected to influence the level of satisfaction (Clark, Frijters and Shields 2007).
Unemployment might be a key factor beyond the relative dissatisfaction of the middle-aged groups. Unemployment affects most who are between 40-49, in the sense that they suffer the biggest drop in their life satisfaction (Figure 8). Unemployment has a negative impact on well-being, but (not surprisingly) only during working age. The elderly thus may enjoy the relative benefit of not having to worry about employment. Interestingly, there is only small difference between the well-being of those in paid work and the inactive. Among the young, the latter group, mostly composed of students, seem to be better off.
Married people tend to be the most satisfied within all age groups. Marriage seems to be a source of joy for many and may cushion against the impact of negative life events. In
married (Stutzer and Frey 2006). The difference in SWB is not attributable to differences in incomes (married people may have more incomes), because we are using household income here, adjusted for household size, and we adjust for differences in incomes.
Separation/divorce “hurts”, although after a period, people tend to adjust and their life satisfaction returns to the baseline level (Clark, Diener et al. 2003). The figure presents current marital status, so those individuals who are divorced are remarried are included in the married group.
Younger widows (between the age of 40 and 59) suffer more, as shown by Figure 95. It may
have two reasons: widowhood hurts less when the partner dies at an older age, or that older widows are widows for longer and had time to accustom to it.
Churchgoing, measured as participating in religious service at least once a month has positive returns to all, but mostly for the young (Figure 10). As mentioned before, nearly 1 in 4 people is regular churchgoer within this group (see Table 5). In this age group churchgoing brings a 0,5 higher score of life satisfaction. In other age groups, the “return” of religiosity is smaller 0,2-0,3. The size of this is similar to moving to the second income quintile from the bottom one.
5. Note on causality: more satisfied individuals live longer
A recent novel study explored whether individuals with higher life satisfaction live longer (Frijters, Haisken-DeNew et al. 2005). In order to qualify the causal effect, 19 years of high quality household panel data, the German Socio-Economic Panel is used.
The raw data suggest that individuals with high life satisfaction tend to live longer. Although there is no significant difference between people with low and high life satisfaction up to the age of 74, above this age those who are less satisfied (i.e. <8 on a 0-10 scale) have a higher probability of death. This relationship, however, may not be causal, as other factors may influence life satisfaction, and thus may cause differences in the hazard of death.
In order, to measure the direct causal impact of life satisfaction on the hazard of death, Frijters et al. developed a special method called “Increasing Mixed Proportional Hazard Model”. This model takes into account a series of socio-economic characteristics, and allows for
unobserved heterogeneity that increases over time due unobserved persistent health-related shocks. Accounting for other personal characteristics, the authors find that more satisfied individuals live longer. The size of the effect is that one point increase in initial life satisfaction reduces the death hazard by 3.1%. This effect, however, is attributable to that more satisfied individuals typically also have a better initial health status. When health satisfaction is included in the model, the parameter estimate on life satisfaction is not statistically significant.
6. Conclusions
There is a U-shaped relationship between age and life satisfaction, when controlling for income and education and other personal characteristics, using a sample of 30000 individuals
from 21 European countries6. There is no U-shape however when controls are not used, suggesting that the lower well-being elderly is to a great extent attributable to their lower education levels, and lower incomes (and to worse health status). Both of these two findings have been repeated already and seem to still cause some controversy in the existing literature.
This paper explores the causes of the variation of well-being across the life cycle. Earlier research concluded that the U-shape is due to life-cycle events, rather than cohort effects (Clark 2006). This paper contributes to this literature, using cross-national evidence and in particular to the relatively novel field within economics, exploring the heterogeneity in preferences (Clark, Etilé et al. 2005; Di Tella and MacCulloch 2005; Lelkes 2006b). Two approaches are used: one explores stated preferences or “aspirations”, the other estimates preferences with the help of well-being functions. The key question in both cases is whether preferences vary by age, and if they do, how exactly.
The survey asks people about the importance of family, friends, leisure time, work and religion in their lives. Family and friends are very important for people, and remain so over the years. With ageing leisure time loses importance, just as work does, but only among those who do not work. Religion appears to gain importance over time, which is also reflected in greater religious involvement of the elderly. Note, however, that the importance of religion increases also among the non-churchgoers, implying a greater role of non-institutional spirituality.
The estimated preference functions finds homogeneity related to income and religion, and heterogeneity related to marital status and education. Religion, income, and marriage as such seems to bring similar positive returns across various age groups, controlling for other
personal characteristics. In other words, these factors make people satisfied to a similar extent independent of their age. Broken marriage and widowhood affects all age groups, but the impact lessens over age. In particular, separation or divorce “hurts” most for those below 30, and widowhood is much less painful for those over 60 then among the younger. These effects seem to be related to the frequency of these events in the relevant age group. Marital break-up and widowhood hurts people particularly if it is an “unexpected”, rare event at their age. Unemployment seems to have the greatest negative impact on those between 40 and 59.
The paper also shows that income is positively correlated to life satisfaction in all five quintile groups, in contrast to claims that income may not matter above the poverty threshold. People do regard family and friends important, and these aspects of their lives are indeed a great source of happiness for them.
In sum, it seems that there is some heterogeneity in preferences across age groups. Thus, the varying level of life satisfaction during the life cycle may be explained partly by changing preferences (for example by the decreasing importance of work, the increasing importance of
religion, and the declining disutility of being single), and partly by changing circumstances.
While changing preferences seem to increase well-being, changing circumstances seem to decrease it. Exceptions are the few positive changes in circumstances, which are likely to contribute to higher well-being, include increasing religiosity and relatively low pensioners’ poverty across the 21 European countries examined here. Old days thus are happy above all due to changing priorities in life. This issue calls for more attention and more research, especially in societies becoming increasingly old.
6
Annex. Descriptive statistics
Table A1. The distribution of self-reported life satisfaction and happiness in European countries
Life
satisfaction Happiness
Frequency Percent Frequency Percent
Extremely
dissatisfied/unhappy 441 1,5 160 0,5
1 289 1,0 149 0,5
2 555 1,9 306 1,0
3 999 3,3 628 2,1
4 1 207 4,0 738 2,5
5 3 103 10,3 2.807 9,4
6 2 405 8,0 2.359 7,9
7 4 922 16,4 5.171 17,3
8 8 058 26,8 8.728 29,1
9 4 652 15,5 5.541 18,5
Extremely
satisfied/happy 3 399 11,3 3.376 11,3
Total 30 030 100,0 29.961 100,0
Mean 7,1 7,4
Median 8,0 8,0
[image:13.595.69.501.440.580.2]Source: ESS 2002/2003, weighted frequencies
Table A2. Education attainment within age groups
Highest level of education
Age
Primary or below
Lower secondary
Upper secondary
Secondary,
non-tertiary Tertiary Total
16-29 8,21 23,83 40,24 11,42 16,3 100
30-39 6,95 20,15 37,23 10,35 25,32 100
40-49 10,48 22,06 35,6 9,24 22,62 100
50-59 17,98 23,79 32,06 6,68 19,49 100
60-69 29,68 22,77 27,06 5,43 15,05 100
70+ 42,3 22,28 21,61 3,51 10,31 100
Total 16,16 22,45 33,77 8,39 19,24 100
Table A3. Income quintile groups within age groups
Income quintile group
Age 1 2 3 4 5Total
16-29 21,46 17,15 19,82 20,51 21,06 100
30-39 18,59 19,21 19,41 20,95 21,84 100
40-49 17,93 17,62 20,26 22,16 22,04 100
50-59 13,77 14,25 18,08 22,99 30,91 100
60-69 15,53 21,91 22,37 20,21 19,98 100
[image:13.595.70.412.633.762.2]Table A4. Self-assessed health in various age groups
Self-assessed health
Age Good Fair Bad Total
16-29 82,4 15,5 2,2 100
30-39 77,9 19,2 2,9 100
40-49 69,2 24,8 6,0 100
50-59 54,6 34,0 11,4 100
60-69 48,8 37,2 14,1 100
70+ 36,6 43,1 20,3 100
Total 65,1 26,9 8,0 100
Table 1. Subjective well-being and age in European countries: OLS regression Dependent variable: Life satisfaction (1) (2) (3) (4) (5)
Age: 16-29 0.490** 0.810** 0.633** 0.709**
(0.040) (0.047) (0.046) (0.047)
Age: 30-39 0.187** 0.247** 0.149** 0.199**
(0.040) (0.039) (0.038) (0.039)
Age: 50-59 0.005 0.002 0.168** 0.085*
(0.041) (0.041) (0.041) (0.041)
Age: 60-69 0.256** 0.414** 0.608** 0.546**
(0.045) (0.049) (0.048) (0.049)
Age: 70+ 0.297** 0.665** 0.973** 0.870**
(0.050) (0.057) (0.056) (0.057)
Age -0.115**
(0.005)
Age-squared/1000 1.227**
(0.052)
Health-Fair -0.757**
(0.029)
Health-Bad -1.840**
(0.048)
Health Hampers a Lot -1.251** -1.245**
(0.056) (0.056)
Health Hampers a Little -0.623** -0.616**
(0.034) (0.034)
Constant 6.760** 5.404** 6.046** 5.686** 8.314**
(0.038) (0.071) (0.070) (0.071) (0.112)
R-squared 0.080 0.135 0.182 0.155 0.157
Dependent variable: Happiness (1) (2) (3) (4)
Age: 16-29 0.354** 0.715** 0.560** 0.637**
(0.035) (0.040) (0.039) (0.040)
Age: 30-39 0.226** 0.283** 0.198** 0.246**
(0.034) (0.034) (0.033) (0.033)
Age: 50-59 -0.020 -0.007 0.138** 0.057
(0.035) (0.036) (0.035) (0.035)
Age: 60-69 0.130** 0.301** 0.472** 0.404**
(0.038) (0.042) (0.041) (0.042)
Age: 70+ 0.062 0.454** 0.724** 0.613**
(0.043) (0.049) (0.048) (0.049)
Health-Fair -0.671**
(0.025)
Health-Bad -1.599**
(0.041)
Health Hampers a Lot -0.956**
(0.048)
Health Hampers a Little -0.488**
(0.029)
Constant 7.120** 5.904** 6.467** 6.123**
(0.033) (0.061) (0.060) (0.061)
R-squared 0.076 0.131 0.181 0.148
bottom income quintile, employee, health=very good, health hampers=no. All regressions include country dummies and personal controls (education, marital status, male, religion). N=29.901
Table 2. Occurrence of negative life situations within a particular age group, %
Ill health Social isolation Marital dissolution
Low income
Age
Self-reported
“bad health”
Infrequent social contacts
Has no
friend Separated Divorced Widowed
Bottom quintile group
Second quintile group
16-29 2,2 3,4 4,6 0,5 0,8 0,1 21,5 17,2
30-39 2,9 6,0 5,3 1,9 5,7 0,6 18,6 19,2
40-49 6,0 8,8 7,6 2,1 9,4 1,4 17,9 17,6
50-59 11,4 10,9 8,7 1,6 10,2 4,7 13,8 14,3
60-69 14,1 13,9 12,6 1,3 7,5 14,1 15,5 21,9
70+ 20,3 17,4 16,1 0,7 3,7 31,3 20,3 27,7
Total 8,0 9,1 8,2 1,4 6,4 6,0 17,97 18,9
[image:16.595.70.373.377.468.2]Source: ESS 2002/3
Table 3. “Aspirations”: Importance of specific things in respondents’ lives
Age Family Friends Leisure time Work Religion
16-29 9,3 8,7 8,1 7,7 4,1
30-39 9,4 8,5 8,0 8,0 4,2
40-49 9,4 8,4 7,9 8,1 4,4
50-59 9,4 8,4 7,9 7,8 4,8
60-69 9,5 8,3 7,7 6,5 5,4
70+ 9,5 8,3 7,4 5,7 6,1
Source: ESS 2002/3
Note: “How important each of these things in your life?” Answers on an eleven-point scale: 1=extremely unimportant, and 10=extremely important.
Table 4. Importance of work by employment status and employment status by age
Importance of work by employment
status
Employment status
Age Paid work Unemployed NLF % with paid
work
% unemployed
% NLF
16-29 8,0 8,1 7,3 48,9 9,9 41,2
30-39 8,1 8,4 7,3 71,7 7,1 21,2
40-49 8,3 8,3 7,4 74,5 6,8 18,8
50-59 8,3 8,0 6,9 62,0 5,5 32,5
60-69 8,3 7,3 6,1 15,8 1,2 83,1
70+ 8,2 5,6 1,6 98,3
Note: NLF= Not in labour force
)8 7 ( 1 !' 1 7 8 ( '
( 1 ' ! 7
* ' 1 7 1 7 ' 2+:
[image:16.595.74.468.544.696.2]Table 5. Importance of family and religion, and related life circumstances
Age Family Religion
Importance of family by marital status
% Married
Importance of religion by churchgoing
Married Widowed Churchgoer Not
churchgoer
% churchgoers
16-29 9,7 19,2 7,4 3,2 23,4
30-39 9,6 9,6 65,2 7,5 3,3 24,0
40-49 9,6 9,6 74,2 7,5 3,5 26,5
50-59 9,6 9,5 77,3 7,9 3,7 27,4
60-69 9,6 9,5 73,4 8,1 4,0 35,4
Figure 1. Happiness and life satisfaction in European countries, 2003
Notes: Very satisfied=scores 8 to 10 on a scale of 0-10
Source: European Social Survey, 2002/2003
Figure 2. Life satisfaction and happiness in specific age groups
Source: European Social Survey, 2002/2003
Notes: Life satisfaction measure: ‘All things considered, how satisfied are you with your life as a whole these days?’ Eleven-point scale: 0=extremely dissatisfied, and 10=extremely satisfied;
Happiness measure: ‘Taken all things together, how happy would you say you are’ Eleven-point scale: 0=extremely unhappy, and 10=extremely happy
6,9 7,0 7,1 7,2 7,3 7,4 7,5 7,6 7,7
16-29 30-39 40-49 50-59 60-69 70+
Age group (years)
A v e ra g e s c o re Happiness Life satisfaction 4 4,5 5 5,5 6 6,5 7 7,5 8 8,5 9
HU PL PT GR CZ FR SI IT DE ES GB IE BE AT NL LU NO SE FI CH DK
A v e ra g e s a ti s fa c ti o n /h a p p in e s s 0 10 20 30 40 50 60 70 80 90 100 S h a re o f v e ry s a ti s fi e d , %
[image:18.595.81.409.408.609.2]Figure 3. Average life satisfaction in specific age groups (mean and confidence interval) U n a d ju s te d M e a n s a n d 9 5 % C I h o w s a ti s fi e d w it h l if e a s a w h o le -- s tf lif e Age group
16-29 30-39 40-49 50-59 60-69 70+
6,8 7 7,2 7,4
Figure 4. Average life satisfaction by age, adjusted for differences in education level
A d ju st e d M e a n s a n d 9 5 % C I h o w s a ti s fie d w it h l if e a s a w h o le -- s tf li fe Age group
16-29 30-39 40-49 50-59 60-69 70+
[image:19.595.73.303.315.465.2]6,8 7 7,2 7,4
Figure 5. Average life satisfaction by age, adjusted for differences in income
A d ju st e d M e a n s a n d 9 5 % C I h o w s a ti s fie d w it h l if e a s a w h o le -- s tf lif e Age group
16-29 30-39 40-49 50-59 60-69 70+
Figure 6. Predicted values of life satisfaction by age and educational attainment
Notes: Estimates are adjusted for differences in income, labour market status, marital status, children at home, health, churchgoing, and country.
The regression includes interaction dummies for education and age group
LIFE SAT i = f (AGEi, EDUi, EDUi*AGEi, HEALTHi, INCi, EMPi,, MARITAL STi, CHILDRENi,
CHURCHi, COUNTRYi,)
Figure 7. Predicted values of life satisfaction by age and income quintile
Notes: Estimates are adjusted for differences in education, labour market status, marital status, children at home, health, churchgoing, and country.
The regression includes interaction dummies for income quintile and age group
LIFE SAT i = f (AGEi, EDUi, INCi, INCi*AGEi, HEALTHi, EMPi,, MARITAL STi, CHILDRENi, CHURCHi,
COUNTRYi,)
6,2 6,4 6,6 6,8 7,0 7,2 7,4 7,6 7,8 8,0
16-29 30-39 40-59 60+
P
re
d
ic
te
d
lif
e
s
a
tis
fa
c
tio
n
primary or below lower secondary upper secondary secondary, non-tertiay tertiary
6 6,2 6,4 6,6 6,8 7 7,2 7,4 7,6 7,8 8 8,2
16-29 30-39 40-59 60+
P
re
d
ic
te
d
l
if
e
s
a
ti
s
fa
c
ti
o
n
[image:20.595.84.445.409.629.2]Figure 8. Predicted values of life satisfaction by age and labour market status
Figure 9. Predicted values of life satisfaction by age and marital status
Figure 10. Predicted values of life satisfaction by age and religion 4,5 5,0 5,5 6,0 6,5 7,0 7,5 8,0 8,5
16-29 30-39 40-59 60+
P re d ic te d l if e s a ti s fa c ti o n
Paid work Unemployed NLF
6,0 6,2 6,4 6,6 6,8 7,0 7,2 7,4 7,6 7,8
16-29 30-39 40-59 60+
P re d ic te d l if e s a ti s fa c ti o n
married separated/divorced widowed never married
6,0 6,2 6,4 6,6 6,8 7,0 7,2 7,4 7,6 7,8 8,0
16-29 30-39 40-59 60+
[image:21.595.70.413.594.787.2]Figure 11. Death hazard by age and initial life satisfaction (smoothed 3-year moving average)
References
Blanchflower, D. G. and A. Oswald (2007). "Is Well-being U-Shaped over the Life Cycle?" NBER Working Paper No. 12935. February 2007.
Blanchflower, D. G. and A. J. Oswald (2004). "Well-being over time in Britain and the USA."
Journal of Public Economics 88: 1359-1386.
Campbell, A., P. E. Converse and W. L. Rodgers (1976). The Quality of American Life. Perceptions, Evaluations, and Satisfaction. New York, Russel Sage Foundation.
Cantril, H. (1965). The Pattern of Human Concerns. New Brunswick, N.J., Rutgers University Press.
Clark, A. E. (2003). "Unemployment as a social norm: psychological evidence from panel
data." Journal of Labor Economics 21(2): 323-351.
Clark, A. E. (2006). "Born to be mild: cohort effects don't explain why well-being is U-shaped in age." PSE Working Paper N 2006-35.
Clark, A. E., E. Diener, Y. Georgellis and R. Lucas (2003). Lags and Leads in Life Satisfaction: A Test of the Baseline Hypothesis, DELTA.
Clark, A. E., F. Etilé, F. Postel-Vinay, C. Senik and K. van der Straeten (2005).
"Heterogeneity in reported well-being: evidence from twelve European countries."
The Economic Journal 115: C118-C132.
Clark, A. E., P. Frijters and M. A. Shields (2007). "Relative income, happiness and utility: an explanation for the Easterlin paradox and other puzzles." Journal of Economic
Literature forthcoming.
Clark, A. E. and A. J. Oswald (2006). "The curved relationship between subjective well-being and age." PSE Working Paper N 2006-29.
Di Tella, R. and R. J. MacCulloch (2005). "Partisan Social Happiness." The Review of
Economic Studies 72(2): 367-393.
Diener, E., E. M. Suh, R. E. Lucas and H. L. Smith (1999). "Subjective well-being: three
decades of progress." Psychological Bulletin 125(2): 276-303.
Frijters, P., J. Haisken-DeNew and M. A. Shields (2005). Socio-economic status, health shocks, life satisfaction and mortality: evidence from an increasing mixed proportional hazard model. Bonn, IZA Discussion Paper No. 1488.
Kahneman, D. and A. B. Krueger (2006). "Developments in the measurement of subjective
well-being " The Journal of Economic Perspectives 20(1): 3-24.
Lane, R. E. (2000). The Loss of Happiness in Market Democracies. New Haven, Yale University Press.
Lawton, M. P. (1996). Quality of life and affect in later life. Handbook of Emotion, Adult Development and Aging. C. Magai and S. H. McFadden. San Diege, CA, Academic
Press: 327-348.
Lelkes, O. (2006a). "Knowing what is good for you. Empirical analysis of personal
preferences and the „objective good"." Journal of Socio-Economics. 35(2. Special
Issue: The Socio-Economics of Happiness): 285-307.
Lelkes, O. (2006b). "Tasting Freedom: Happiness, religion and economic transition." Journal
of Economic Behavior and Organization 59(2): 173-194.
Lucas, R. E. and C. L. Gohm (2000). Age and sex differences in subjective well-being across cultures. Culture and Subjective Well-being. Well-being and quality of life. E. Diener
and E. M. Suh. Cambridge, Mass., MIT Press: viii, 355 p.
Luttmer, E. F. P. (2005). "Neighbors as negatives." Quaterly Journal of Economics 120(3):
963-1002.
Mroczek, D. K. and C. M. Kolarz (1998). "The effect of age on positive and negative effect: a developmental perspective on happiness." Journal of Personality and Social
Mroczek, D. K. and A. Spiro (2005). "Change in life satisfaction during adulthoood: findings from the veterans affairs normative aging study." Journal of Personality and Social
Psychology 88(1): 189-202.
Oswald, A. J. (1997). "Happiness and economic performance." The Economic Journal
107(November): 1815-1831.
Peiró, A. (2006). "Happiness, satisfaction and socio-economic conditions: Some international
evidence." Journal of Socio-Economics 35(2): 348-365.
Sandvik, E., E. Diener and L. Seidlitz (1993). "Subjective well-being - the convergence and
stability of self-report and non-self-report measures." Journal of Personality 61(3):
317-342.
Schwarz, N. and F. Strack (1999). Reports of subjective well-being: judgmental processes and their methodological implications. Well-Being. The Foundations of Hedonic
Psychology. D. Kahneman, E. Diener and N. Schwarz. New York, Russell Sage Foundation.
Stutzer, A. and B. S. Frey (2006). "Does marriage make people happy, or do happy people get
married?" Journal of Socio-Economics 35(2. Special Issue: The Socio-Economics of
Happiness): 326-347.