http://dx.doi.org/10.4236/ojinm.2016.61001
How to cite this paper:Gojaev, E.M., Alieva, Sh.V., Gulmammadov, K.C. and Osmanova, S.S. (2016) Dielectric Properties of Fishbone Kutum and Composite Materials with Its Participation. Open Journal of Inorganic Non-Metallic Materials, 6, 1-5. http://dx.doi.org/10.4236/ojinm.2016.61001
Dielectric Properties of Fishbone Kutum
and Composite Materials with Its
Participation
E. M. Gojaev*, Sh. V. Alieva, K. C. Gulmammadov, S. S. Osmanova
Azerbaijan Technical University, Baku, Azerbaijan
Received 26 October 2015; accepted 4 January 2016; published 7 January 2016 Copyright © 2016 by authors and Scientific Research Publishing Inc.
This work is licensed under the Creative Commons Attribution International License (CC BY).
http://creativecommons.org/licenses/by/4.0/
Abstract
This paper presents the results of studying the frequency dependence of permittivity and dielec-tric loss of fishbone (Fb) Kutum and polyethylene composites filled with nanoparticles fishbone Kutum and the influence of aluminum(Al) nanoparticles with dimensions 80-nm on the dielectric properties of polymer composites. Studies were carried out at the frequency range of 0 - 1 MHz. It was found that the variation of the volume of filler content of fishbone and aluminum nanopar-ticles might be prepared composite materials with the required dielectric parameters.
Keywords
Fishbone, Polymer Composites, the Dielectric Constant, the Dielectric Loss, PE + x vol% (Fb), PE + x vol% (Fb) + 1% Αl
1. Introduction
It is known that the electroactive polymer materials are widely used in various technical fields, in particular in the electret microphone, radiation monitors, pressure sensors, air filters, and electromechanical transducer. Gradually, expanding the scope of application of the modified polymeric composite is of interest to the prepara-tion of such materials with a particular combinaprepara-tion of properties. To modify the properties of polymers, the dispersed fillers are added to the volume of the polymer. After that, the composite material becomes quite dif-ferent electro physically, electret, strength, thermal and other properties [1]-[9]. The properties of the composites are largely determined by, among other parameters, the structural state of the surface and the intensity of inter-molecular interactions between the matrix material and filler material and the size of the nanoparticles. Since the
nanoparticles have a size less than 100 nm, their higher specific surface in comparison with fillers with larger particles allows significantly reduce the degree of filling composite. The transition to organic and nanosized fil-ler, when optimizing the synthesis parameters, allows not only to reduce the specific consumption of this mate-rials, but also to obtain materials with higher performance.
It is known that biological entities are interesting objects of study. The results show that the dielectric con-stant of tissues, cells and animal bones is very high at low frequencies and decreases with increasing frequency. Studies of the frequency dependence of the dielectric constant of objects of biological origin can determine such important physical constants as coefficients of absorption, reflection, refraction, and establish the scope of their practical application [10]-[12]. New materials obtained based on polymers with fillers of biological origin can certainly open up new scientific-practical possibilities. Selection of fish bones in this research is due to the fact that this stuff retains its structure, properties, and resistant to external influences for a long time. Therefore, for the purchase of high quality, stable to external factors, composites are used as filler particles from fish bones. Investigation of the influence of metal nanoparticles and with the change of the composition, size and volume content of the filler and nanoparticles allowed us to obtain new class of nanocomposite materials whose proper-ties could be controlled and improved in the right direction. Thus, the receipt and investigation of the frequency dependence of the dielectric constant and dielectric loss of the composites Al + LDPE + Fb are the undoubted scientific practical interest.
2. Experimental Technique
Composite samples are obtained by mechanical mixing of fishbone Kutum powder with the PE powder in por-celain mortar. The mixing is continued until we have obtained a homogeneous mixture. The mixture is kept for some time at the melting temperature (443 K) of the polymer under pressure of 5 MPa. In the same temperature by compacting the homogeneous mixture and the pressure slowly increases to 15 MPa. At this temperature, the sample is maintained for 5 minutes and then is quickly cooled in water. The sizes of the samples are: thickness is about 80 - 120 × 10−3 mm, diameter of the obtained samples is 35 mm. Provide reliable electric contact between the samples and electrodes made of stainless steel, the electrodes made of thin aluminum foil of thickness 7 × 10⁻³ mm was pressed to both working surfaces of the sample.
Block diagram of the setup is shown in Figure 1. Measurement of ε and tanδ realized with alternating current frequency at 1 kHz. Sample (2) is kept between the two electrodes of the cell for measurement. Then the sample is heated in the cell via the heater (4) that was designed integrated in the laboratory with constant speed 2, 5 K/min. The temperature of sample is registered by the thermocouple (3) by the system that attaches the heater (4). Resistance of the sample is measured by the tera-ohmmeter (5) (Е6 - 13 А), while dielectric constant and di-electric loss measuring by the bridge Е-20. If necessary the temperature of sample is measured by the thermo-meter (6) (M-64). For the power supply of the heater used three-auto-regulated system (7).
Figure 1. Block diagram of the apparatus for measuring temperature dependences of dielectric constant and dielectric losses: 1—measuring cell, 2—sample, 3—thermocouple, 4—heater, 5—immittance meter, 6—thermometer, 7—three-phase auto-regulated system.
1 2
3 4
5
6 7
E8-4
[image:2.595.206.434.512.684.2]3. Results and Discussion
The results of experimental studies of the frequency dependence of the dielectric constant and dielectric loss of fishbone and composites of the PE + x vol% (Fb) and PE + x vol% (Fb) + <Αl> are shown in Figures 2-4.
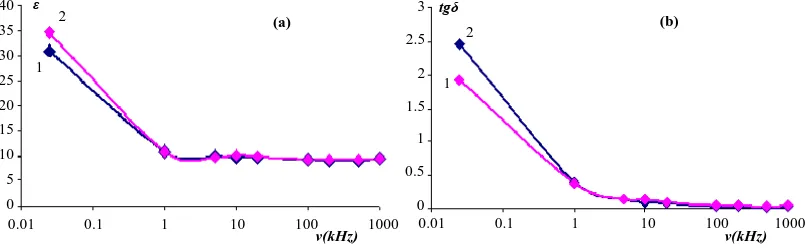
The dependence of the dielectric constant and dielectric loss versus frequency for fish bones (Kutum) are shown in Figure 2. As shown in Figure 2 at very low (0 - 1 kHz) frequencies place a significant decrease of in the dielectric constant from 34.72 to 10.97. In the frequency range 1 - 20 kHz revealed a deep minimum at the frequency of 9.6 and a maximum at the frequency of 10 kHz, and later, with change in the frequency to 103 kHz -ε remains constant. A similar variation of dielectric constant versus frequency detected for the second bone. The minimum is observed at a frequency of 2.8 kHz and a maximum at a frequency 5, 1 kHz. The dependence of the dielectric loss of fish bones were also investigated in the frequency range 0 - 1000 kHz. As follows from
Figure 2(a) at low frequencies for both fishbone is a strong decrease. However, for one of bones at a frequency
[image:3.595.112.515.259.383.2]of 10 kHz is observed variance. In the future, with increasing frequency to 500 kHz comes moderate decrease in dielectric loss. Since the frequency of 500 kHz, an increase in the dielectric loses to 1000 kHz.
[image:3.595.143.486.416.530.2]Figure 2. The dependence of the permittivity (a) and the dielectric loss (b) versus frequency for fishbone Kutum.
Figure 3. The dependence of the dielectric constant (a) and the dielectric loss (b) versus frequency for compo-sites PE + x vol. % fishbone Kutumx = 3, 5, 7.
Figure 4. The dependence of the permittivity (a) and the dielectric loss (b) versus frequency for composites PE + vol. % fishbone Kutum + 1vol% Al, x = 3, 5, 7.
(a) (b)
ε
2
2
0.01 0.1 1 10 100 1000 1
tgδ
v(kHz) v(kHz)
40 35 30 25 20 15 10 5 0 3 2.5 2 1.5 1 0.5 0
0.01 0.1 1 10 100 1000 1
v(kHz) v(kHz)
0.01 0.1 1 10 100 1000 0.01 0.1 1 10 100 1000
ε (a) (b) tgδ 2 0.035 3 2 1 3 0.03 0.025 0.02 0.015 0.01 0.005 0 1 13.5 13 12.5 12 11.5 11 10.5 10 9.5 9 2 3 1 2
v(kHz) v(kHz)
0.01 0.1 1 10 100 1000 0.01 0.1 1 10 100 1000
ε
1
3
(a) tgδ (b)
[image:3.595.142.485.568.696.2]Studies were conducted in the frequency range 0 - 1000 kHz in composites with additions x = 3%, 5%, 7% (Fb). As follows from Figure 3(a) for composite PE + 3 vol% Fb in the investigated frequency range (0 - 20 kHz) dielectric constant decreases from 12.795 to 11.77. In the same frequency band to decrease ε composite additive PE + 5 vol% (Fb) does not change, ranging from 10.66 to 10.64, and for the composite with the addi-tion 7 vol% (Fb) there was a slight decrease from 10.236 to ε 10.175. In the frequency range for all types of 20 - 100 kHz the composites there is a slight increase since for 3 vol% (Fb) from 11.77 to 11.83 to 10.64 5vol% (Fb) to 10.77, while 7 vol% (Fb), 17 to 10.21. In the frequency range of 100 - 200 kHz ε is reduced to about 3 vol% (Fb) 11.83 to 11.79, for a composite 5 vol% (Fb) of 10.77 to 10.64, and the composite of 7 vol% (Fb) from 10.205 to 10.216. Since the frequency of 200 kHz in the range 200 - 1000 kHz, the dielectric constant for all type of composites increases as the composite filled about 3 vol% (Fb) from 11.79 to 12.9 for the composite 5 vol% (Fb) 10.65 to 11.62, and the composite of 7 vol% (Fb) 10.216 to 11.16, respectively (Curve 3).
Results of the study of the frequency dependence of the dielectric loss (tanδ) are shown in Figure 3(b). As the 3b for composite additive 3 vol% (Fb) in the frequency range (0 - 1 kHz), a decrease tanδ, and in the frequency range of 1 - 10 kHz tanδ it is from 0.0055 to 0.007. With a further increase in the frequency of 10 - 100 kHz tanδ it remains practically constant, and in the frequency range of 100 - 500 kHz, a decrease of 0.0056 - 0.0015, in the frequency range 500 - 1000 kHz increase from 0.0015 to 0.003.
For composite PE + 5 vol% (Fb), the frequency dependence tanδ similarly changed. In the frequency range of 0 - 10 kHz is reduced from 0.02 to 0.0035, in the frequency range of 10 - 20 kHz, the dielectric loss (tanδ) in-creases from 0.0035 to 0.0051, and in the frequency range 20 - 100 kHz tanδ remains constant. With further in-crease in the frequency 100 - 500 kHz is reduced from 0.0051 to 0.001, and in the frequency range 500 - 1000 kHz increases from 0.001 to 0.0022. For composite PE + 7 vol% (Fb), the frequency dependence tanδ similarly changed. In the frequency range of 0 - 1 kHz is reduced from 0.0148 to 0.00041, in the frequency range of 1 - 10 kHz, a dielectric loss (tanδ) increases from 0.00041 to 0.0015, and in the frequency range of 10 - 20 kHz is in-creased by tanδ 0.0015 to 0.0045 kHz. In the frequency range 20 - 100 kHz tanδ remains constant. With a fur-ther increase in the frequency of 100 - 500 kHz decreases from 0.0045 to 0.0015, and in the frequency range 500 - 1000kHz increased from 0.00015 to 0,0009.
We investigated the frequency characteristics of the dielectric constant and dielectric loss of nanocomposites with the general formula PE + x vol% (Fb) + <Αl>. Results of the study of the frequency dependence of the di-electric constant of these composites are shown in Figure 4(a). As follows from the composite 3 vol% (Fb) + 1% Αl dielectric permittivity in the frequency range 0 - 500 kHz increased from 10.078 to 10.236, and the range 500 - 1000 kHz ε increases from 10.236 to 11.055 (Curve 1). For a composite with 5 vol% (Fb) + 1% Αl in the fre-quency range 0 - 500 kHz ε increases from 8.54 to 8.68 and a frequency range 500 - 1000 kHz from 8.68 to 10.03 (curve 2). A similar change is observed for the composite with the addition of 7 vol% (Fb) +1% Αl. For this composite in a wide frequency range ε increases slightly from 7.88 to 7.89. In range 500 - 1000 kHz in-creases from 7.89 to 8.6 (curve 3).
Results of the study of the frequency dependence of the dielectric loss of the composites PE + vol% (Fb) + 1% <Αl> are shown in Figure 4(b). As follows from Figure 3(b) for the composite with the addition of 3 vol% (Fb) + 1% Αl in the frequency range 0 - 0.5 kHz tanδ increased from 0.06 to 0.066 0.5 - 2 kHz sharply decreases from 0.066 to 0.005. In the frequency range 2 - 5 kHz increases from 0.0055 to 0.01, 5 - 20 kHz tanδ reduced from 0.01 to 0.009, in the frequency range 20 - 100 kHz slightly increased from 0.009 to 0.0094, and in the fre-quency range 100-tanδ is reduced from 500 kHz to 0.0094, 0.00316, and a frequency range 500 - 1000 kHz in-creased from 0.00316 to 0.026 (curve 1). For the composite with 5 vol% (Fb) + 1% Αl in the frequency range of 0 - 0.5 kHz tanδ increases from 0.04 to 0.045, and in the frequency range 0.5 - 2 kHz sharply decreases from 0.045 to 0.003. In the frequency range 2 - 5 kHz increased from 0.003 to 0.0068, and in the range 5 - 20 kHz tanδ decreases from 0.0068 to 0.005, in the frequency range 20 - 100 kHz slightly increased from 0.005 to 0.0073, and in the frequency range 100 - 500 kHz tanδ decreases from 0.0073 to 0.001, and in the frequency range 500 - 1000 kHz increases from 0.001 to 0.018 (curve 2). For the composite with additives 7 vol% (Fb) + 1% Αl in the frequency range of 0 - 0.5 kHz tanδ increases from 0.0074 to 0.01, and in the frequency range 0.5 - 2 kHz sharply reduced from 0.01 to 0.002. In the frequency range 2 - 5 kHz increases from 0.002 to 0.005, and in the range 5 - 20 kHz tanδ reduced from 0.005 to 0.0035 in the frequency range 20 - 100 kHz slightly increases from 0.0035 to 0.0046 in the frequency range 100 - 500 kHz tanδ decreases from 0.0046 to 0.0002, and in the frequency range 500 - 1000 kHz increases from 0.0002 to 0.016 (curve 3).
(Fb) in the total thickness of the sample, which can be regarded as a resistance connected between the electrodes. Since the particles (Fb) are highly compared with PE conductive, it can be assumed that the resistance of the composite will be mainly determined by the contact between the particles (Fb). At the boundaries of clusters (clusters are surrounded by thin layers of polyethylene, having a low ε in an alternating electric field of the ac-cumulation and redistribution of free electric charges, which distort the original internal electric field. At low frequencies, the internal electric fields are distributed accordingly conductivity. Therefore, the change in dielec-tric parameters frequency increases can be explained by the emergence of a relatively strongly embedded in the filler clusters [12].
4. Conclusion
The researches of the frequency dependence of the dielectric constant and dielectric loss of the composites LDPE + Fb and nanocomposites LDPE + Fb + Al in the frequency range 0 - 1000 kHz revealed that a change in volume content of fish bones and aluminum nanoparticles could determine their optimal parameters, allowing to solve specific technical problems.
References
[1] Shik, A., Rudo, H. and Sargent, E.H. (2000) Photoelectric Phenomena in Polymer-Based Composites. Journal of Ap-plied Physics, 88, 3448-3453. http://dx.doi.org/10.1063/1.1289228
[2] Tashilkov, A.M., Hasanli, Sh.M. and Bayramov, H.B. (2007) The Nonlinear Resistor Composites Based on the Poly-mer-Ceramic. JSF, 77, 127-130.
[3] Aleksandrov, E.L., Lebedev, E.A., Konstantinova, N.N. and Aleshin, A.N. (2010) The Effect of Switching in Compo-site Films Based on a Conjugated Polymer Polyfluorene and Nanoparticulate ZnO. Fiz, 52, 393-396.
[4] Gojayev, E.M., Nabiyev, N.S., Zeynalov, Sh.A. and Osmanov, S. (2013) A Study of Fluorescence Spectra and Dielec-tric Properties of Composites PEHD + x vol TlGaSe2. Electronic Processing of Materials, 3, 14-18.
[5] Yablokov, M.Y., Gilman, A.B. and Ozerin, A.N. (2011) Electronic Properties of Nanocomposite Materials Based on Polypropylene. Nanotechnics, 2, 86-88.
[6] Hippel, A.R. (1960) Dielectrics and Waves. M., K I1I, 351.
[7] Muradyan, V.E., Sokolov, E.A. Babenko, S.D. and Morsevsky, A.P. (2010) The Dielectric Properties of the Compo-sites Modified Carbon Nanostructures, in the Microwave Range. Technical Physics, 80, 83-87.
[8] Gojayev, E.M., Maharramov, A.M., Safarova, S.I., Nuriyev, M.M. and Ragimov, R.S. (2008) The Dielectric Properties of Polymer Composites with a Semiconductor Filler TlInSe2. Electronic Processing of Materials, 44. 66-71.
[9] Tupik, A.B. and Garmashov, S.I. (2011) Dielectric Loss in Statistical Mixtures. FTT, 53, 1129-1132.
[10] Shrivastava, B.D., Barde, R., Mishra, A. and Phadke, S. (2014) Dielectric Behavior of Biomaterials at Different Fre-quencies on Room Temperature International Conference on Recent Trends in Physics (ICRTP 2014). Journal of Physics: Conference Series, 534, Article ID: 012063. http://dx.doi.org/10.1088/1742-6596/534/1/012063
[11] Rizhenkov, A.V., Klassen, N.V. and Masalit, V.M. (2013) Features of the Structure and Properties of Composites of Biopolymers with Inorganic Nanoparticles. Science and Technology of Materials, 53.