http://dx.doi.org/10.4236/ijaa.2016.61003
North-South Asymmetry of the
Interplanetary Magnetic Field
Magnitude and the Geomagnetic Indices
Mohammed Ali El-Borie1, Ali Abdel-Moniem Abdel-Halim2, Shady Yousry El-Monier2 1Physics Department, Faculty of Science, Alexandria University, Alexandria, Egypt2Arab Academy for Science & Technology and Maritime Transport, Alexandria, Egypt
Received 23 November 2015; accepted 13 March 2016; published 16 March 2016
Copyright © 2016 by authors and Scientific Research Publishing Inc.
This work is licensed under the Creative Commons Attribution International License (CC BY).
http://creativecommons.org/licenses/by/4.0/
Abstract
Data of the daily interplanetary magnetic field (IMF), and the geomagnetic indices (aa, Ap, Kp, and DST) have been used to examine the asymmetry between the solar field north and south of the he-liospheric current sheet, over the period (1975-2013). It important to note that during the posi-tive polarity epochs: (T) refers to Toward the South of the heliospheric current sheet (Southern Hemisphere), and (A) refers to Away from North of the heliospheric current sheet (Northern He-misphere). While, during the negative polarity epochs the opposite will be happened. The present study finds no clear indication of the presence of north-south asymmetry in the field magnitude, and also there is no magnetic solar cycle dependence that is evident. During the considered period, the north-south asymmetry for the considered parameters reaches maximum values around the declining phase or near to the minimum of the solar cycle. The geomagnetic indices have a clear asymmetry during the positive solar magnetic polarity period (qA > 0) and have a northern do-minance during cycles (22 & 23) and southern dodo-minance during cycles (21 & 24). From the pow-er spectrum density, the considpow-ered parametpow-ers showed significant peaks which appeared in the north-south asymmetry but the 10.7 yr solar cycle was absent. In addition, the main periodicity of the asymmetry may be 5.2, 4.0 and 3.3 years that exist in the parameters with higher confidence levels. Finally, one can conclude that the asymmetry of the interplanetary parameters and the geomagnetic indices may provide multiple causes for producing the observed asymmetric mod-ulations of cosmic rays.
Keywords
1. Introduction
It is well established that our Sun is a fairly typical star, nothing more than one of the variable stars of the un-iverse. The Sun expels several products of its activity in the interplanetary medium, namely electromagnetic radiation, energetic particles, solar wind and transient ejections within their magnetic fields. The solar magnetic field is frozen in the solar plasma and carried outward by the solar wind. When the Sun rotates, the field at equatorial latitudes forms a spiral structure. In addition, a solar neutral sheet results from this structure, main-taining a separation between northern and southern regions. This averaged warped heliospheric current sheet (HCS) separates regions with opposite polarities of the magnetic field. The structure of the HCS changes sub-stantially during the 11-year sunspot cycle [1], with a relatively flat sheet at the solar minima years, but neutral sheet waves extend up to 70˚ heliolatitude at solar maxima epochs. Furthermore, the solar field polarity reverses at each solar maximum giving rise to a 22-year periodicity in the heliomagnetic field. The Earth responds to so-lar variability through geomagnetic activity, variations of the high atmosphere and possible changes of weather, climate and biota.
Recently, the north-south asymmetry of the interplanetary plasma and the solar parameters has been the sub-ject of many studies and has been discussed by several authors [2]-[12]. Waldmeier [2] studied the N-S asym-metry of most outstanding feature of solar parameters from 1959 to 1969 and said that the spots, faculae were more numerous and the white light coronal was brighter on the northern hemisphere than on the southern one. Beiber [3] indicated that the N-S asymmetry in many parameters related to the interplanetary medium. Beside that Sanaikumaran and Prabhakaran [9] examined the N-S asymmetry for IMF, Ap, and SWS during the four solar cycles (20 - 23) and they found that the phase of the asymmetry of IMF reversed every cycle, and the asymmetry of the Ap index appeared similar to that of solar wind velocity and may be due to the existence of a relic magnetic field in the solar convection zone. From the other side, the authors [13]-[15] studied the periodic-ity for the N-S asymmetry and they found a periodic 1.3yr enhancement in solar wind speed from 1987-1995. In addition a similar significant peak was observed in the geomagnetic index (Ap). EL-Borie [8] showed that the solar plasma was denser and cooler south of the HCS than its north during the period 1981-1989 (qA < 0; nega-tive solar polarity), and said that the solar flux components of the toward field vector was larger in magnitude than those of away field vector during qA < 0, and no asymmetry was observed in qA > 0 epoch. In addition, El-Borie [10] discussed the N-S asymmetry for interplanetary medium solar, and geomagnetic indices from 1970-2010 and found that the sign of the average asymmetry depended upon the solar magnetic polarity where the annual magnitudes of N-S asymmetry depended positively on the solar magnetic cycle.
The objective of this work is to examine the N-S asymmetry in the field magnitude (B), and the geomagnetic parameters (aa, Ap, Kp, and DST) according to the interplanetary magnetic field (IMF) sense over the period 1975-2013.
2. Data Analysis
Daily data have been used for the geomagnetic indices (aa, Ap, Kp, and DST) and the IMF magnitude (B) throughout the period (1975-2013) that covered three and a half solar cycles. Data for the geomagnetic indices are available via the national geophysical data center (NGDC). In addition, data for the IMF magnitude B can be downloaded via http://omniweb.gsfc.nasa.gov/form/dx1.html.
Series of power spectral density (PSD) have been performed. Fast Fourier Transformations (FFT) has been used to yield the power spectral density (PSD). The results were smoothed using the Hanning window function. This is necessary since most of the disturbed features will completely disappear, while the significant peaks are clearly defined. Nevertheless, the particular window chosen doesn’t shift the positions of the spectral peaks. Next, each spectrum is independently normalized to the largest peak in the complete spectrum. This restriction was chosen in order to avoid spurious strengths often associated with peaks near the start and end of the data set. This normalization didn’t introduce any errors in our identification of the peaks because it changes only the rela-tive amplitude and not the position of the peak spectrum.
3. Results and Discussion
The Sun is continuously ejecting large quantities of charged particles (atoms stripped of their electrons) into space. Some of these particles eventually arrive to the Earth and interact with the Earth’s geomagnetic field. So, the interplanetary medium and the terrestrial magnetic field respond to most of solar parameters and their evolu-tion, and any change for activity of these solar parameters between the northern and southern hemispheres may reflect another change on the interplanetary parameters and the geomagnetic indices. Studies by Rangarajan [16] revealed that the sun’s northern hemisphere is, almost always, geomagnetically more active, on the average of about 20%, than the southern hemisphere. This enhancement activity may be attributed to the inverse relation-ship between the geomagnetic activity and the strength of the magnetic field. High cosmic ray solar diurnal am-plitudes coincide with the increase in IMF magnitude B, during the descending phase of the solar cycles [17] [18]. This may be due to the large values of upper cutoff rigidity during this period [19].
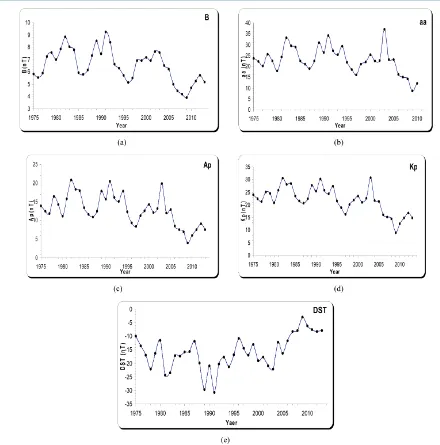
Figure 1 represents the time series of the annual averages for the field magnitude (B) and the geomagnetic indices (aa, Ap, Kp, and DST). The behavior of the field magnitude B (plot 1a) is nearly the same to the beha-vior of the geomagnetic parameters aa, Ap, and Kp (plot 1b to 1d). They have higher peaks on (1982, 1989, and 1991) years, beside that (aa, Ap, and Kp) have a another higher peak on 2003. Plots (1a to 1d) have an irregular pattern and two maxima are observed (double peak modulation), one near the maximum solar activity period and the other in the descending phase [20] [21]. It is believed that the first peak is caused by coronal mass ejec-tions, whereas the second peak is caused by geomagnetic disturbances due to the coronal-hole fast streams, which are more frequent in this part of each solar cycle [22]. In some cycles they have three peaks structure, the first peak before or in solar maximum and the other two in the descending phase of solar activity cycle. From the other side the Disturbance Storm-Time Index DST (plot 1e) reflects an opposite behavior for the field magnitude (B) and the geomagnetic index (aa, Ap, and Kp) where its values have been in negative (i.e., the reference level for the DST is set to be statistically zero on internationally designated quiet days and −50 nT or deeper to indi-cate a storm-level disturbance). So it can explain what happen in years (1989 and 1991) where DST has a higher negative value than the other parameters.
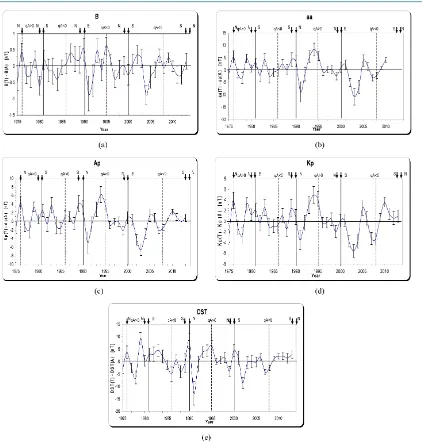
It may be useful to compare the north-south asymmetry in IMF magnitude and the geomagnetic indices over the period 1975-2013. Figure 2 displays the yearly difference variations of the field magnitude B, and the geo-magnetic indices (aa, Ap, Kp, and DST) between Toward and Away days for both positive and negative polarity epochs. The estimated error is shown for each year, and for each parameter. Times of the magnetic-field reversal at the Sun's north (N) and south (S) poles are added at the top of the figure. In addition, the position for the solar maxima and the solar minima can be shown as a vertical (solid line and dotted line, respectively). It is interest-ing to note that the toward sectors occur north of the current sheet durinterest-ing the negative solar polarity and south of the current sheet during the positive polarity, and reverse happen for the away sectors.
The first plot (Plot 2a) shows the field magnitude B has eight clear positive asymmetry with toward values higher than the away values occurred in (1976, 1987, 1990, 1993, 1995, 2002, 2007 and 2009). The maximum positive asymmetry happened in the year 1995 with a magnitude (0.625 ± 0.3 nT). In addition, there are 7 nega-tive asymmetries showed in (1975, 1980, 1984, 1991, 1997, 2004 and 2011) with largest neganega-tive asymmetry in
year 1991 (−0.837 ± 0.5 nT), and in year 2004 (−0.885 ± 0.3 nT) which occurred during the second negative
polarity (2001 to the present). Moreover, the largest peaks of the asymmetry appeared around the decline phase of the solar cycle.
Figure 1. The annual averages for the interplanetary magnetic field (IMF) and the geomagnetic indices aa, Ap, Kp, AE, and DST) during the 1975-2013 period.
Table 1.The average values of the North-South asymmetry for the field magnitude and the geomagnetic parameters during the +ve & −ve IMF polarity cycle for cycle 21.
Solar cycle 21 (June 1976-Sep 1986)
IMF & geomagnetic
parameters
Positive polarity (1976-1978) Negative polarity (1981-1986)
Toward days Away days T-A Toward days Away days T’-A’
No. of
Days Average No. of Days Average Average No. of Days average No. of Days average Average
[image:4.595.89.538.589.720.2]Figure 2. Comparison of yearly difference of north-south asymmetries in the field magnitude B, and the geomagnetic para-meters (aa, Ap, Kp, AE, and DST) over the time interval from 1975 to 2013.
Table 2. The average values of the North-South asymmetry for the field magnitude and the geomagnetic parameters during the +ve & −ve IMF polarity cycle for cycle 22.
Solar cycle 22 (Sep 1986-May 1996)
IMF & geomagnetic
parameters
Positive polarity (1991-1996) Negative polarity (1986-1988)
Toward days Away days T-A Toward days Away days T’-A’
No. of
Days Average No. of Days Average Average No. of Days average No. of Days average Average
[image:5.595.90.536.583.720.2]Table 3. The average values of the North-South asymmetry for the field magnitude and the geomagnetic parameters during the −ve IMF polarity cycle for cycle 23.
Solar cycle 23 ( May 1996-Jan 2008)
IMF & geomagnetic
parameters
Positive polarity (1996-1998) Negative polarity (2001-2008)
Toward days Away days T-A Toward days Away days T’-A’
No. of
Days Average No. of Days Average Average No. of Days average No. of Days average Average
[image:6.595.93.537.300.441.2]IMF (nT) 387 5.88 ± 0.5 438 5.89 ± 0.5 −0.01 ± 0.6 1127 6.27 ± 0.5 1192 6.23 ± 0.5 0.04 ± 0.7 aa 387 17.26 ± 1.4 438 18.5 ± 1.5 −1.24 ± 2 1127 21.37 ± 2.1 1192 23.43 ± 3.1 −2.06 ± 3.5 Ap 387 8.75 ± 0.8 438 9.76 ± 0.8 −1.01 ± 1.3 1127 11.26 ± 1.2 1192 12.87 ± 1.8 −1.6 ± 2.2 Kp 387 17.47 ± 1.3 438 18.57 ± 1.3 −1.11 ± 1.7 1127 20.44 ± 1.7 1192 21.93 ± 2 −1.49 ± 2.6 DST 387 13.74 ± 1.5 438 13.51 ± 1 0.23 ± 1.8 1127 14.18 ± 1.7 1192 15.59 ± 2 −1.41 ± 2.6
Table 4.The average values of the North-South asymmetry for the field magnitude and the geomagnetic parametersduring the −ve IMF polarity cycle for cycle 24.
Solar cycle 24 ( Jan 2008-present)
IMF & geomagnetic
parameters
Negative polarity (2008-2012)
Toward days Away days T’-A’
No. of Days Average No. of Days Average Average
IMF (nT) 908 4.71 ± 0.3 657 4.74 ± 0.4 −0.03 ± 0.5
aa 908 12.25 ± 1.5 657 11.40 ± 2.3 0.85 ± 2.7
Ap 908 6.9 ± 0.8 657 6.43 ± 1 0.47 ± 1.1
Kp 908 13.95 ± 1.3 657 13.36 ± 1.6 0.6 ± 2
DST 908 7.17 ± 0.9 657 6.26 ± 1.1 0.91 ± 1.4
From these tables, one can note that the grand average differences of the field magnitude north and south of
the HCS are −0.03 ± 0.7 nT, −0.20 ± 0.8 nT, and −0.01 ± 0.6 nT for qA > 0 epochs during the three solar cycles
21, 22, and 23, respectively, as well as −0.16 ± 0.7 nT, 0.28 ± 0.5nT, 0.04 ± 0.7nT, and −0.03 ± 0.5 nT for qA < 0 epochs during cycles 21, 22, 23 and 24, respectively, which means that there is no remarkable N-S asymmetry in the averaged field magnitude over the former epochs and there is no magnetic solar cycle dependence is evi-dent.
On the other side, plot 2c for the geomagnetic index (Ap) (by taking the error bar into account) shows 19 years out of 39 years with N-S asymmetry. Ten of them have a positive asymmetry and occurred in 1976, 1979, 1981, 1983, 1989, 1990, 1993, 1994, 1995 and 2010. In contrast, nine clear negative asymmetries happened in 1978, 1985, 1991, 1999, 2002, 2003, 2004, 2007 and 2008. The largest positive asymmetry placed in 1994 (6.24
± 1.9) near to the minimum of the solar cycle, and the largest negative asymmetry placed in 2003 (−6.58 ± 1.4)
in the descending phase of the solar cycle 23.
1995, 2000, 2010, 2011 and 2013) with positive asymmetry. The largest positive asymmetry obtained in 1979
(9.34 ± 2.3), and the largest negative asymmetry obtained in 1991 (−12.71 ± 4.8). By looking at the results on the fourth tables, one can see that the average values of the N-S asymmetry for DST index reach to their maxi-mum value during the first positive magnetic polarity epoch (1976-1978) throughout cycle 21 with a magnitude
−3.39 ± 3.4. Furthermore, the significance of the asymmetry changes automatically every solar magnetic polari-ty cycle (qA > 0 or qA < 0) as shown in the considered tables. So the asymmetry has a southern dominance during cycles 22 and 23 and northern asymmetry during cycles 21 and 24, which means that it has the same be-havior for the previous geomagnetic indices. The results shown in plot 2a for the field magnitude B are qualita-tively consistent with those observed in plots 2b to 2e, which mean that the asymmetry that observed in the in-terplanetary parameters reflect another asymmetry in the geomagnetic indices, and the two asymmetries may provide multiple causes for producing the observed asymmetric modulations of cosmic rays.
Series of power spectrum density (PSD) have been performed on the yearly difference variations of the IMF field magnitude (B), and the geomagnetic index (Ap, and DST) between the positive and the negative polarity days (i.e., Toward and Away days). The power spectrum density (PSD) is calculated for a wide frequency range (0.0937 - 0.5 c/year), which corresponds to a range from 2 to 10.7 years.
Figure 3 displays the PSD of the asymmetry for the IMF, Ap, and DST for the period from (1975-2013). The spectrum of the asymmetry for the field magnitude B shows significant peaks at (6.4, 4, 3.3, 2.7 and 2.4 years) as shown in plot 3a. Whereas, plot 3b displays significant peaks at wave-lengths 5.3, 4, and 2.5 years for the asymmetry of the geomagnetic index Ap. Furthermore, the PSD of the DST index shows significant peaks at 8, 5.3, 3.3, and 2.7 years. From the other hand, the PSD of the asymmetry for the geomagnetic index aa, and Kp gives the same peaks that observed on the geomagnetic index Ap, for this reason aa and Kp are missing from the PSD analysis. The plots confirmed similar or identical fluctuations of the 5.3 - 6.4, 4, 3.3 and 2.5 - 27 years be-tween the considered parameters. The 5.3 - 6.4 yr variation found in the considered parameters may be attributed to the different path of ion particles in heliosphere [23]. The 4 years, may be caused by the dual peak structure of geomagnetic activity or it is caused by a sector boundary of crossings [24]. A simple explanation for the peak at 8 year that appeared in the spectrum of DST index with lower magnitude is that it may be related to the forma-tion rate and the magnetic structure of achieving regions in the solar southern hemisphere [25]. Finally it is ob-vious that the N-S asymmetry is appeared for the considered parameters, and the main periodicity of the asym-metry does not coincide with the 10.7 year solar cycle. But the main periodicity of the asymasym-metry may be the periodicity at the 5.0, 4.0 and 3.3 years that were founded in the considered parameters.
4. Conclusions
Through the years, the conflict between researchers about whether the N-S asymmetry is real or the north and south hemisphere has an identical behavior, raised many question marks. In this paper the asymmetry between the solar field north and south of the heliospheric current sheet (HCS) has been examined for the field magni-tude B and the geomagnetic indices (Ap, aa, Kp, AE and DST) over the period (1975-2013), by separating the daily data of the field magnitude and the geomagnetic indices in two groups according to the field polarity sense (away or toward). Then, according to studying the N-S asymmetry as yearly difference variations between To-ward and Away days for both positive and negative polarity epochs for the considered parameters, the following results were gotten:
1) The field magnitude B has only 15 of 39 years having asymmetry with magnitude greater than the estimated error, and the dependence N-S asymmetry of B upon the IMF solar polarities is statistically insignificant. Finally and according to Tables 1-4, there is no clear indication of the presence of north-south asymmetry in the grand average field magnitude during the solar cycles.
2) Most of the N-S asymmetry for the geomagnetic parameters (aa, Ap, Kp, AE and DST), occurred during the period of positive polarity epochs, near to the minimum solar cycle or around the declining phase. In addi-tion, the asymmetry has a northern dominance during cycles 22 & 23 and southern dominance during cycles 21 & 24.
Figure 3. The PSD of the asymmetry for (a) The IMF; (b) the geomagnetic index Ap and (c) the DST index for the period from (1975-2013).
On the other side, the power spectrum density (PSD) of the asymmetry values for the field magnitude and geomagnetic parameters gives a significant periodicity proofed the asymmetry in the considered parameters. However, the 10.7 year solar cycle is not the exit on these parameters, which means that the N-S asymmetry is independent of the solar cycle. These results are identical with [26] [27]. Furthermore, the main periodicity of the asymmetry may be 5.2, 4.0 and 3.3 years that exist in the parameters with higher confidence levels.
Acknowledgements
The authors are deeply grateful to National Space Science Data Center (NSSDC)-NASA and the national geo-physical data center (NGDC) for the hourly IMF data and for providing the Interplanetary and magnetic activity data online.
References
[1] Hoeksema, J.T. (1989) Extending the Sun’s Magnetic Field through the Three-Dimensional Heliosphere. Advances in Space Research, 9, 141-152. http://dx.doi.org/10.1016/0273-1177(89)90108-7
[2] Waldmeier, M. (1971) The Asymmetry of Solar Activity in the Years 1959-1969. Solar Physics, 20, 332-344. http://dx.doi.org/10.1007/BF00159763
[3] Beiber, J.W. (1988) North-South Asymmetry of the Interplanetary Magnetic Field Spiral. Journal of Geophysics Re-search, 93, 5903-5907. http://dx.doi.org/10.1029/JA093iA06p05903
[4] Smith, C.W. and Beiber, J.W. (1993) Multiple Spacecraft Survey of the North-South Asymmetry of the Interplanetary Magnetic Field. Journal of Geophysics Research, 98, 9401-9415. http://dx.doi.org/10.1029/93JA00145
Geophysicae, 12, 279-285. http://dx.doi.org/10.1007/s00585-994-0279-x
[6] Zieger, B. and Mursula, K. (1998) Annual Variation in Near-Earth Solar Wind Speed: Evidence for Persistent North- South Asymmetry Related to Solar Magnetic Polarity. Geophysical Research Letters, 25, 841-844.
http://dx.doi.org/10.1029/98GL02018
[7] Bravo, S. and Gonzalez-Esparza, J.A. (2000) North-South Asymmetry of the Solar and Heliospheric Magnetic Field during Activity Minima. Geophysical Research Letters, 27, 847-849. http://dx.doi.org/10.1029/1999GL010709 [8] EL-Borie, M.A. (2001) North-South Asymmetry of Interplanetary Plasma and Solar Parameters. IL Nuovo Cimento,
24C, 843-857.
[9] Sanaikumaran, V. and Prabhakaran, S.R. (2008) North-South Asymmetry in Solar Wind & Geomagnetic Activity and Its Solar Cycle Evolution. Indian Journal of Radio & Space Physics, 37, 391.
[10] El-Borie, M.A., El-Abshehy, M., Talaat, S. and Taleb, W.M.A. (2012) North-South Asymmetric in Solar, Interplane-tary and Geomagnetic Indices. Astrophysics, 55, 127-139. http://dx.doi.org/10.1007/s10511-012-9221-1
[11] Chowdhury, P., Choudhary, D.P. and Gosain, S. (2013) A Study of the Hemispheric Asymmetry of Sunspot Area dur-ing Cycle 23 and 24. The Astrophysical Journal, 768, 188. http://dx.doi.org/10.1088/0004-637X/768/2/188
[12] Kong, D.-F., Qu, Z.-N. and Guo, Q.-L. (2015) The North-South Asymmetry of Solar Filaments Separately at Low and High Latitudes in Solar Cycle 23. Research in Astronomy and Astrophysics, 15, 77-84.
http://dx.doi.org/10.1088/1674-4527/15/1/008
[13] Richardson, J.D., Paularena, K.I., Belcher, J.W. and Lazarus, A.J. (1994) Solar Wind Oscillations with a 1.3 Year Pe-riod. Geophysical Research Letters, 21, 1559-1560. http://dx.doi.org/10.1029/94GL01076
[14] Gazis, P.R., Richardson, J.D. and Paularena, K.I. (1995) Long Term Periodicity in Solar Wind Velocity during the Last Three Solar Cycles. Geophysical Research Letters, 22, 1165-1168. http://dx.doi.org/10.1029/95GL01017
[15] Paularena, K.I., Szabo, A. and Richardson, J.D. (1995) Coincident 1.3-Year Periodicities in the AP Geomagnetic Index and the Solar Wind. Geophysical Research Letters, 22, 3001-3004. http://dx.doi.org/10.1029/95GL02802
[16] Rangarajan, G.K. (1991) North-South Asymmetry in Geomagnetic Activity during the Epoch 1964-1984. Journal of Geomagnetism and Geoelectricity, 43, 613-618. http://dx.doi.org/10.5636/jgg.43.613
[17] Kudo, S. and Mori, S. (1990) Long-Term Variation of Solar Diurnal Variation of Cosmic Ray Nucleonic Components.
Journal of Geomagnetism and Geoelectricity, 42, 875-884. http://dx.doi.org/10.5636/jgg.42.875
[18] EL-Borie, M.A., Sabbah, I.S. and Bishara, A.A. (1996) Diurnal Variations of Cosmic Rays during a Solar Magnetic Cycle. Astronomische Nachrichten, 317, 267-272. http://dx.doi.org/10.1002/asna.2113170405
[19] Ahluwalia, H.S. and Sabbah, I.S. (1993) Cosmic Ray Diurnal Anisotropy for a Solar Magnetic Cycle. Plant Space Science, 41, 113-125. http://dx.doi.org/10.1016/0032-0633(93)90039-5
[20] Kane, R.P. (1997) Quasi-Biennial and Quasi-Triennial Oscillation in Geomagnetic Activity Indices. Annales Geophy-sicae, 15, 1581-1594. http://dx.doi.org/10.1007/s00585-997-1581-1
[21] Shah, G.N. and Mufti, S. (2005) Anti-Podal Geomagnetic Activity, Sea Surface Temperature and Long-Term Solar Variations. 29th International Cosmic Ray Conference, 2, 311-314.
[22] Richardson, I.G., Cliver, E.W. and Cane, H.U. (2000) Sources of Geomagnetic Activity over the Solar Cycle: Relative Importance of Coronal Mass Ejections, High-Speed Streams, and Slow Solar Wind. Journal of Geophysics Research,
105, 18203-18213. http://dx.doi.org/10.1029/1999ja000400
[23] El-Borie, M.A. (2002) On Long-Term Periodicities in Solar-Wind Ion Density and Speed Measurements during the Period 1973-2000. Solar Physics, 208, 345-358. http://dx.doi.org/10.1023/A:1020585822820
[24] Prestes, A., Rigozo, N.R., Echer, E. and Vieira, L.E.A. (2006) Spectral Analysis of Sunspot Number and Geomagnetic Indices (1868-2001). Journal of Atmospheric and Solar-Terrestrial Physics, 68, 182-190.
http://dx.doi.org/10.1016/j.jastp.2005.10.010
[25] McIntosh, P.S., Thompson, R.J. and Wilcox, E.C. (1992) A 600-Day Periodicity in Solar Coronal Holes. Nature, 360, 322-324. http://dx.doi.org/10.1038/360322a0
[26] Wang, Y. (1992) The North-South Asymmetry of Sunspot Distribution. Journal of the Royal Astronomical Society of Canada, 86, 89-98.