ScholarWorks @ Georgia State University
Communication Sciences and DisordersDissertations
Department of Communication Sciences and Disorders
8-13-2019
Examining the Dimensionality and Contributors of
Kindergarten Composition
Molly K. Duncan Georgia State University
Follow this and additional works at:https://scholarworks.gsu.edu/epse_diss
This Dissertation is brought to you for free and open access by the Department of Communication Sciences and Disorders at ScholarWorks @ Georgia State University. It has been accepted for inclusion in Communication Sciences and Disorders Dissertations by an authorized administrator of ScholarWorks @ Georgia State University. For more information, please contactscholarworks@gsu.edu.
Recommended Citation
Duncan, Molly K., "Examining the Dimensionality and Contributors of Kindergarten Composition." Dissertation, Georgia State University, 2019.
ACCEPTANCE
This dissertation, EXAMINING THE DIMENSIONALITY AND CONTRIBUTORS OF KINDERGARTEN COMPOSITION, by MOLLY DUNCAN, was prepared under the direction of the candidate’s Dissertation Advisory Committee. It is accepted by the committee members in partial fulfillment of the requirements for the degree, Doctor of Philosophy, in the College of Education & Human Development, Georgia State University.
The Dissertation Advisory Committee and the student’s Department Chairperson, as
representatives of the faculty, certify that this dissertation has met all standards of excellence and scholarship as determined by the faculty.
_____________________________ __________________________ Cynthia Puranik, Ph.D./CCC-SLP Amy Lederberg, Ph.D.
Committee Co-Chair Committee Co-Chair
_____________________________ ___________________________ Hongli Li, Ph.D. Daphne Greenberg, Ph.D.
Committee Member Committee Member
_____________________________ Date
______________________________ Brendan Calandra, Ph.D.
Chairperson, Department of Learning Sciences
______________________________ Paul A. Alberto, Ph.D.
AUTHOR’S STATEMENT
By presenting this dissertation as a partial fulfillment of the requirements for the advanced degree from Georgia State University, I agree that the library of Georgia State University shall make it available for inspection and circulation in accordance with its regulations governing materials of this type. I agree that permission to quote, copy from, or to publish this dissertation may be granted by the professor under whose direction it was written, by the College of
Education and Human Development’s Director of Graduate Studies, or by me. Such quoting, copying, or publishing must be solely for scholarly purposes and will not involve potential financial gain. It is understood that any copying from or publication of this dissertation which involves potential financial gain will not be allowed without my written permission.
NOTICE TO BORROWERS
All dissertations deposited in the Georgia State University library must be used in accordance with the stipulations prescribed by the author in the preceding statement. The author of this dissertation is:
Molly Katherine Duncan 1376 Keys Lake Dr NE
Atlanta, GA 30319
The director of this dissertation is:
Cynthia Puranik, Ph.D./CCC-SLP
Department of Communication Sciences and Disorders College of Education and Human Development
CURRICULUM VITATE
Molly Duncan ADDRESS: 1376 Keys Lake Dr NE
Atlanta, GA 30319 EDUCATION:
Ph.D. 2019 Georgia State University
Department of Learning Sciences M.S. 2017 Georgia State University
Educational Psychology B.A. 2011 Taylor University
Psychology PROFESSIONAL EXPERIENCE:
2018-present Program Evaluation Analyst Fulton County Schools 2015-2018 Graduate Research Fellow
Georgia State University 2014-2015 Graduate Research Assistant
Georgia State University PRESENTATIONS AND PUBLICATIONS:
Duncan, M. K. & Lederberg, A. R. (2018). Relations between teacher talk characteristics and child language in spoken-language deaf and hard-of-hearing classrooms. Journal of Speech,
Language, and Hearing Research 61, 2977-2995.
Duncan, M. K. & Puranik, C. P. (2018, April). Dimensionality of kindergarten composition.
Presented at the Georgia State University Language and Literacy Day in Atlanta, Georgia. Guo, Y., Puranik, C., Kelcey, B., Duncan, M., Breit-Smith, A., Jing, S. (2018, July). Examining reading-writing connections in kindergarten children at the learning to write phase. Paper
presented at the annual meeting of the Society for the Scientific Study of Reading, Brighton, UK.
Duncan, M.K., Crymes, M. E., & Lederberg, A. R. (2017, April). Language development
facilitation through conversation in young oral DHH classrooms. Presented at the meeting of the Society for Research in Child Development in Austin, Texas.
Duncan, M. K. (2017, March). Improve and repeat: Improving deaf and hard-of-hearing children’s vocabulary through conversation. Presented at the Georgia State University 3-Minute Thesis Competition in Atlanta, Georgia.
Duncan, M. K., Crymes, M. E., Bober, C. M., & Lederberg A. R. (2016, April). Variability in facilitative conversation techniques among teachers in oral deaf and hard-of-hearing
classrooms. Presented at the Georgia State University Language and Literacy Day in Atlanta, Georgia.
PROFESSIONAL SOCIETIES AND ORGANIZATIONS
EXAMINING THE DIMENSIONALITY AND CONTRIBUTORS OF KINDERGARTEN COMPOSITION
by
MOLLY DUNCAN
Under the Direction of Cynthia Puranik
ABSTRACT
Despite increasing pressure for children to learn to write at younger ages, there are many unanswered questions about composition skills in early elementary school. The goals of this dissertation were to add to knowledge about the measurement of young children’s writing and its component skills. Both studies explore the composition skills of a sample of 282 kindergartners. In Study 1, confirmatory factor analyses indicated that a qualitative scoring system and a
productivity scoring system capture distinct dimensions of kindergartners’ compositions. A scoring system for curriculum-based measurement could not attain acceptable fit, which may suggest that CBM is ill-suited for capturing the important components of writing for
Constraints Hypothesis (DCH). In support of the DCH, transcription had a strong constraining effect on both composition quality and productivity. Additionally, transcription moderates the relation between text generation and composition quality, although the moderation is negative. There is no signification moderation of transcription on the text generation-composition relation.
EXAMINING THE DIMENSIONALITY AND CONTRIBUTORS OF KINDERGARTEN COMPOSITION
by
Molly Duncan
A Dissertation
Presented in Partial Fulfillment of Requirements for the Degree of
Doctor of Philosophy in
Educational Psychology in
the Department of Learning Sciences in
the College of Education and Human Development Georgia State University
Copyright by Molly K. Duncan
ACKNOWLEDGMENTS
I am extremely grateful to the faculty and staff of the College of Education and Human Development at Georgia State for their support, mentorship, and friendship throughout my time here. I am particularly indebted to Dr. Amy Lederberg and Dr. Cynthia Puranik, who spent countless hours teaching me the skills I needed to be a good researcher and scholar, and who went out of their way to support me. I am also grateful to Dr. Daphne Greenberg, Dr. Hongli Li, Dr. Kevin Fortner, Dr. Audrey Leroux, Dr. Ann Kruger, Dr. Maggie Renken, Dr. Hanah
Goldberg, and Dr. Victoria Burke, who have served on committees, spent time listening to me and giving personal or professional advice, and have supported and helped me in many other ways during the past five years.
TABLE OF CONTENTS
LIST OF TABLES ... iv
LIST OF FIGURES ... v
1 MEASURING KINDERGARTEN WRITING ... 1
Methodology ... 13
Results ... 19
Discussion... 23
References ... 33
2 DEVELOPMENTAL CONSTRAINTS AND THE SIMPLE VIEW OF WRITING: AN EXPLORATION OF THE RELATIONS AMONG TEXT GENERATION, TRANSCRIPTION, AND COMPOSITION SKILLS ... 66
Methodology ... 73
Results ... 84
Discussion... 86
References ... 94
APPENDIX A – Sample curriculum-based measurement scoring ... 119
APPENDIX B – explanation and example scoring for good transcribers’ essays ... 120
LIST OF TABLES
Table 1 Final Models of Writing Dimensionality from Recent Studies ... 41
Table 2 Qualitative Scoring System by Coker & Ritchey (2010) ... 43
Table 3 Qualitative Scoring Scoring System for Composition Assessment ... 44
Table 4 Demographic Characteristics of Sample ... 45
Table 5 Descriptive Statistics for Composition Measures ... 46
Table 6 Correlations Between Observed Variables... 47
Table 7 Overall Model Fit Indices for Final Models ... 49
Table 8 Demographic Characteristics of Sample ... 106
Table 9 Descriptive Statistics of Observed Variables ... 107
Table 10 Correlations Between Observed Variables ... 108
Table 11 Model Fit Statistics ... 109
Table 12 Quality Component Scores for Example Essays ... 122
LIST OF FIGURES
Figure 1 ... 50
Figure 2 ... 51
Figure 3 ... 52
Figure 4 ... 53
Figure 5 ... 54
Figure 6 ... 55
Figure 7 ... 56
Figure 8 ... 57
Figure 9 ... 58
Figure 10 ... 59
Figure 11 ... 60
Figure 12 ... 61
Figure 13 ... 62
Figure 14 ... 63
Figure 15 ... 64
Figure 16 ... 65
Figure 17 ... 110
Figure 18 ... 111
Figure 19 ... 112
Figure 20 ... 113
Figure 21 ... 114
Figure 22 ... 115
Figure 23 ... 116
Figure 25 ... 118
Figure 26 ... 119
Figure 27 ... 123
1 MEASURING KINDERGARTEN WRITING
The measurement of composition skills has grown increasingly important for educators and researchers due to pressure for children to write at young ages and an increased emphasis on data-driven decision making in the classroom. Despite the important role of writing in academic learning, there are still many open questions and a lack of consensus about how best to measure young children’s composition. One important issue revolves around how to best capture
children’s written output, or in other words, what components of written composition are important. Some studies have reported or assumed that young children’s composition is
accurately represented as a single, holistic component or score (e.g. Abbott & Berninger, 1993; Gansle, VanDerHeyden, Noell, Resetar, & Williams, 2006), whereas others have found that the writing of elementary school students contains many components, including macro-organization, productivity, complexity, and accuracy (Hall-Mills & Apel, 2015; Kim, Al Otaiba, Folsom, Greulich, & Puranik, 2014; Kim, Al Otaiba, Wanzek, & Gatlin, 2015; Puranik, Lombardino, & Altmann, 2008; Wagner et al., 2011). A second issue is what type of measurement best captures these important components of writing. Researchers have used many different methods of measuring elementary school children’s compositions, including qualitative scoring systems, quantitative scoring, and curriculum-based measurement (CBM). These various scoring methods may be capturing different components of composition ability. A greater understanding of the measurement of young children’s composition is necessary so that researchers can continue to appropriately assess writing, examine predictors of composition ability, and design interventions for struggling composers. A greater understanding of measurement will also enable more
The primary aim of this study was to examine the dimensionality of writing in kindergarten children. To date, there have been no studies examining the dimensionality of writing in kindergarten children. Kindergarten is a year when children are just learning to write, including learning to write letters, spell words, and write sentences. Because they are just beginning to learn to write, their compositions may be qualitatively and quantitatively different than the compositions of older children. This study attempted to add to the existing body of literature by replicating previous findings about dimensionality, examining the dimensionality of a less-studied qualitative scoring system, examining alternate possibilities of the dimensionality of CBM, and extending the research to kindergarten compositions.
Components of Young Children’s Compositions
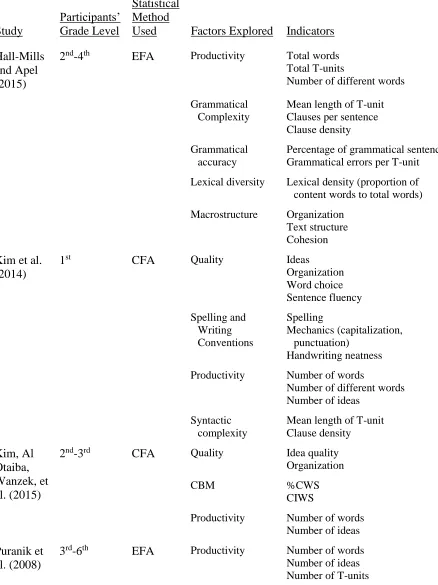
Previously identified dimensions of composition include macro-organization, accuracy, productivity, and complexity. The findings of recent studies regarding the dimensions present in the writing of young children and the indicators of each dimension are presented in Table 1 and are discussed below.
Macro-organization. The macro-organization of writing is generally considered to be the most important outcome or measurement of written composition (e.g., Kim, Al Otaiba, Wanzek, et al., 2015), perhaps because the writing of older students is judged primarily on its organization and content (e.g., ACT, 2018). The macro-organization component of writing is typically defined as the content of the ideas and the overall organization of the composition (Hall-Mills & Apel, 2015; Kim et al., 2014; Wagner et al., 2011), though some researchers include components such as word choice and sentence fluency (e.g. Kim et al., 2014).
grammar, and mechanics such as punctuation and capitalization (Kim et al., 2014). This is also a component of composition that is considered in many standardized tests. For example, the Georgia Standards of Excellence require kindergartners to “demonstrate command of the conventions of standard English grammar and usage when writing or speaking” and
“demonstrate command of the conventions of standard English capitalization, punctuation, and spelling when writing,” (Georgia Department of Education, 2015, p. 5).
Productivity. Because of the difficulty of reliably rating the quality of young children’s
writing, a common approach is to use writing productivity as an outcome for kindergartners and first graders (Kent, Wanzek, Petscher, Al Otaiba, & Kim, 2014; Kim et al., 2011; Lerkkanen, Rasku-Puttonen, Aunola, & Nurmi, 2004; Puranik & Al Otaiba, 2012; Puranik, Al Otaiba, Sidler, & Greulich, 2014). Writing productivity in a sample is based on counting the number of units a child includes in his or her writing. These units may be the number of words, different words, ideas, clauses, or sentences (Berninger et al., 1992; Graham, Berninger, Abbott, Abbott, & Whitaker, 1997; Kent et al., 2014; Kim, Park, & Park, 2013; Puranik et al., 2008). For young composers, writing quality and productivity are related both conceptually (Kim, Al Otaiba, Wanzek, et al., 2015) and empirically (Abbott & Berninger, 1993; Kim et al., 2014; Nelson & Van Meter, 2007), but are nevertheless distinct constructs (Kim et al., 2014; Kim, Al Otaiba, Wanzek, et al., 2015; Wagner et al., 2011). Their conceptual link stems from the fact that children who write greater quantities of text have more opportunities to convey complex, meaningful ideas.
Syntactic complexity. Syntactic complexity is another distinct component of children’s
ratio of main and subordinate clauses in the composition. This may be a valuable component of writing because writers are expected to produce compositions that include a variety of sentence structures. For example, the scoring rubric for the writing portion of the ACT requires students to use varied sentence structures for full points in the language use category (ACT, 2018).
Similarly, the Georgia Standards of Excellence require children to use linking words in their writing as early second grade (Georgia Department of Education, 2015), and the use of linking words often requires the use of multiple clauses within a sentence. Previous studies have
identified syntactic complexity as a separate dimension of children’s writing, albeit with slightly older children from 1st grade and above. The majority of the essays in this study contain either no complete clauses or only one. Since little variation is expected in these scores, the present study will not measure syntactic complexity.
Methods for Measuring Young Children’s Compositions
important. These scoring systems, along with the components of composition they are hypothesized to capture, are discussed below.
Qualitative scoring systems. Several scoring systems have been developed to measure the quality of writing. One such scoring system is the 6+1 Traits rubric (Education Northwest, 2017). The rubric contains seven different categories that each have criteria for scoring multiple aspects within that category. For example, the organization category contains criteria for scoring the quality of the composition’s beginning, middle, and end; transitions; sequencing; and title. Although there are seven different categories, the rubric captures two distinct dimensions of writing for first graders: scores for ideas, organization, word choice, and sentence fluency capture the macro-organization of the writing, whereas the spelling, mechanics, and handwriting categories capture the technical accuracy of the writing (Kim et al., 2014). Therefore, this rubric measures two of the important components of composition.
The 6+1 Traits Rubrics system is widely used, freely available, and frequently researched (e.g. Coe, Hanita, Nishioka, Smiley, & Park, 2011; Kim et al., 2014; Gansle et al., 2006),
multiple scoring categories. However, research is needed to determine its dimensionality. Like the more complex 6+1 Traits Rubrics, its five categories may be separable into two distinct dimensions: response type, relationship to prompt, and grammatical structure may capture the macro-organization of the composition, whereas spelling and mechanics may both measure aspects of the accuracy of writing conventions. The present study examined whether a slightly modified version of this scoring system captures two distinct dimensions of writing (macro-organization and accuracy) or a single dimension (which may represent the overall quality of the writing). Coker and Ritchey’s original scoring system is presented in Table 2, while the scoring system used in the present study is presented in Table 3.
Response type. The response type category measures the completeness and complexity of the composition. In kindergarten, children are typically graduating from writing single letters at a time to writing entire sentences, so the length and complexity of a short composition is a
developmentally appropriate and sensitive measure of writing ability (Berninger, Fuller, & Whitaker, 1996; Coker & Ritchey, 2010). The inclusion of response type as a category is in line with the 6+1 Traits Rubrics because the sentence fluency category awards points for using a greater variety of sentences and more complex sentence structures. Therefore, in a
two-dimensional model of the qualitative scoring system, response type was expected to be related to macro-organization.
clear main idea with supporting details. Under the scoring system used by Hall-Mills and her colleagues, the organization category awarded points when compositions included a clear beginning and supporting details (Hall-Mills, 2010; Hall-Mills & Apel, 2015). The scoring system used by Wagner et al. (2011) conceptualized this category slightly differently by
awarding points based on the inclusion of a topic sentence and the number of key elements (main idea, body, and conclusion). Wagner and colleagues’ scoring system was appropriate for their age group (1st and 4th graders) and their prompt. However, inclusion of a topic sentence or key elements (e.g. story elements like plot, character, and setting) may be too stringent of an expectation for kindergartners, who often write only a sentence or less. Therefore, the
expectations included in Coker and Ritchey’s (2010) scoring system and the scoring system in this study are more age-appropriate for kindergartners. This category captures variation in writing ability between kindergartners, while still measuring a similar concept to what is measured in scoring systems for more mature writers. Because of this similarity, relationship to prompt was hypothesized to load onto the macro-organization category.
Grammatical structure. The grammatical structure category measures how many
grammatical mistakes a child makes and how those mistakes impact the meaning of the sentence. Grammatical accuracy is a consideration in most measurement systems. Most researchers group this measure with the accuracy of writing (Education Northwest, 2017; Puranik et al., 2008) or include it as a unique dimension of itself (Hall-Mills & Apel, 2015). However, Coker and Ritchey (2010) argue that severe mistakes or having many mistakes can compromise the
meaning of the composition or make it impossible to decipher (see also Olinghouse, 2008). This is particularly true for young writers, who tend to have a high percentage of grammatical
link with the meaning of the composition, which in some ways is unique to the age group in this study, made it a good fit for the macro-organization factor. This is in contrast to the more conventional approach of including it with the measures of spelling and mechanical accuracy.
Spelling. Measurements of spelling accuracy are also included in nearly every writing scoring system. Kim et al. (2014) found that this measure fit on a factor that represented the accuracy of writing conventions. Similarly, the spelling category of the scoring system used in this study was hypothesized to reflect the accuracy of writing conventions.
Mechanics. Mechanical accuracy is also frequently measured in writing. Although rating systems designed for more mature writers sometimes include more stringent criteria, such as correct capitalization of proper nouns and titles (e.g. Education Northwest, 2017), this is not age-appropriate for kindergartners, most of whom have received minimal instruction in the rules of capitalization or more complex rules of punctuation (such as where to include commas).
Accordingly, the scoring system used in this study focuses primarily on capitalization of the first letter in the sentence and correct sentence-ending punctuation. This score was hypothesized to measure the accuracy of writing conventions, as it does in most other rating systems (e.g. Kim et al., 2014; Wagner et al., 2011).
Productivity scoring system. There is more agreement regarding the variables that should be included in productivity scoring systems. The most frequently included variable is words written (WW); others include the number of ideas, the number of different words, and the number of minimal terminable units. This study considered WW and the number of ideas.
Parker, 1989; Wagner et al., 2011). Under this system, words that are repeated throughout the composition are counted each time they appear. In line with a great deal of previous research (e.g. Kim et al., 2014; Puranik et al., 2008; Wagner et al., 2011), the WW measure was hypothesized to load onto a productivity factor that was distinct from the factors of the qualitative scoring system.
Number of ideas. The number of ideas in a composition is the number of complete propositions, or subject-predicate pairs (e.g. Kim et al., 2011; Kim et al., 2014; Puranik et al., 2008). This is an important supplement to the WW measure because it awards credit to writers who express complex ideas concisely. These writers might be recognized as less productive if WW is the only measure of productivity. This factor was also hypothesized to load onto a productivity factor.
Curriculum-Based Measurement. Demands for accountability and quantifiable learning in education have led educators and researchers to develop measures of academic skills that are easy and quick to administer, that can be scored by teachers, and that can track students’ growth; these measures are commonly called curriculum-based measurement (CBM; Hosp, Hosp, & Howell, 2007). CBM for writing involves scoring a short composition according to the correct or incorrect word sequences (CWS, IWS)1. A word sequence refers to a pair of two consecutive words or a consecutive word and punctuation mark. A correct word sequence (CWS) is a pair that is both contextually and grammatically correct (Hosp et al., 2007). An example sentence, scored for CWS, is presented in Appendix A. Some have argued that CBM scores capture both productivity and other aspects of writing that are not related to productivity, i.e.
1 When CBM is administered as the only measure of composition, it sometimes includes a count of the WW and a
dependent and production-independent aspects (Tindal & Parker, 1989). Conversely, Kim and colleagues (Kim, Al Otaiba, Wanzek, et al., 2015; Kim, Gatlin, Al Otaiba, & Wanzek, 2018). have suggested that some CBM scores capture writing fluency, a distinct component of writing ability that is separate from other components such as quality and productivity.
Correct word sequences (CWS). Although the number of CWS is related to the accuracy of the writing conventions (for example, the number of words a child spells correctly partly determines the CWS score), Tindal and Parker (1989) have demonstrated that it is a production-dependent measure. In this sense, CWS may be considered a measure of a writing productivity. Conversely, it may capture the writing fluency component hypothesized by Kim and colleagues (Kim, Al Otaiba, Wanzek, et al., 2015; Kim et al., 2018). This study tested both possibilities, with no a priori hypotheses about which model would fit better.
Percent of correct word sequences (%CWS). Many researchers choose to use scores derived from CWS rather than the raw scores themselves. For example, researchers have used the number of correct minus incorrect word sequences or the percent of correct word sequences (%CWS) out of total word sequences (McMaster & Espin, 2007). Tindal and Parker (1989) considered %CWS to be a production-independent measure, conceptually distinct from CWS and other productivity measures. They also found that %CWS was an indicator of the writing quality score, which they defined as a holistic score that captured “communicative effectiveness”
macro-organization and productivity measures. Therefore, it is unclear whether %CWS is an additional measure of the technical accuracy of writing, or whether %CWS (together with CWS) captures a distinct component of writing that is dissociable from components such as accuracy and
productivity. This study tested both possibilities.
Although CBM has many useful properties, including the fact that it is quick and reliable to score and can capture growth across a school year, it is still unclear exactly which aspects of writing CBM captures. Examining the dimensionality of two of its measures may help to illuminate exactly what educators and researchers measure when they use CBM. This is an important consideration, given its prevalence in research and in recommendations for educators (e.g. Deno, 2003; Hosp et al., 2007; Kim, Al Otaiba, Wanzek, et al., 2015; McMaster et al., 2011; McMaster & Espin, 2007; Tindal & Parker, 1989).
The Present Study
The present study used essays written by kindergartners near the end of the school year to investigate the dimensionality of various methods of scoring. The findings of this study add to the existing literature on the multidimensional nature of different methods of scoring children’s writing (Kim et al., 2014; Puranik et al., 2008; Wagner et al., 2011); serve as a further
investigation of a qualitative writing scoring system (Coker & Ritchey, 2010); and investigate some possible ways that CBM measures important aspects of writing.
Research Questions
1) Does a qualitative writing scoring system comprise two separate dimensions of macro-organization and technical accuracy for a kindergarten sample?
models depicted in Figure 1 and Figure 2. It was hypothesized that the qualitative scores would capture two distinct dimensions of writing: macro-organization and accuracy, in line with the findings of Kim et al. (2014). An alternate possibility was that the scoring system would be best represented as a single factor that may capture the overall quality of the writing.
2) What is the dimensionality of writing in kindergarten when productivity indicators are added to the qualitative model of kindergarten writing?
The second research question examined how many dimensions are present in kindergarten compositions when a productivity scoring system is used in addition to the qualitative scoring system. This question compared the fit of the models depicted in Figure 3 and Figure 4. It was hypothesized that the productivity scoring system would capture a dimension of writing that was separate from the dimension captured by the qualitative scoring system. This would be consistent with previous studies of children’s writing (e.g., Kim et al., 2014, Puranik et al., 2008, Wagner et al., 2011). An alternate possibility was that the productivity scoring system would capture the same dimension as the qualitative scoring system.
3) Do CWS and %CWS comprise one or two dimensions for a kindergarten writing sample?
The third research question examined how many dimensions are present in kindergarten compositions when CBM is used for scoring. This question compared the fit of the models depicted in Figure 5 and Figure 6. One possibility was that the two CBM scores would capture separate dimensions of writing. These dimensions may represent productivity and accuracy, in line with Tindal and Parker’s (1989) findings of dependent and
conflicting findings from previous studies, there was no a priori hypothesis about which of the two models would fit better.
4) Do CBM indicators capture similar dimensions of composition as the productivity and quality indicators, or do CBM indicators capture a distinct dimension of composition?
The fourth research question examined how many dimensions are present in kindergarten compositions when a qualitative scoring system, a productivity scoring system, and CBM are used for scoring. It compared the fit of the models depicted in Figure 7 and Figure 8. One possibility was that %CWS would capture the technical accuracy of the writing, whereas CWS would capture the productivity of the writing, resulting in a two-factor model. An alternate possibility was that the two CBM scores together would capture a dimension of writing that is distinct from the other dimensions in this study, resulting in a three-factor model. There was no a priori hypothesis about which of the two models would fit better.
Methodology
Participants
The participants in this study were 281 kindergarten students recruited from public schools serving urban and suburban neighborhoods in the South and Northeast United States. These students attended 49 different classrooms, with each classroom having on average six participating students. There was one additional child who participated in data collection but refused one of the essays. That child’s scores were not used for any of the analyses in this paper.
was seven years, zero months. Other demographic information for these 273 students is presented in Table 4.
Measures and Procedures
Kindergarten children wrote two essays on two separate days near the end of the school year (April or May). Writing took place in a convenient location at the child’s school, usually in a group of about six children. In the first prompt, the examiner instructed children to write about a special event (essay 1). An examiner introduced the writing topic using a script, saying “Today, you are going to draw and write about a special event in your life.” The script the examiner followed gave examples of special events (a special birthday or a special vacation), elicited an idea from each child, and asked for an additional detail from each child (such as “Who was there?”). The examiner also instructed children to try to keep writing for the entire time, to sound out words as best they could, and to cross out mistakes instead of erasing them. A different prompt was used for the second essay, although the structure of the instructions remained the same. In the second prompt, the examiner instructed children to write about something they were an expert on or knew a lot about (essay 2). The examples given were that children might know a lot about lions, cars, or dinosaurs. An example of an additional detail the examiner might ask for was, “What does it/they look like?”. The page on which the children wrote their essays also had a box in which the children could draw a picture, but the instructions script primarily focused on writing about the topic.
could write it in the margins of the paper. This aided scoring in cases where children had poor handwriting or spelling.
Essay scoring.
Each essay was scored for quality (qualitative indicators, including response type, relationship to prompt, grammatical structure, spelling, and mechanics), productivity (WW and ideas) and CBM (CWS and %CWS). Coker and Ritchey’s (2010) original scoring system was slightly modified to fit the different task requirements and prompts used in this study. The version used in this study is presented in Table 3, with italics marking any words or segments that are modified from the original scoring system. Most of the modifications were minor clarifications in response to questions that scorers had during training. There were two
modifications that were more substantive. The first modification was related to the grammatical structure category and was necessary due to the length of the writing samples in this study. Coker and Ritchey asked participants to write a single sentence about a prompt, whereas in this study children wrote longer compositions. Coker and Ritchey’s grammatical structure category awards two points to sentences that contain a single grammatical error and one point to sentences with more than one error. Since the participants in this study sometimes wrote longer
compositions, the scoring system in this study allowed two points for compositions even if they contained multiple grammatical errors, provided that the errors did not comprise more than 50% of the writing sample and did not have a major effect on the meaning. The second major
Coker and Ritchey’s scoring system by awarding points for details that are appropriately related to the prompt, while being more specific to maximize scoring reliability. Additionally, the scoring system in this study has two different sets of criteria because children were writing essays in two different genres. However, each essay only received one score for the relationship to prompt category (and therefore, a total of five 0-3 point scores for the whole scoring system). Graduate research assistants (GRAs) worked in pairs to score the essays for quality (that is, the qualitative scoring system that included categories for response type, relationship to prompt, grammatical structure, spelling, and mechanics), WW (one of the two productivity indicators), and CWS and %CWS (the CBM indicators). Each assessment was individually scored by two GRAs, who then compared scores and came to an agreement about any discrepancies before recording the final score.
Because the qualitative scoring system had four possible scores for each category, it was treated as an ordinal measure and reliability was measured with Cohen’s kappa. Interrater reliability ranged from .71 to .96. Since productivity (WW and ideas) and CBM (CWS and %CWS) scores are continuous measures, reliability was measured by intraclass correlation coefficient (ICC); reliability ranged from .92 to 1.0.
Analytic Strategy
Preliminary statistics for this analysis (such as normality tests and correlations) were conducted in RStudio (RStudio Team, 2016). Modeling analyses were performed in Mplus, version 8.1 (Muthén & Muthén, 2017). All analyses accounted for the nested nature of the data using cluster-corrected standard errors.
likelihood (ML) estimation does not perform well in CFAs with ordinal data, so weighted least squares means and variances (WLSMV) estimation was used for most of the analyses, as
recommended by Finney & DiStefano (2013) and Bandalos (2014). When used with ordinal data that has only four categories, WLSMV is more likely to result in unbiased parameter estimates compared to ML or robust ML estimation (Bandalos, 2014). The only exception was the third research question, which contained only continuous indicators and therefore did not require WLSMV. Instead, the analyses for Question 3 used robust maximum likelihood estimation (MLR) because this is the default estimation method for analyses that include cluster-robust standard errors. MLR is also robust to nonnormal data (Brown, 2015), and this was important for this study because skewness and kurtosis tests (performed in the moments package of R; Komsta & Novomestky, 2015) were significant for several variables.
better, modification indices were also examined to highlight areas with poor local fit and suggest improvements (Brown, 2015). When the modification indices suggested freely estimating
parameters that were theoretically sensible, these parameters were added one at a time to the better-fitting model. Parameters were added until the model approached the cutoffs for reasonable model fit.
There were two main types of parameter additions that made sense theoretically. The first was correlation between the errors of two indicators from the same essay (for example,
relationship to prompt and response type for Essay 1). It is reasonable to think that because these indicators were based on a single essay, their error variances would be related. The second theoretically sensible correlation was between the errors of the same measure for different essays (for example, mechanics for Essay 1 with mechanics for Essay 2). This is another reasonable suggestion, because children who use good or poor punctuation or capitalization in one essay are likely to do so again when they write an essay a few days later.
Results
Descriptive Statistics
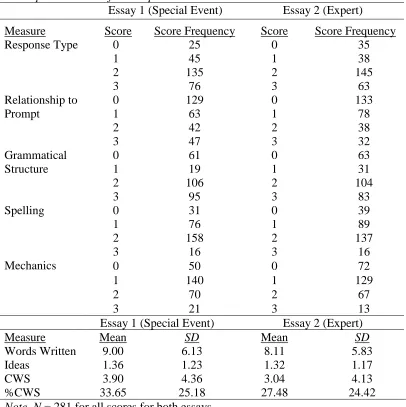
Means and standard deviations for each measure are presented in Table 5. Descriptive data indicated that on average, children wrote nine words for the special event essay and about eight words for the expert essay. The CBM scores indicated a great deal of variability in both CWS and %CWS. Due to the fact that neither of these variables could be lower than 0, both had strong positive skews. The estimation methods used in the CFAs of this study are capable of handling non-normal data. Examination of the pattern of scores on the qualitative scoring
systems does not reveal any distinct patterns whereby one category is easier in one essay than the other.
Correlations between the observed variables are presented in Table 6. Correlations between two continuous variables were Pearson correlations; correlations between a continuous and a categorical variable or between two categorical variables were Spearman correlations, as this type of correlation is more appropriate for categorical data (Rugg, 2007). With a few exceptions that are discussed in more detail below, correlations were small to moderate.
Dimensions in the Qualitative scoring system
one-factor model, χ2(1) = 29.05, p < .001. However, adding the modifications suggested in the
modification indices rapidly increased the correlation between the two factors, and many of the modification indices suggested cross-loading indicators on both factors. For these reasons, it seemed preferable to retain the one-factor model and use the modification indices to improve it. The final model for the qualitative scoring system is depicted in Figure 1.9, and model fit statistics are presented in Table 7.
Dimensionality of Quality and Productivity
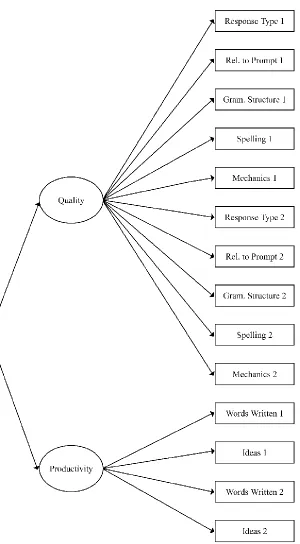
The second research question examined whether the qualitative scoring system and the productivity scoring system represent a single dimension (Figure 3) or distinct dimensions (Figure 4) of kindergarten composition. Preliminary data screening revealed a problematically high correlation between the response type indicator and the ideas indicator for each essay, above ρ = .80 in both cases. In theory, these two measures are closely related but not identical. Response type captures the completeness of the response, with one point awarded for having one to several words and up to three points awarded for multiple sentences or a complex sentence. Ideas is a measure of how many complete propositions exist in the writing. Therefore, response type is a more lenient indicator in that it awards points for a lower standard (such as a few words that don’t make a complete sentence); however, it has a maximum of three points. Thus, a composition with several complete sentences would receive the same score as a composition with two complete sentences. Conversely, the ideas measure does not award points for
incomplete sentences, but it can award a theoretically infinite amount of points for compositions with more complete propositions. However, with our sample, these two measures were
sentence. Thus, there was not sufficient variation at the higher end of the spectrum to make ideas a distinct indicator.
The close relationship between these two variables resulted in many incorrect model solutions due to nonpositive definite latent variable covariance matrices. When variables are too highly correlated, it is best to combine or drop one of them (Kline, 2016). Response type was dropped from the models because the ideas indicator is more widely represented in writing research (e.g. Kim et al, 2014; Puranik et al., 2008; Wagner et al., 2011) than the response type indicator. Furthermore, it seemed better to retain the indicator that had a larger possible range of values. Additionally, dropping the ideas indicators would have resulted in only two indicators (the WW indicators) loading onto the productivity factor. Two-indicator factors can be problematic for identification, and they can be problematic because they allow more
measurement error (Kline, 2016). The modified conceptual models are depicted in Figure 10 and Figure 11. These are the models that were compared.
The model in which productivity was a unique factor (Figure 11) had significantly better fit than the one-factor model (Figure 10), χ2(1) = 91.28, p < .001, but the fit of both models was poor. The addition of several theoretically sensible correlated error terms that were suggested by the modification indices improved the model fit to acceptability. The final model with
standardized regression weights is depicted in Figure 12, and model fit statistics are presented in Table 7.
Dimensionality of CBM Indicators
was unacceptably poor. The two-dimensional model did not fit significantly better than the unidimensional model, p = .007. Modifications to improve the model fit were not attempted because the model had only two degrees of freedom. Model fit statistics are presented in Table 7. Standardized regression weights for the one-factor model are presented in Figure 13, but they should not be interpreted because the fit for the model is poor.
Dimensionality of All Composition Measures
of these analyses may tentatively suggest support for the two-factor model for several reasons. The criteria to be used for determining which model fit better were alignment with the results of the third research question, parsimony, and interpretability. The three-factor model is better aligned with the third research question because CBM scores may be unidimensional; however, the results of the third research question must be interpreted with extreme caution because the fit for both models was poor. However, when evaluating the parsimony of the models for the fourth research question, the two-factor model is preferable to the three-factor model. It has fewer dimensions, and it required two fewer correlated error terms to achieve mediocre fit. Lastly, the two-factor model is slightly more interpretable than the three-factor model, both because it has fewer correlated error terms and because it gives inherent meaning to the CBM scores. As an additional consideration, the three-factor model required several correlated error terms between CBM indicators and the indicators from other factors. The fact that CBM indicators may share additional variance with indicators from other factors suggests that they may fit better when modeled as loading onto those other factors. Model fit statistics are presented in Table 7, and the final two-factor model is presented in Figure 16. The results of this model should be interpreted with extreme caution, because the fact that so many parameters needed to be added to the model to achieve even a mediocre fit suggests that the theoretical model may have been a poor starting point for modeling the data.
Discussion
teachers because it is quick to administer. Additionally, this study replicates the finding that writing quality and writing productivity are closely related but are nevertheless distinct measures.
This study attempted to replicate Kim and colleagues’ (2014) finding with first graders that a qualitative scoring system comprises two distinct dimensions. Despite the fact that the new scoring system used in this study measures similar constructs to the 6+1 Traits Rubric that was used in Kim’s study, the new scoring system was best modeled as unidimensional. Our findings suggest that the five aspects of the adapted qualitative scoring system cohere to capture a single dimension of substantive quality capturing young children’s ability to generate ideas, respond appropriately to the prompt, use appropriate grammatical structures and transcription skills such as spelling and mechanics.
Given the similarities between the present qualitative scoring system and the scoring system used in Kim’s study, it seems possible that there are substantial differences between the composition abilities of kindergartners and those of the first graders in Kim’s study. The high correlation between the accuracy and macro-organization factors in the present study indicates that measures of these factors covary to such a high degree that they cannot be separated;
because a score of two or higher requires the correct use of punctuation, which is almost always a sentence-ending period. (Few children used commas or other punctuation in their composition.) An alternative but less likely explanation is that this closer link between technical accuracy and macro-organization may be an artifact of the particular scoring system that was used in the present study. Extant research has clearly indicated that the quality of young children’s writing is constrained by their transcription skills such as spelling and handwriting (Graham et al., 1997, Puranik & Al Otaiba, 2012). In other words, macro-organization is constrained by technical accuracy. Consequently, a more plausible explanation of our results of unidimensionality is that these results may indicate a stronger constraining influence of transcription skills for the
kindergarten children in this sample compared to the first graders in Kim’s sample (see Berninger, Mizokawa, & Bragg, 1991, for an explanation of the developmental constraints hypothesis in composition).
In line with previous research, this study demonstrated that the dimensions of
Interestingly, when indicators from the productivity scoring system were included in the model with indicators from the qualitative scoring system, one of the categories from the qualitative scoring system (i.e. the response type category) was correlated with one of the productivity indicators (i.e. the ideas indicator) to such a degree that it had to be dropped from the model to prevent model estimation problems. This indicates that the particular qualitative scoring system used in this study may also have measured some aspects of writing productivity. These characteristics may make the qualitative scoring system particularly useful for educators who want to quickly and easily get a big-picture view of a child’s composition ability. This may be useful for progress monitoring or placing children in ability groupings, as is the suggested use of CBM. However, unlike CBM, this scoring system can capture aspects of the content of
children’s writing, such as how closely related the composition is to a prompt. Furthermore, the scoring system categories are more inherently meaningful than CBM indicators. If a teacher sees that a child’s compositions consistently receive a low score in a particular category, the teacher can plan instruction about (for example) including additional details in writing. Conversely, when a child’s composition consistently receives low CBM scores, it is impossible to tell from the CBM score exactly which aspects of writing should be targeted.
the indicators for productivity and quality dimensions. This may suggest that the CBM indicators share too much variance with the indicators from other factors to be modeled separately. The second reason that the two-factor model may be preferable is that it gives more meaning to the CBM indicators. If a scoring system measures something about writing that is distinct from the components that researchers and educators consider important (such as quality), it is less useful than a scoring system that measures a meaningful component. Considering CBM scores as indicators of meaningful components of writing, such as quality and productivity, rather than considering them as indicators of nothing more than an overall CBM score, assigns the indicators meaning and makes the model more easily interpretable. Of course, due to the relatively poor fit of the models from this paper, future research is necessary to determine how well these CBM indicators actually measure the meaningful components of writing (if at all). Choosing a more interpretable model is not useful if the model does not actually represent the data well.
Previous researchers have questioned the reliability of CBM for young writers (e.g. McMaster & Espin, 2007), despite its prevalence. This questionable reliability may have been one source of the trouble with model fits in this study, particularly since CFA depends on having reliable measures (Kline, 2016). The present study attempted to control for error of measurement by including multiple essays and several measures of each construct, but these attempts were apparently not sufficient for improving an already error-prone measure. Future researchers may need to reconsider the use of CBM for young children’s writing, perhaps replacing it with measures like the qualitative scoring system. The qualitative scoring system used in this study is both quick to administer and inherently meaningful, making it a good candidate for a
Alternatively, the poor fit of the models with CBM indicators may have simply indicated that the models were misspecified. It is possible that CBM indicators are related to quality and productivity indicators in ways that were not tested in this study. However, testing other model specifications would have been outside the scope of the theoretically-based models in this paper.
Indeed, all of the models in this study had relatively low values for model fit indices, and in most cases, even the final models achieved only mediocre fit (Browne & Cudeck, 1993; Hu & Bentler, 1999). The final fit was lower than the minimum values that have been recommended by other experts (e.g. Nye & Drasgow, 2011; Yu & Muthén, 2002). If the more conservative cut-offs for fit indices had been pursued, the models would have included many parameters that were not specified a priori, and this could risk capitalizing on chance associations present in this particular sample but not necessarily representative of the population (Brown, 2015). Conversely, an approach that was more conservative with adding parameters to the models would have resulted in rejecting each model outright, providing little additional information for future researchers. Instead, this paper sought to strike a balance between finding a model that was empirically supported by the present data and finding a model that was similar to the models supported by previous studies.
These challenges reflect the difficulty of assessing writing in general, and they
grades has been shown by other researchers. For example, Jewell and Malecki (2005) found that certain CBM scores were strong predictors of qualitative measures of writing for second-grade students, but not for fourth- and sixth-grade students. Similarly, Parker, Tindal, and Hasbrouck (1991) found that certain CBM scores were suitable as screening measures for struggling writers in fourth grade, but not in the second and third grades. Taken together, the results of these studies indicate that what we know about writers in one grade may not apply to writers in another grade. Accordingly, what we know about first graders, who are also young, beginning writers, does not apply to kindergarten students. However, based on the results of the present study, a qualitative and productivity scoring system appear to be sufficient for measuring kindergarten writing. Furthermore, these measures are easy and quick to administer and score, which is an important consideration for school-based research and in-classroom assessment. These measures appear to measure the components of writing that have previously been identified as important. Therefore, instructional attention to these important aspects of writing (productivity and quality, including accuracy and macro-organization) may be important for facilitating writing in emerging writers in kindergarten.
Limitations and Directions for Future Research
This study has raised several interesting questions about kindergartner’s composition ability that cannot be fully explored with the present data. For example, collecting three or more compositions from children would have allowed for method effects to be included in the model. Including these method effects may have allowed clearer conclusions to be drawn about
productivity indicators of a particular essay would be related, over and above the relation
between the quality indicators from multiple essays by the same participant. Being able to model this relationship with a multi-trait, multi-method model may have significantly improved model fit. However, these types of models require either more than two measurements or stringent assumptions about the structure of the data (Brown, 2015; Widaman, 1985) that may have been unmerited in this case.
The discrepancies between the present paper and previous findings were unexpected given the wealth of research supporting similar factors structures for the compositions of slightly older writers (e.g. Hall-Mills & Apel, 2015; Kim et al., 2014; Kim, Al Otaiba, Wanzek, et al., 2015; Wagner et al., 2011). There are several possible explanations for these differences. The first is that in young children, measurements of complex skills like composition may be inherently error-prone. This problem can sometimes be circumvented by taking several
measurements within a short time span so that additional measures of each indicator type can be included in the model. A second possibility is that the composition skills of kindergartners are qualitatively different from that of first graders, so any model of kindergarten composition that is based on models of first-grade composition will be poorly fit. Future researchers may benefit from taking these considerations into account when planning studies.
writing. Nevertheless, more information about the dimensionality of writing in kindergarten (compared to that of other grades) may have been offered by different or additional measures.
Another limitation of this study may be the timing of the assessments. It may have been preferable to collect text generation measures at the same time of year as the transcription and composition assessments. Having a text generation measure that was collected closer in time to the actual composition task may have presented a different picture of the relations among these variables.
Finally, this study used only one type of composition measure. Children were given a prompt and a short span of time to write about the prompt. This means that any conclusions drawn about the dimensionality of composition ability may only apply to children’s ability to compose spontaneously over a short time frame. This is one of the most common measures of composition ability for young children (e.g. Abbott & Berninger, 1993; Berninger et al., 2002; Graham, Harris, & Fink, 2000; Kent et al., 2014; Kim, Al Otaiba, & Wanzek, 2015; Wagner et al., 2011), probably because it may give the purest picture of a child’s independent ability. However, other researchers have sometimes included other measures of writing ability in CFAs; for example, Kim, Al Otaiba, Wanzek, et al. (2015) included the child’s score on a standardized measure of writing fluency. Including scores from a child’s compositions for school assignments (either with or without editing help from a teacher or parent) may also provide an interesting supplement to future research.
This study contributes additional knowledge in the field of writing assessment. It
References
Abbott, R. D., & Berninger, V. W. (1993). Structural equation modeling of relationships among developmental skills and writing skills in primary- and intermediate-grade writers.
Journal of Educational Psychology, 85(3), 478-508. https://doi.org/10.1037/0022-0663.85.3.478
ACT, Inc. (2018). ACT College & Career Readiness Standards: Writing. Retrieved from http://www.act.org/content/dam/act/unsecured/documents/CCRS-WritingStandards.pdf Bandalos, D. L. (2014). Relative performance of categorical diagonoally weighted least squares
and robust maximum likelihood estimation. Structural Equation Modeling: A Multidisciplinary Journal, 21(1), 102-116.
https://doi.org/10.1080/10705511.2014.859510
Berninger, V. W., Fuller, F., & Whitaker, D. (1996). A process model of writing development across the life span. Educational Psychology Review, 8(3), 193-218.
https://doi.org/10.1007/BF01464073
Berninger, V. W., Mizokawa, D. T., & Bragg, R. (1991). Theory-based diagnosis and remediation of writing disabilities. Journal of School Psychology, 29(1), 57-79. https://doi.org/10.1016/0022-4405(91)90016-K
Berninger, V. W., Yates, C. M., Cartwright, A. C., Rutberg, J., Remy, E., & Abbott, R. D. (1992). Lower-level developmental skills in beginning writing. Reading and Writing, 4(3), 257-280. https://doi.org/10.1007/BF01027151
Bouwer, R., Béguin, A., Sanders, T., & van den Bergh, H. (2015). Effect of genre on the generalizability of writing scores. Language Testing, 32(1), 83-100.
Brown, T. A. (2015). Confirmatory Factor Analysis for Applied Research (2nd ed.). New York:
Guilford Press.
Browne, M. W. & Cudeck, R. (1993). Alternative ways of assessing model fit. In K. A. Bollen & J. S. Long (Eds.) Testing Structural Equation Models (pp. 136-162). Newbury Park, CA: SAGE Publications.
Coe, M., Hanita, M., Nishioka, V., & Smiley, R. (2011). An investigation of the impact of the 6
+ 1 Trait Writing model on grade 5 student writing achievement (NCEE 2012-4010).
Washington, DC: National Center for Education Evaluation and Regional Assistance, Institute of Education Sciences, U.S. Department of Education.
Coker, D. L., & Ritchey, K. D. (2010). Curriculum-based measurement of writing in kindergarten and first grade: An investigation of production and qualitative scores.
Exceptional Children, 76(2), 175-193. https://doi.org/10.1177/001440291007600203
Deno, S. L. (2003). Developments in curriculum-based measurement. The Journal of Special
Education, 37(3), 184-192. https://doi.org/10.1177/00224669030370030801
Education Northwest. (2017). 6+1 Trait® Rubrics. Retrieved from http://educationnorthwest.org/traits/traits-rubrics
Finney, S. J., & DiStefano, C. (2013). Nonnormal and categorical data in structural equation modeling. In G. R. Hancock & R. O. Mueller (Eds.), Structural Equation Modeling: A Second Course (2nd ed., pp. 439-492). Charlotte, N.C.: Information Age Pubishing. Gansle, K. A., VanDerHeyden, A. M., Noell, G. H., Resetar, J. L., Williams, K. L. (2006). The
Georgia Department of Education (2015). Kindergarten English Language Arts Georgia
Standards of Excellence (ELA GSE). Retrieved from
https://www.georgiastandards.org/Georgia-Standards/Frameworks/ELA-Kindergarten-Standards.pdf
Graham, S., Berninger, V. W., Abbott, R. D., Abbott, S. P., & Whitaker, D. (1997). Role of mechanics in composing of elementary school students: A new methodological approach.
Journal of Educational Psychology, 89(1), 170-182. https://doi.org/10.1037/0022-0663.89.1.170
Graham, S., Harris, K. R., & Fink, B. (2000). Is handwriting causally related to learning to write? Treatment of handwriting problems in beginning writers. Journal of Educational
Psychology, 92(4), 620-633. https://doi.org/10.1037//0022-0663.92.4.620
Hall-Mills, S. (2010). Linguistic feature development in elementary writing: Anlaysis of microstructure and macrostructure features in a narrative and an expository genre (Unpublished doctoral dissertation). Florida State University, Tallahassee.
Hall-Mills, S., & Apel, K. (2015). Linguistic feature development across grades and genre in elementary writing. Language, Speech & Hearing Services in Schools, 46, 242-255. https://doi.org/10.1044/2015_LSHSS-14-0043
Hosp, M. K., Hosp, J. L., & Howell, K. W. (2007). The ABCs of CBM: A practical guide to
curriculum-based measurement (2nd ed.). New York: Guilford Press.
Hu, L. & Bentler, P. M. (1999). Cutoff criteria for fit indexes in covariance structure analysis: Conventional criteria for new alternatives. Structural Equation Modeling: A
Jewell, J. & Malcki, C. K. (2005). The utility of CBM written language indices: An investigation of production-dependent, production-independent, and accurate-production scores.
School Psychology Review, 34(1), 27-44. https://doi.org/
Juel, C., Griffith, P. L., & Gough, P. B. (1986). Acquisition of literacy: A longitudinal study of children in first and second grade. Journal of Educational Psychology, 78(4), 243-255. https://doi.org/10.1037/0022-0663.78.4.243
Kent, S., Wanzek, J., Petscher, Y., Al Otaiba, S., & Kim, Y.-S. G. (2014). Writing fluency and quality in kindergarten and first grade: The role of attention, reading, transcription, and oral language. Reading and Writing, 27(7), 1163-1188. https://doi.org/10.1007/s11145-013-9480-1
Kim, Y.-S. G., Al Otaiba, S., Folsom, J. S., Greulich, L., & Puranik, C. S. (2014). Evaluating the dimensionality of first-grade written composition. Journal of Speech, Language, and
Hearing Research, 57, 199-211. https://doi.org/10.1044/1092-4388(2013/12-0152)
Kim, Y.-S. G., Al Otaiba, S., Puranik, C. S., Folsom, J. S., Greulich, L., & Wagner, R. K. (2011). Componential skills of beginning writing: An exploratory study. Learning and Individual Differences, 21(5), 517-525. https://doi.org/10.1016/j.lindif.2011.06.004
Kim, Y.-S. G., Al Otaiba, S., & Wanzek, J. (2015). Kindergarten predictors of third grade writing. Learning and Individual Differences, 37, 27-37.
https://doi.org/10.1016/j.lindif/2014.11.009
Kim, Y.-S. G., Gatlin, B., Al Otaiba, S., & Wanzek, J. (2018). Theorization and an empirical investigation of the component-based and developmental text writing fluency construct.
Journal of Learning Disabilities, 51(4), 320-335. https://doi.org/10.1177/0022219417712016
Kim, Y.-S. G., Park, C., & Park, Y. (2013). Is academic language use a separate dimension in beginning writing? Evidence from Korean. Learning and Individual Differences, 27, 8-15. https://doi.org/10.1016/j.lindif.2013.06.002
Kim, Y.-S. G., Park, C., & Park, Y. (2015). Dimensions of discourse level oral language skills and their relation to reading comprehension and written composition: an exploratory study. Reading & Writing, 28, 633-654. https://doi.org/10.1007/s11145-015-9542-7 Kline, R. B. (2016). Principles and Practice of Structural Equation Modeling (4 ed.). New York:
Guilford Press.
Komsta, L., & Novomestky, F. (2015). Moments: Moments, cumulants, skewness, kurtosis and related tests. Retrieved from https://CRAN.R-project.org/package=moments
Lerkkanen, M.-K., Rasku-Puttonen, H., Aunola, K., & Nurmi, J.-E. (2004). Predicting reading performance during the first and the second year of primary school. British Educational
Research Journal, 30(1), 67-92. https://doi.org/10.1080/01411920310001629974
MacCallum, R. (1986). Specification searches in covariance structural modeling. Psychological Bulletin, 100(1), 97-120. https://doi.org/10.1037/0033-2909.100.1.107
Marsh, H. W., Hau, K.-T., Balla, J. R., Grayson, D. (1998). Is more ever too much? The number of indicators per factor in confirmatory factor analysis. Multivariate Behavioral
McMaster, K. L., Du, X., Yeo, S., Deno, S. L., Parker, D., & Ellis, T. (2011). Curriculum-based measures of beginning writing: Technical features of the slope. Exceptional Children, 77(2), 185-206. https://doi.org/10.1177/001440291107700203
McMaster, K., & Espin, C. (2007). Technical Features of Curriculum-Based Measurement in Writing: A Literature Review. The Journal of Special Education, 41(2), 68-84. https://doi.org/10.1177/00224669070410020301
Muthén, L. K., & Muthén, B. O. (2017). Mplus (Version 8.1). Retrieved from https://www.statmodel.com/index.shtml
Nelson, N. W., & Van Meter, A. M. (2007). Measuring written language ability in narrative samples. Reading & Writing Quarterly, 23(3), 287-309.
https://doi.org/10.1080/10573560701277807
Nye, C. D. & Drasgow, F. (2011). Assessing goodness of fit: Simple rules of thumb simply do not work. Organizational Research Methods, 14(3), 548-570.
https://doi.10.1177/1094428110368562
Olinghouse, N. G. (2008). Student- and instruction-level predictors of narrative writingn in third-grade students. Reading & Writing, 21, 3-26. https://doi.org/10.1007/s11145-007-9062-1 Parker, R., Tindal, G., & Hasbrouck, J. (1991). Countable indices of writing quality: Their
suitability for screening-eligibility decisions. Exceptionality: A Special Education Journal, 2(1), 1-17. https://doi.org/10.1080/09362839109524763
Puranik, C. S., Al Otaiba, S., Sidler, J. F., & Greulich, L. (2014). Exploring the amount and type of writing instruction during language arts instruction in kindergarten classrooms.
Reading and Writing, 27(2), 213-236. https://doi.org/10.1007/s11145-013-9441-8 Puranik, C. S., Lombardino, L. J., & Altmann, L. J. P. (2008). Assessing the microstructure of
written language using a retelling paradigm. American Journal of Speech Language Pathology, 17, 107-120. https://doi.org/10.1044/1058-0360(2008/012)
RStudio Team. (2016). RStudio: Integrated Development for R (Version 1.0.136). Boston, MA: RStudio, Inc. Retrieved from http://www.rstudio.com
Rugg, G. (2007). Using Statistics: A Gentle Introduction. Berkshire, UK: McGraw-Hill House. Schreiber, J. B., Nora, A., Stage, F. K., Barlow, E. A., King, J. (2006). Reporting structural
equation modeling and confirmatory factor analysis results: A review. The Journal of
Educational Research, 99(6), 323-338. https://doi.org/10.3200/JOER.99.6.323-338
Tindal, G., & Parker, R. (1989). Assessment of written expression for students in compensatory and special education programs. The Journal of Special Education, 23(2), 169-183. https://doi.org/10.1177/002246698902300204
Wagner, R. K., Puranik, C. S., Foorman, B. R., Foster, E., Wilson, L. G., Tschinkel, E., & Kantor, P. K. (2011). Modeling the development of written language. Reading and Writing, 24(2), 203-220. https://doi.org/10.1007/s11145-010-9266-7
Widaman, K. F. (1985). Hierarchically nested covariance structure models for multitrait-multimethod data. Applied Psychological Measurement, 9(1), 1-26.
Table 1
Final Models of Writing Dimensionality from Recent Studies
Study
Participants’ Grade Level
Statistical Method
Used Factors Explored Indicators Hall-Mills
and Apel (2015)
2nd-4th EFA Productivity Total words
Total T-units
Number of different words
Grammatical Complexity
Mean length of T-unit Clauses per sentence Clause density
Grammatical accuracy
Percentage of grammatical sentences Grammatical errors per T-unit
Lexical diversity Lexical density (proportion of content words to total words)
Macrostructure Organization
Text structure Cohesion
Kim et al. (2014)
1st CFA Quality Ideas
Organization Word choice Sentence fluency Spelling and Writing Conventions Spelling Mechanics (capitalization, punctuation) Handwriting neatness
Productivity Number of words
Number of different words Number of ideas
Syntactic complexity
Mean length of T-unit Clause density
Kim, Al Otaiba, Wanzek, et al. (2015)
2nd-3rd CFA Quality Idea quality
Organization
CBM %CWS
CIWS
Productivity Number of words
Number of ideas
Puranik et al. (2008)
3rd-6th EFA Productivity Number of words