Is Your Love Ruined By Work? -A Study on the
perception of working Married Couples of Dakshina
Kannada District.
Saleen K J
Research Scholar, Department of P.G Studies &Research in Social Work, TumkurUniversity, Tumkur.
DOI: 10.29322/IJSRP.9.03.2019.p8713
http://dx.doi.org/10.29322/IJSRP.9.03.2019.p8713
Abstract- Maintaining a healthy relationship for a long period is the biggest challenge that people face in their life. There are so many factors that affect the status of the relationship of married couples. A good job affords the income which helps to survive and also offers some level of personal fulfillment among the married working couples. But unfortunately work can also negatively influence theirmarital lives. Working couples often complain about the relationship problems such as spending less time with each other, not collaborating in house hold cores, late night meetings and other problems which can ruin marital relationship. So this is one the worst side effects of being employed. The couples who are not able to separate professional stress from their personal life may cause damage to their marital life. To avoid those conflicts, the couples need to manage their work as well as personal lives simultaneously. So this paper aims to find out whether love between the married couples is ruined by their work and to understand the good work-life balance among the married couples.
Index Terms- Personal fulfillments, marital relationship, working couples, work-life balance
I. INTRODUCTION
good marriage is one of the life-factors most strongly associated and consistently associated with happiness. A successful married life is realized when the two individuals respect their own values and principles whole-heartedly and have mutual interest. Good married couples have commitment towards each other and co-operate with one another. They are also interested in important things such as goals and values which help them to create and maintain their relationship for long time. The most important factors such as emotional bonds of love and trust and genuine friendship between spouses contribute to the long-term maintenance of the marital relationship. It is very important to married couples to set aside some time for each other in order to maintain and build on the marital bonds.There are several factors that will cause for marital breakdown among the couples. Some of the important factors are lack of love, lack of mutual understanding, psychological factors, financial problems, lack of good work-life balance among the married couples etc.
At present both husband and wife plays an equal role in work activities and their domestic responsibilities. But there are
many health implications of working for long hours such as poorer sleep levels, signs of depression and the chances of having heart problems. Apart from these effects, there are some negative pressures on family time. The person who is married to their job and the incredibly long hours results in tremendous strain on their relationship with both their spouse and their children. India is experiencing rapid changes in family relationships and marriage due to the fast growth of IT industries. The earlier research says that Information Technology employees are been filing the divorce cases more rather than rest of the sectors.
Work is taking over the lives of many in today’s life. Increase in work –life imbalance results in increase in family conflicts among the married couples. This kind of conflicts ruin love between the married couples and it may cause adversely on healthy marital life. One the worst side effects of working married couples is that that they complain about the relationship problems such as spending less time with each other, not collaborating in house hold cores, late night meeting and other problems which can ruin the love between them. In order to avoid such kind of conflicts, the couple should create a good work-life balance. Thus work-life balancing may be considered as a sincere attempt which will definitely yield fruitful results.
II. OBJECTIVES OF THE STUDY:
• To study the working condition of married couples and its effect on personal lives
• To find out whether love between the married couples is ruined by their work
• To understand the good work-life balance among the married couples.
• To address remedial measures and recommendation based on the research findings.
III. RESEARCH METHODOLOGY:
secondary sources such as internet, journals and magazines, etc. were also used for the purpose of study.
Tools for Data Collection: • Questionnaire Tools for Data Analysis:
• Tables • Pie diagram
[image:2.612.97.509.233.501.2]IV. DATA ANALYSIS AND INTERPRETATIONS: Socio-demographic profile of the respondents:
Table 1: Gender wise distribution of the sample
Sl No. Gender No. of respondents %
1 Male 22 34
2 Female 43 66
Total 65 100
Chart 1: Gender wise distribution of the sample
The above chart depicts gender wise distribution of the sample. 66% of the respondents are female and 34% of the respondents are female.
Table 2: Age wise distribution of the sample
Sl No. Age No. of respondents %
1 Below 20 02 03
2 20-25 10 15
3 26-30 20 31
4 31-35 14 22
5 35 & above 19 29
34%
66%
Male
Total 65 100
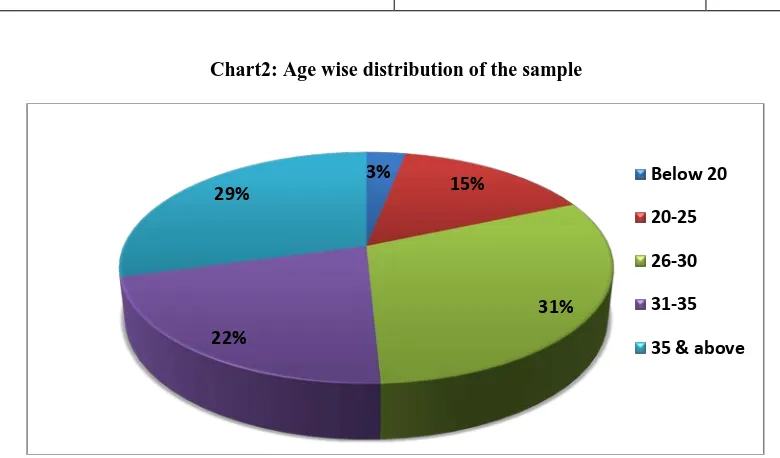
Chart2: Age wise distribution of the sample
[image:3.612.108.498.79.308.2]Chart 2 presents age wise distribution of the sample. Majority (31%) of the respondents belongs to the age group of 26-30 and only 3% of the respondents are below the age of 20. This shows that the research highly speaks about perception of young married couples who are working in different sectors.
Table 3: Response towards type of family
Sl No. Types of family No. of respondents %
1 Nuclear family 37 57
2 Extended family 05 08
3 Joint family 23 35
Total 65 100
Chart3: Response towards type of family
3% 15%
31% 22%
29% Below 20
20-25 26-30 31-35 35 & above
57%
8% 35%
Nuclear
The above table and chart reveals that majority (57%) of the respondents are living in nuclear family and less number of respondents that is 8% are living in extended family. This given us a clear idea that most of the married couples prefers to live in nuclear family where they least bothered about staying with their parents
Table 4: Response towards type of marriage
Sl No. Type of marriage No. of respondents %
1 Love marriage 16 75
2 Arranged marriage 49 25
Total 65 100
Chart4: Response towards type of marriage
[image:4.612.81.531.536.691.2]The above chart gives us respondents response towards type of marriage. Majority (75%) of the respondents opted for arranged marriage and only 25% of the respondents opted love marriage. This shows that majority of the respondents opted for arranged marriage than that of love marriage.
Table 5: Occupation wise distribution of sample
Sl No. Occupations No. of respondents %
1 Government employee 08 12
2 Private employee 45 69
3 Self employed 11 17
4 Any other 01 02
Total 65 100
25%
75%
Chart5: Occupation wise distribution of sample
The above chart depicts about occupation of the respondents. Majority (69%) of the respondents are private employees and only 12 % of the respondents are working in Government sectors Thus it shows that the study has collected more data from the respondents those who are working in the private sector where they are often asked to work late.
Is your Love ruined by work?
[image:5.612.120.499.74.262.2]The Questionnaire also consists some of the questions which directly aims at studying the present research objectives. Following data and analysis and interpretations provide an insight into the main objectives of the research
Table 6: Response towards how often do you find that you have to work late
Sl No. Particulars No. of respondents %
1 Rarely 17 26
2 Once a week may be 29 45
3 Multiple times every week 19 29
Total 65 100
Chart 6: Response towards how often do you find that you have to work late
Chart 6 gives a result about the respondents’ response towards how often they find that they have to work more. Majority (45%) of the respondents said that once in week they have to work late and less number of respondents that is only 26% is rarely find that they have to work late. This shows that once in a week they are getting late from their work place.
12%
69% 17%
2%
Government employee Private employee Self employed Any other
26%
45% 29%
Rarely
Once a week may be
Table 7: Response towards when it comes to working late, do you feel like you have a choice in the matter?
Sl No. Particulars No. of respondents %
1 Yes I can talk to my boss freely about workload
07 11
2 Sometimes, sometimes not 24 37
3 No 34 52
Total 65 100
Chart 7: Response towards when it comes to working late, do you feel like you have a choice in the matter?
[image:6.612.84.532.500.627.2]The above chart 7 shows the response towards when it comes to working late, do they feel like they have a choice in that matter. Majority (52%) of the respondents responded that they don’t have such an option. Only 11% of them said that they can talk with their boss freely about workload. This shows that majority of married couples are not having choice regarding workload where, they have to work late to complete their given task.
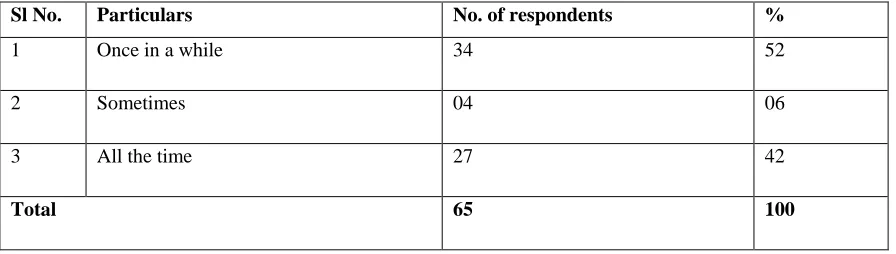
Table 8: Response towardsdo you and your partner ever argue about how much time you spend in working?
Sl No. Particulars No. of respondents %
1 Once in a while 34 52
2 Sometimes 04 06
3 All the time 27 42
Total 65 100
11%
37% 52%
Yes I can talk to my boss freely about workload Sometimes, sometimes not
Chart8: Response towards do you and your partner ever argue about how much time you spend in working?
[image:7.612.130.485.80.243.2]The chart shows the response towards whether they argue with their partner about how much time they spend in working. Majority (52%) of the respondents argues once in a while about spending time in working and 42% of the respondents argue all the time. Less number of respondents that is only 6% of them argues sometimes. This shows that most of the working couples argue about their work, leading to conflicts between the couples, resulting in damage to the marital relationship time which will also cause for reducing love between them.
Table 9: Response towardswhen was the last time you and your partner had the time for a date night?
Sl No. Particulars No. of respondents %
1 In the past couple of weeks 13 20
2 In the past couple of months 39 60
3 I can’t remember 13 20
Total 65 100
Chart9:Response towardswhen was the last time you and your partner had the time for a date night?
The above chart depicts the response towards when they had the time for a date night. For this majority (60%) of them responded that they had date night with their partner in the past couple of months. 20% respondents said that they had date night in the past couple
52%
6% 42%
Once in a while Sometimes All the time
20%
60% 20%
In the past couple of weeks
In the past couple of months
of weeks and remaining 20% of the respondents can’t remember about that. This gives a clear result that because of the workload and other things, couples are not getting time for date night which ultimately ruins their love.
Table 10: Response towardswhat are things like when you and your partner do actually spend time together?
Sl No. Particulars No. of respondents %
1 Great 11 17
2 OK most of the time 45 69
3 We argue a lot 09 14
Total 65 100
Chart 11: Response towardswhat are things like when you and your partner do actually spend time together?
The above chart depicts response towards what are things like do actually when they spend time together. Majority (69%) of the respondents are ok most of the time when they spend time together. Only 14% of the respondents argue a lot when they spend time together. This data shows that majority of working couples are not caring each other when they spend time together.
Table 11: Response towardsdo you look forward to coming home at the end of the day?
Sl No. Particulars No. of respondents %
1 Yes, very much 11 17
2 Yes, sometimes it is really pretty late 42 65
3 I’m just focused on getting my work done 12 18
Total 65 100
17%
69%
14% Great
OK most of the time
[image:8.612.84.533.570.697.2]Chart11: Response towardsdo you look forward to coming home at the end of the day?
[image:9.612.126.488.75.247.2]Chart 11 shows respondents response towards whether they look forward to come home at the end of day. For this majority (65%) of the respondents responded that they look into this and sometimes it is really pretty late and only 18% of the respondents are just focused on getting their work done. This shows that majority of the working couples even though they look forward to coming home at the end of the day, they are late to home.
Table 12 Response towards if your partner asked you to work less, would you.
Sl No. Particulars No. of respondents %
1 Seriously consider what they’re saying and talk about it
06 09
2 Do it if nagged enough 15 23
3 Tell them I don’t have a choice 44 68
Total 65 100
Chart 12: Response towards if your partner asked you to work less, would you..
17%
65%
18% Yes, very much
Yes, sometimes it is really pretty late
I’m just focused on getting my work done
9%
23%
68%
Seriously consider what they’re saying and talk about it
Do it if nagged enough
Charts 12 presents response towards if their partner asked them work less, what they will respond. Majority 68% of the respondents responded that they will tell their partner that they don’t have choice other than job. Only 9% of the respondents responded that they will seriously consider what their partner is saying. This shows that most of the working couples do not want to leave their job for the sack of their partner resulting in clashes between them.
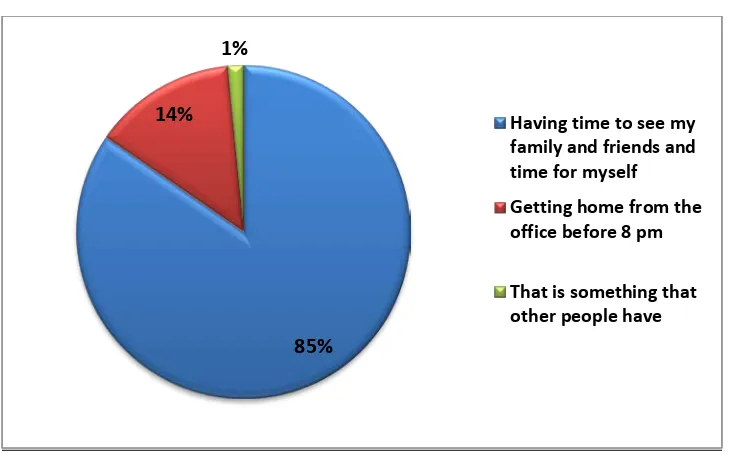
Table 13: Response towards what does a ‘good work-life balance’ mean to you?
Sl No. Particulars No. of respondents %
1 Having time to see my family and friends and time for myself
55 85
2 Getting home from the office before 8 pm 09 14
3 That is something that other people have 01 01
Total 65 100
Chart 13: Response towards what does a ‘good work-life balance’ mean to you?
The above chart shows the response towards what a ‘good work-life balance’ does. For this majority (85%) of the respondents responded that having time to see their family and friends and time for them is a ‘good work-life balance’. Only 1% of the respondents say that it is something that other people have. This gives clear result that spending time to see their family, friends and for themselves is a good work-life balance.
V. FINDINGS:
1. The study reveals that majority (57%) of the respondents are living in nuclear family and less number of respondents that is 8% are living in extended family. This shows that most of the married couples prefer to live in nuclear family and they are least bothered about staying with their parents
2. The study shows that majority (75%) of the respondents have opted arranged marriage and only 25% of the respondents are opted love marriage.
3. From the study it is clear that majority (69%) of the respondents are private employees and 45% them responded that once in a week they have to work late 4. The study depicts that majority (52%) of the respondents
don’t havea choice towards when it comes to working late and they argue once in a while with their partner about spending time in working
5. The study reveals majority (60%) of the respondents had date night with their partner in the past couple of months. It gives a clear result that because of the workload and other things, couples are not getting time for date night which ultimately ruins their love. The study also reveals that majority (69%) of the respondents are ok most of the time when they spend time together.
85% 14%
1%
Having time to see my family and friends and time for myself Getting home from the office before 8 pm
6. It is understood from the study that, majority (65%) of the respondents looks forward to coming home at the end of the day and sometimes it is really pretty late.
7. The study reveals that majority (68%) of the respondents will tell their partner that they don’t have choice other than job, if their partner ask them to works less.
8. From the study it is understood about the meaning of a ‘good work-life balance’. For this majority (85%) of them responded that having time to see their family and friends and time for them is a ‘good work-life balance’.
VI. SUGGESTIONS:
1. There should be a flexible working schedule to the working married couples.
2. Married couples should spend some of their quality time with their partner which will reduce clashes between the couples and resulting in happy marital life
3. There is a need to conduct a family counseling programs to married working couples at least once in a year in order to build mutual understanding between the couples regarding ‘good work-life balance’.
VII. CONCLUSION:
In today’s world, due to rapid increase in high rate of unemployment, people are taking whatever the jobs they can find- even undesirable jobs such as late work and low salary. This kind of work situation can create lot of misunderstanding between the married couples regarding spending time together, looking after the children etc. From the present study it is clear that the unpleasant work condition ruins love between married couples.
REFERENCES
[1] Adi Gaskell, 2016, ‘The Impact of Long Hours on Our Relationships’, www.forbes.com
[2] Vinodh Kumar G.C, 2013 , ‘Information Technology Professionals and Family Disorganization: With Special Reference to Bangalore City’ , http://www.ijhssi.org
[3] https://www.businessinsider.in/16-signs-your-job-is-ruining-your-marriage/articleshow/51351804.cms
[4] https://www.ctvnews.ca/health/do-long-working-hours-affect-relationship-happiness-not-according-to-a-new-study-1.2731005
AUTHORS