ISSN 2250-3153
Water Quality Assessment of River Ganga Health
Hazard Identification and Control
Singh Rajesh1, Bahukhandi Kanchan 2, Mondal Prasanjeet 3 Singh Satendra4
1
National Institute of Hydrology, Roorkee, Uttarakhand, India
2
University of Petroleum and Energy Studies, Dehradun, Uttarakhand, India
3
University of Petroleum and Energy Studies, Dehradun, Uttarakhand, India
4
University of Petroleum and Energy Studies, Dehradun, Uttarakhand, India
Abstract- The present project ‘Water Quality Assessment of river Ganga Health Hazard Identification and control’ includes tests for, pH value, Electrical Conductivity, Total Dissolve Solid, Hardness, Alkalinity, Chloride, Nitrate, Sulphate, Iron, Sodium, Potassium, Calcium and Magnesium. Result was compared with drinking water standard prescribed by BIS 10500-2012 and all parameters satisfied the prescribed limit given in BIS standard for drinking water. Water Quality of river Ganga from Gangotri to Haridwar is found Pollution free. Spatial variation in river water quality is shown by Quality Contour Map by using Surfer Software 9.0 version. Maximum water quality deviation from mean value is observed at Haridwar which shows the adverse impact of Industrialization, Urbanisation and Rapid growth of population on the river water quality.
Index Terms- water quality, IS: 10500, Electrical Conductivity, Total Dissolve Solid, Hardness, Alkalinity, Chloride, Nitrate, Sulphate, Iron, Sodium, Potassium, Calcium, Magnesium, Surfer 9.0.
I. INTRODUCTION
he River Ganga is a perennial river originating from the Himalayas and flowing through many states before its confluence with Bay of Bengal. The Ganga basin accounts for a little more than one-fourth (26.3%) of the country’s total geographical area and is the biggest river basin in India. Ganga plain is one of the most densely populated regions of the world, due to its availability of water, fertile soil and suitable landscapes.
The Ganga has been worshipped by Indians from time immemorial and the practice still continues. The water of the Ganga was considered to be holy, having powers to rid us from all our sins it is also used for various purposes such as drinking, bathing, power generation, recreation, community water supply, irrigation etc. This water is being polluted by indiscriminate disposal of sewage, industrial waste and human activities which affect quality of river water. The increased anthropogenic
activities (Praveen et al. 2012) large scale deforestation and over grazing in the watershed areas of river basins is having adverse impact on river water quality and is affecting the flora and fauna (Joshi et al. 2009). It is a fact that good water quality produces healthier humans. Freshwater scarcity ranks among the most urgent environmental challenges of this century. To water resources management and pollution mitigation plan it is essential to be have relevant information on water quality status and trend to describe overall water quality conditions. Therefore it is necessary to monitor and assess the water quality of River Ganga.
It is of utmost importance that the River Ganga be restored to its past glory. It is an urgent need to improve its water quality; this can be achieved by regular monitoring and assessment of water quality. A conscious effort towards reversing the current trends of deterioration of water quality of Ganga is the need of the hour. However, the ability to properly track progress toward minimizing impacts on natural environments and improving access of humans to safe water depends on the availability of data that document trends. As such assessing of water quality of River Ganga is a necessary activity at all governing levels: local, national. Keeping these facts in mind current study focused on assessments including approaches to their identification, analysis and resolution of current water quality status and trends of river Ganga from Gangotri to Haridwar.
II. MATERIAL AND METHODS
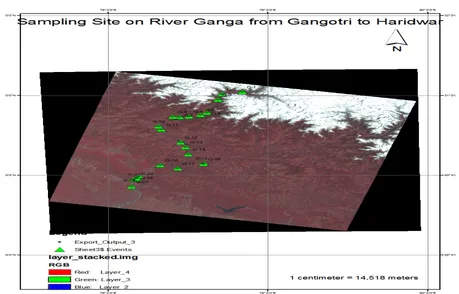
A total number of 23 samples were collected of river Ganga from approximate length of 254 Km starting from Gangotri to Bishanpur (Haridwar) and analysed. The samples were collected during winter period with their GPS coordinates during December 2014 and preserved by adding an appropriate reagent (Jain and Bhatia, 1988; APHA, 1992) Full care has been taken to ensure obtaining a sample that is truly representative. Further, the integrity of the sample was maintained from the time of collection to the time of analysis. Descriptions of River water sampling location along with their GPS coordinates are given in
ISSN 2250-3153
Table 2.1 and these location are also shown in satellite map fig 2.1
[image:2.612.68.547.416.728.2]Fig 2.1 Sampling site on satellite map of river Ganga
Table-2.1 Sampling Sites-
Code Location Long. Lat. Hight (m) Distance(Km)
G-1 Jangla Bridge 78.84065833 31.0433278 2585 0
G-2 Jhala Bridge 78.71349861 31.0159611 2378 26.490613
G-3 Dabrani Bridge 78.68833889 30.9462333 1966 34.699657
G-4 UK Laghu Vidhut Pariyojna 78.61881389 30.7853278 1430 54.332124
G-5 Nalluna Senj 78.578 30.756875 1320 54.332124
G-6 After Heena Power Station 78.50666667 30.7362603 1208 66.772303
G-7 u/s Uttarkashi 78.44674722 30.7295 1076 75.606229
G-8 d/s Uttarkashi 78.43944444 30.7258333 1106 76.264219
G-9 Badethi Chungi 78.43944444 30.7303528 1053 79.404703
G-10 Dharashu 78.31622222 30.6106639 815 99.205983
G-11 Chinyalisaur 78.332475 30.5745333 790 103.34455
G-12 Tehri Reservoir (Koti colony) 78.45367778 30.4123139 792 125.445578
G-13 Zero Bridge Tehri 78.48515 30.3527278 561.95 133.415968
G-14 Downsream of Koteswar PP 78.50085556 30.2625472 518 144.180048
G-15 Bhagirathi Devprayag 78.59858611 30.1510139 462 160.430282
G-16 Ganga Devprayag 78.59638611 30.1407139 365.48 161.979644
G-17 Lakundi Shiv Chula 78.435275 30.0858028 321 187.707604
ISSN 2250-3153
G-19 Saptrishi Ashram 78.19606389 29.9871056 243.308 226.962528
G-20 Bhimgowada Barrage 78.17639444 29.9698833 242.42 229.997382
G-21 Khadkhadi 78.16209167 29.947425 236.59 232.421654
G-22 Gujrawala Bhawan 78.17800833 29.9573194 234 242.092785
G-23 Bisanpur village 78.14702222 29.8577361 217.5 254.712282
Software Arc GIS 9.3 and Surfer 9 are used for Showing
the study area and sampling location and plotting the Water Quality Parameter status graph and their trend respectively. Water sample analysis was performed as per standard method (Jain and Bhatia, 1988; APHA, 1992) at National Institute of Hydrology, Roorkee laboratory (An ISO 9001-2008 Certified)
[image:3.612.73.538.252.425.2].The details of analytical method and equipment used in the study are described in Table 6. Ionic balance was calculated, the error in the ionic balance for majority of the samples was within 5%. The total number of selected parameters is thirteen for assessing water quality of river Ganga.
Table 2.2 Details of the analytical method and equipment used in the study
Parameter Method Instrumentation and Apparatus
pH Electrometric pH Meter
Conductivity Electrometric Conductivity Meter
TDS Electrometric Conductivity Meter/TDS Meter
Alkalinity Titration by H2SO4 -
Hardness Titration by EDTA -
Chloride Titration by AgNO3 -
Sulphate Turbidimetric Turbidity Meter
Nitrate Ultraviolet Screening UV-VIS Spectrophotometer
Sodium Flame Emission Flame Photometer
Potassium Flame Emission Flame Photometer
Calcium Titration by EDTA -
Magnesium Titration by EDTA -
Iron Spectrophotometric Spectrophotometer
III. ANALYSES AND INTERPRETATION OF DATA
ISSN 2250-3153
Table-3.1 Compliance of River Water Quality with BIS Standard
Parameters Acceptable Limit Allowable Limit Water Quality of River
Ganga
pH 6.5-8.5 No Relaxation Within Limit
Conductivity - 1,500 µs/cm (WHO) Within Limit
TDS 500 2000 Within Limit
Alkalinity 200 600 Within Limit
Hardness 200 600 Within Limit
Chloride 250 1000 Within Limit
Sulphate 200 400 Within Limit
Nitrate 45 No Relaxation Within Limit
Sodium 200 (WHO) - Within Limit
Potassium 10 (WHO) - Within Limit
Calcium 75 200 Within Limit
Magnesium 30 100 Within Limit
ISSN 2250-3153
Table 3.2 Physico-chemical characterization of River Ganga Samples
Sample Code
Location pH. EC
(µs /cm)
Alkalinity (mg/L)
Hardness (mg/L)
Cl (mg/L)
NO3 (mg/L)
Na (mg/L)
K (mg/L)
Ca (mg/L)
Mg (mg/L)
Fe (mg/L)
TDS (mg/l)
SO4 (mg/l)
G-1 Jangla Bridge 5.9 212 51 84 0.2 7 4.4 1.6 23 6 0.5 136 57
G-2 Jhala Bridge 5.8 175 43 85 4.2 8.8 3.9 1.6 20 9 0.17 112 44
G-3 Dabrani Bridge 6.2 171 41 75 0.8 8.4 3.9 1.7 18 7 0.16 109 37
G-4 UK Laghu Vidhut Pariyojna 6.2 174 47 71 0.8 5.3 5.1 1.9 19 6 0.21 111 40
G-5 Nalluna Senj 6.5 167 47 70 1.4 1.3 4.8 1.9 19 6 0.06 107 36
G-6 After Heena Power Station 6.4 169 45 68 0.4 4.8 5.1 1.9 18 5 0.08 108 33
G-7 u/s Uttarkashi 6.6 169 46 68 2.2 6.6 4.8 2 19 5 0.07 108 30
G-8 d/s Uttarkashi 6.7 168 47 72 1.8 6.6 4.7 2 20 6 0.06 108 32
G-9 Badethi Chungi 6.4 168 51 73 1.2 8.8 4.3 1.8 18 7 0.07 108 26
G-10 Dharashu 6.5 177 47 76 2 7 4.5 1.7 20 6 0.09 113 24
G-11 Chinyalisaur 6.6 89 33 14 0.2 18 1.7 1.1 12 2 0.15 57 14
G-12 Tehri Reservoir (Koti colony) 6.6 96 34 43 0 13 1.7 1.3 11 4 0.18 61 17
G-13 Zero Bridge Tehri 6.4 94 55 41 1.2 3.1 1.8 1.1 11 3 0.27 60 13
G-14 Downsream of Koteswar PP 6.5 100 34 43 1.4 1.7 1.1 12 3 0.06 64 12
G-15 Bhagirathi Devprayag 6.6 99 35 42 0.4 4 1.6 1 11 3 0.08 63 14
G-16 Ganga Devprayag 6.5 111 38 49 1.2 4.8 2 1 14 3 0.1 71 17
G-17 Lakundi Shiv Chula 6.6 139 52 61 2.4 5.7 1.6 0.8 17 5 0.1 106 21
G-18 Lakhman Chula Rishikesh 6.9 166 61 75 2.4 11 1.7 0.8 20 6 0.07 139 25
G-19 Saptrishi Ashram 6.7 182 69 79 2.4 12 1.6 0.7 21 6 0.19 311 43
G-20 Bhimgowada Barrage 6.5 135 52 57 0 4.8 1.7 0.9 16 4 0.1 88 20
G-21 Khadkhadi 7.5 485 401 224 7.4 5.3 5 0.5 53 22 0.02 116 20
G-22 Gujrawala Bhawan 7 160 47 72 2 9.7 1.2 0.7 21 5 0.08 102 20
G-23 Bisanpur village 6.9 217 93 108 2.2 9.2 1.4 0.5 30 8 0.02 86 17
ISSN 2250-3153
pH- As it is clear from the above graph that pH Values at the entire length of river are within specified limit (The pH of most natural waters ranges between 6.5 and 8.5). However it has been observed (see graph) that pH values at Jangla Bridge, Jhala Bridge, Debrani Bridge, UK Laghuvidut pariyojna and at Naluna
ISSN 2250-3153
Explanation-It is clearly shown in contour map that pH Values is increasing as we moves downstream from Gangotri. Highest pH is shown near Haridwar.
Electrical Conductivity- Electrical Conductivity is within limit in entire course of river however its values are spatially varies .Electrical conductivity at Khadkhadi is found maximum but within limit. However from Chinyalisur to Lakhundi Shiv-Chula electrical conductivity are observed below mean values. But overall Electrical Conductivity is within limit and showing good health of River. Conductivity is within limit and showing good health of river.
Alkalinity- Alkalinity has crossed the Acceptable limit at Khadkhadi (401 mg/l), otherwise concentration of alkalinity in entire length of river is almost uniform and within the permissible limit.
Hardness- Hardness values are found to be within specified limit along the entire length of River Ganga (from Gangotri to Haridwar) highest alkalinity is observed at Khadkhadi (224mg/l) and minimum at Chinyalisaur.
Chloride- Chloride content in River Ganga is found within prescribed limit, which shows that river is healthy. Maximum chloride concentration is found at Khadkhadi (7.4mg/l) and minimum at Tehri Reservoir.
Nintrate- Nitrate concentration in river Ganga is found within desired limit which indicate that river is pollution free. Maximum Nitrate is observed at Chinyalisaur and minimum at Nalluna-Senj.
Calcium- Calcium concentration in River Ganga water is observed within limit and no health hazard is observed. River is healthy and pollution free. Maximum concentration is observed at Khadkhadi (53mg/l) and minimum at Tehri.
Iron- Concentration of iron is found within desirable limit in entire length of river from Gangotri to Haridwar except at Jangla Bridge (Due to watershed rock characteristics). The maximum
Bisanpur village and Khadkhadi but overall concentration of iron is found within desired limit which indicate healthy river condition.
Magnesium- Magnesium concentration found maximum at Khadkhadi and minimum at Chinyalisur but both limit are within prescribed limit which indicated that river is pollution free and there is no health hazards. Concentration of magnesium is varying from site to site. Variation does not follow any specific trend, it is unsymmetrical in nature.
Sodium- The sodium concentration in river Ganga from Gangotri to Haridwar is found within limit. The maximum concentration of Sodium is observed at UK Laghuvidhut pariyojana site and at Naluna -Senj at Khadkhadi the concentration of Sodium is observed 5.0 mg/l .But as a conclusion it can be say that river is pollution free and Healthy in terms of Sodium.
Potassium- Concentration of potassium is found within
prescribed limit. Which shows that river is pollution free from Gangotri to Haridwar and there is no Health hazard. The maximum concentration is observed at Upstream of Uttarkashi and minimum at Khadkhadi and Bisanpur village.
ISSN 2250-3153
IV. CONCLUSIONS /SUGGESTION /FINDING
Overall water Quality of River Ganga from Gangotri to Haridwar is found Healthy and Pollution free. However, most of the parameters were in increasing as the river travels. Maximum concentration for most of the parameter was observed at Khadkhadi (Haridwar) which is an indication of impact of pollution due to anthropogenic activities. Drains which directly or indirectly discharging into the river, without proper treatment is found to be major source of pollution. Policy should to be framed for proper treatment of the drains before reaching river Ganga, so that water quality could be maintained. Co-ordination integration, participatory approach among various agencies, departments and groups should to be essential part of Ganga Rejuvenation Scheme.
REFERENCES
[1] Bahukhandi Kanchan Deoli and Bartarya S.K,(2014), major ion chemistry of asanrivercatchment of dehradun district (impact assessment of anthropogenic sources),Octa Journal of Environmental Research, 2014,Vol. 2(2): 168-177.
[2] Bharti N and Katyal.D,(2011), Water quality indices used for surface water vulnerability assessment, international journal of environmental sciences volume 2, no 1, 2011
[3] C.K. Jain,(2002), A hydro-chemical study of a mountainous watershed-the Ganga, National Institute of Hydrology, Environmental Hydrology Division, JalVigyanBhawan, Roorkee 247 667, India .Water Research 36 (2002) 1262–1274
[4] Dhananjay Kumar, Anjali Verma, NamitaDhusia and Nandkishor More,(2013), Water Quality Assessment of River Gomti in Lucknow , Volume 3, Issue 3: 337-344.
[5] Gadekar M.R.,GonteR.N,Paithankar V.K, Sangale Y.B and Yeola N.P.(2012),River water Quality degisnation, International Journal of
Emerging Technology and Advanced Engineering (ISSN 2250-2459, Volume 2, Issue 9, September 2012)
[6] Lenntech Water Treatment Sollution.( http://www.lenntech.com)
[7] Nighojkar Abhineet and ER. D.Dohare,(2014), Physico-Chemical Parameters for Testing of Present Water Quality of KhanRiver at Indore, International Research Journal of Environment Sciences Vol. 3(4), 74-81, April (2014)
[8] Pankaj Kumar Roy, Deeya Ray, Somnath Pal, Gourab Banerjee, ArunabhaMajumder and AsisMazumdar,(2014), Qualitative and Quantitative Assessment of Pollutional Load in River Ganga in West Bengal Using Statistical Technique, World Applied Sciences Journal 29 (5): 634-640, 2014
[9] Richa Seth , Manindra Mohan , Prashant Singh ,Rakesh Singh , RajendraDobhal ,Krishna Pal Singh , Sanjay Gupta,(2014), Water quality evaluation of Himalayan Rivers of Kumaunregion,Uttarakhand, Appl Water Sci DOI 10.1007/s13201-014-0213-7
[10] R.M.Bhardwaj (2005), Water quality monitoring in india- Achievements and constraints,Central Pollution Control Board, IWG-Env, International Work Session on Water Statistics, Vienna, June 20-22 2005.
[11] Report of CPCB on Pollution trend of river Ganga 2013
AUTHORS
First Author – Singh Rajesh, National Institute of Hydrology,
Roorkee, Uttarakhand, India
Second Author – Bahukhandi Kanchan, University of Petroleum
and Energy Studies, Dehradun, Uttarakhand, India
Third Author – Mondal Prasanjeet, University of Petroleum and
Energy Studies, Dehradun, Uttarakhand, India
Fourth Author – Singh Satendra, University of Petroleum and