Comparative Analysis of Trading-Volume Activity and
Abnormal Return Before and After Stock Split
Sasi Agustin*), BambangHadiSantoso **), AlfianDodyFirmansyah***)
*) STIESIA–Surabaya, Surabaya, Indonesia **) STIESIA–Surabaya, Surabaya, Indonesia ***) STIESIA–Surabaya, Surabaya, Indonesia
Abstract: This study aims to determine whether there are differences in trading-volume activity and abnormal return before and after stock split event. The population in this study is 40 companies with a sample consisting of 23 companies listed on the Indonesia Stock Exchange period 2010-2014. The data used in this study include the date of stock split announcement that is used as event date, daily closing stock price of the company that performs stock split in observation period, Daily Joint Stock Price Index (IHSG) daily, number of stocks traded daily and number of stocks outstanding or listed. The results showed that there was no significant difference in trading activity volume and abnormal return before and after the event. This indicates that investors in Indonesia have not anticipated rapidly the information it receives in the capital market and may even be an investor assumes that stock split events are not good news. In addition, investors and issuers need to pay attention to external factors such as economic factors, political instability, and market conditions because it will indirectly affect the activities of the capital market.
Keywords: Stock Split, Trading Volume Activity, Abnormal Return
I. INTRODUCTION
Capital market is one of alternative means that can be utilized by the owners of capital or investor to make investment. Investors can choose which companies they will invest in their money or capital to gain maximum profit. In the capital market investors can find a variety of information, both publicly available information and private information. One of the available information is the announcement of stock split or stock split. This information can have meaning or value if it causes investors to conduct transactions in the capital market, which will be reflected in changes in stock prices, trading volume, and other indicators or market characteristics.
Stock split is breaking one unit of stock into n stock units. The price per share after the stock split is 1 / n from the previous price (Jogiyanto, 2000). Stock split is an activity done by a public company to raise the number of shares in circulation, where the activity is usually done when the stock price is overvalued, thus reducing the investor to buy it.
There are basically two types of stock splits that can be done, namely split up and split down / reverse split. The split up is a decrease in the nominal price per share which results in an increase in the number of stocks outstanding such as stock split by a factor of 2 : 1, 3: 1, and 4: 1. While the breakdown is the increase in the nominal price per share, and reduce the number of shares outstanding. For example break down with 1: 2, 1: 3, and 1: 4 splitting factor.
According to Baker and Gallangher (quoted from Marwata, 2001) one of the goals of stock split is to return the price per share at the optimal trading level thus increasing liquidity. The foregoing argument holds that stock splits are merely stock distributions that have purely cosmetic changes in the sense that they are an attempt to be more attractive to investors even if they do not increase the wealth of investors. Stock split action will create a mirage effect for investors, i.e.: investors feel more prosperous because of holding shares in large quantities.
cheaper are expected to be able to keep stock trading levels within the optimal range and make the stocks more liquid. A cheap stock price will increase the volume of stock trading.
The above phenomenon encourages authors to research “COMPARATIVE ANALYSIS OF TRADING-VOLUME ACTIVITY AND ABNORMAL RETURN BEFORE AND AFTER STOCK SPLIT.”
Aims of Study
This study has the following objectives: (1) To analyze whether there are significant trading-volume activity differences before and after stock split announcement. (2) To analyze whether there are significant abnormal differences of stock return before and after stock split announcement.
II. THEORETICAL BACKGROUND AND HYPOTHESIS
Stock Split
According to the investment and financial dictionary, the stock split event is done in order to break the number of shares outstanding and the stock price of a company without any addition in the equity value of the shareholder. Stock split also interpreted as an act of breaking the nominal price of the stock into smaller fractions and the number of shares becomes large. If before stock split the stock price per unit in the market Rp. 1,000, then after the stock split the unit stock price in the market becomeRp. 500,- (Darmadji and Fakhrudin, 2006:183). While these stock split events are essentially uneconomical, firms need to take action when stock prices on the market are overvalued, reducing investor interest in buying them. This is similar to McNichols and Dravid in Marwata (2001) stating that stock split is a management effort to reorganize stock prices over a certain price range. By directing the price to a certain range, it is expected that more market participants will be involved in trading.
Stock Split Theories
Theoretically the motivation behind the company's stock split is described in several theories, among others, Trading Range Theory and Signaling Theory.
1. Trading Range Theory
Trading range theory provides an explanation that stock split increases stock liquidity. According to this theory, management assesses the stock price is too high (overprice) so less attractive to trade. Management seeks to restructure stock prices at a lower price range than before. It is expected that more and more market participants will be involved in trading. With the stock split, stock prices will fall so that many investors will be able to transact.
Thus the management motive of stock splits is driven by the behavior of market practitioners who are consistent with the assumption that by doing stock split can keep stock prices not too expensive. This is done by breaking the nominal price of the stock, because there is an optimal price limit for the stock. The purpose of the stock split is to increase the purchasing power of investors so that there will still be many capital market participants who want to buy shares. This condition will ultimately increase stocks liquidity. 2. Signaling Theory
Management has more information about the prospect of the company than the investor. Stock split is a management effort to attract investors. Stock splits cost money and only good prospecting companies can do it. Conversely, if a company that does not have a good prospect of trying to give an invalid signal through a stock split will not be able to bear the cost. So instead of a stock split it will increase the price of its securities but will lower it if the market is sophisticated enough to know it (Jogiyanto, 2000:419).
Types of Stock Split
Basically, there are two types of stock splits: split up and split down / reverse split. A split-up is a nominal decrease of price per share that results in an increase in the number of shares outstanding. For example stock split with 1: 2 split factor, 1: 3, 1:10 and so on. While split down (reverse split down) is the increase of nominal price per share and reduce the number of shares in circulation. For example stock splits down with 2:1, 3:1, 10:1 split factor and so on.
Stock Trading Volume
Stock trading volume is the ratio between the numbers of stocks traded at a certain time against the number of outstanding stock at a given time (Husnan et al., 2005). Stock trading volume is one of the indicators used to see the market reaction to events or information relating to a stock. The change in trading volume is measured by trading volume trading activity as measured by Trading Volume Activity (TVA). TVA is a comparison between the numbers of stocks traded at a certain time with the number of stocks of a company outstanding in a certain period. The magnitude of TVA's average change between before and after stock splitting, is a measure of the consequences caused by stock split on stock trading volume.
The development of stock trading volume reflects the strength between supply and demand which is a manifestation of investor behavior. Rising trading volume is an increase in trading activity of investors in the stock. The increasing volume of supply and demand of a stock, the greater the effect on the fluctuation of stock prices on the stock, and the increasing volume of stock trading shows the increasingly interests onstocks that will bring the effect on rising prices or stock returns. In connection with the stock split, the stock price will become cheaper so that the stock price volatility becomes larger and will attract investors to own the shares or increase the number of shares traded.
Abnormal Return
Abnormal return or excess return is the excess of the actual return to normal return, where the normal return is the expected return (return expected by the investor), thus the abnormal return is the difference between actual return and expected return (Jogiyanto, 2000). A positive abnormal return indicates a higher profit rate between actual return and expected return. In relation to stock split events, in case of a positive abnormal return after stock split, there is an above normal profit on the investor and vice versa if there is a negative abnormal return indicating that the gain is below normal. The abnormal return formula is as follows:
AR it = R it - E (R it) Where: R it : return of stockion day t
Pit : stock price ofion day t Pit -1 : stock price of i on day t-1
While expected returns to be estimated (Brown & Warner, 1985) quoted from Jogiyanto (2000) are expected return estimates using several estimation models, among others:
1. Mean adjusted model
The mean adjusted model assumes that the expected returns are constant in value equal to the average realized return over the previous estimation period. This model can be formulated as follows:
E(Rit) =ΣRitt
Estimation period is the period before the event period. The event period is also called the observation period or event window,
2. Market model.
The calculation of expected returns with this model can be done in two stages.
First, the calculation of the expected return to-i in the estimation period. Second, forming the expectation model by using Ordinary Least Square technique with equation as follows:
E(Rit) = αi + βiRmt + εit
Where: E(Rit) = the expected return of the i-th securities in the estimation period t
αi = intercept, independent ofRmt
βi = slope, systematic risks, dependent ofRmt Rmt = market return, calculated by the formula:
Rmt=JCIt - JCIt-1 IHSGt-1
JCI = the Jakarta Composite Index (IndeksHargaSahamGabungan) εit = residual error of securityiin the estimation period t
3. Market adjusted model.
This model assumes that the best estimator to estimate the return of a security is the market index return at that time. Using this model it is not necessary to use an estimation period to form an estimation model, since the estimated security return is equal to the market return.
ARit = Rit – Rmt
Where: Arit = abnormal return of stockion period t Rit = actual return of stockion period t
Rmt = market return, calculated by the formula:
Rmt=JCIt - JCIt-1 JCIt-1 Event Study
According Jogiyanto (2000) event study is a study of market reaction to an event whose information is published as an announcement. If the announcement contains information, then the market is expected to react at the time the announcement is received by the market. From that sense, event study can be used to see the reaction of capital market (by approaching stock price movement) to a particular event.
In the event study, there is the term event window / event date and estimated period. The event period is also referred to as the event window of varying length, the length of the window being used in the range of 3 days - 121 days for daily data and 3 months -121 months for monthly data. While the length of the general estimation period used is ranged from 100 days - 300 days for daily data and ranging from 24 to 60 months for monthly data.
Previous Studies
1. Hendrawijaya (2009) with the title of: Comparative Analysis of Stock Price, Stock Trading Volume, and Abnormal Return Stocks Before and After Stock Splits (Studies On Companies Go Public Who Conducted Stock Split Between 2005-2008 at BEI). The result shows that there is no difference of average stock price, stock trading volume and significant abnormal return in period before and after announcement of stock split.
3. Wang (2000) entitled: The Effect of Stock Split on Liquidity and Stock Return on the Jakarta Stock Exchange. From the results of this study can be seen there is a difference in stock trading volume and there is no significant difference in the abnormal return of stock.
Hypothesis
Based on the analysis of the theories that have been described previously, as well as previous research on the implementation of theories on the event of stock split, the hypothesis in this study can be arranged as follows:
H1: There are significant trading-volume activity differences before andafter the stock split announcement.
H2: There are significant abnormal return differences before and after stock split announcement.
III.METHOD
Type of Research
This type of research is a comparative causal study. Comparative causal research is a type of research with problem characteristics of causality between two or more variables. Comparative causal research is a type of ex post facto research, i.e. the type of research on data collected after the occurrence of facts or events. The event in question is a stock split event, which will be further investigated whether the event will lead to differences in trading volumes activity volume and abnormal return.
Population
The population of this study is a company that performs stock split during 2010 to 2014 and listed on the Indonesia Stock Exchange. It is known that there are 40 companies from various sectors that become population in this research, as follows: (1) Ciputra Development Tbk, (2) Tunas RedeanTbk, (3) Intiland Development Tbk, (4) Charoen Pokphan Indonesia Tbk, (5) Bank Rakyat Indonesia, (6) London Sumatera Plantation Tbk, (7) Bank Tabungan Pensiunan Nasional, (8) Intraco Penta Tbk, (9) MalindoFeedmilTbk, (10) Surya SemestaInternusaTbk, (11) PetroseaTbk, (12) Astra InternasionalTbk, (13) IndomobilSuksesInternasionalTbk, (14) Modern International Tbk, (15) Central Omega Resources Tbk, (16) KresnaGrahaSekurindoTbk, (17) Kalbe FarmaTbk, (18) Ace Hardwar Indonesia Tbk, (19) Arwana Citra MuliaTbk, (20) Sarana Menara Nusantara Tbk, (21) Telekomunikasi Indonesia Tbk, (22) Sepatu Bata Tbk, (23) Jaya Konstruksi, (24) SummareconAgungTbk, (25) Multi Bintang Indonesia Tbk, (26) Pan Brother Tbk, (27) Astra OtopartTbk, (28) JasuindoTiga Perkasa Tbk, (29) Metro Realty Tbk, (30) Centra Omega Resources Tbk, (31) Pakuwon Indah JatiTbk, (32) Indo Spring Tbk, (33)IndosiarKarya Media Tbk, (34) JapfaComfeedTbk, (35) SumberAlfariaTrijayaTbk, (36) Jaya Real Property Tbk, (37) Alumindo Light Metal Industry Tbk, (38) IndalAluminium Industry Tbk, (39) Surya Toto Indonesia Tbk, (40) Centris Multi PersadaPratamaTbk.
Sampling Technique
Sample selection is done by using purposive sampling method that is choosing sample with certain criterion, so that in accordance with research designed. The criteria used are as follows: 1) The company is listing on IDX during 2010-2014. 2) Announcing stock split policy for 2010-2014 period. 3) Date the Company does not engage in other corporate actions, such as rights issue, dividend distribution and bonus stock distribution. 4) Date of stock split announcement. 5) The data is completely available.
MuliaTbk, (20) Sarana Menara Nusantara Tbk, (21) Telekomunikasi Indonesia Tbk, (22) Sepatu Bata Tbk, (23) Jaya Konstruksi.
Data Collection Technique
The type of data in this study is documentary data, in the form of archives containing what and when events or transactions occur. The data is in the form of stock price and trading volume of stocks of companies that conduct stock split period 2010-2014.
In accordance with the type of data required, the data source used in this study is secondary data derived from the historical data of the Indonesia Stock Exchange, through quoting data and information from the competent party. These data include: (1) Stock trading volume 5 days before and after stock split, (2) Stock price of the company performing stock splits 5 days before and after stock split, (3) total outstanding stocks of the company 5 days before and (4) Composite Stock Price Index 5 days before and after stock splits, (5) companies listed on IDX which conduct stock split policy for 2010 to 2014 period.
Data collection method in this research is documentation that is by observing and recording data in publication of Indonesia Stock Exchange about each company. The data collected is stock data and recorded based on the event window before and after the stock split.
Variables
Types of variables include independent variables and dependent variables. The independent variable is the variable that influences or becomes the cause of the dependent variable. While the dependent variable is an influenced variable or variable that is the result of independent variables. Dependent variable in this research is stock price and stock trading volume. While the stock split, in this study, is an independent variable, which is a stock split announcement and will be studied its influence on the dependent variable. The following describes the definition of operation the variables used in this study:
1. Trading Volume Activity
Trading volume activityis the ratio between the number of stocks traded and the number of stocks
outstanding. 2. Abnormal Return
Abnormal return is the difference between the actual return with the expected return of each stock.
Data Analysis Technique
In each study, techniques are needed in analyzing the data. The data collected is analyzed systematically, leads to the things studied, then the results of data analysis is applied in solving the problem.
Techniques for analyzing data used by the author in this case is as follows: 1. Hypothesis 1 Testing
Testing hypothesis 1 is testing difference of stock trading volume in period before and after stock split. Since there is one dependent variable with two categories and one independent variable, the statistical test used is different test of t test with the corresponding sample (paired sample).
Testing of hypothesis 1 is done by following stages: 1) Calculate the mean value of Trading Volume Activity (TVA) of all samples in eventwindow. 2) Calculate the descriptive components of TVA before and after events. 3) Do paired sample t-test (at significance level α = 0.05). 4) Determine H0 and Ha. 5)
Decision making can be done by: Accept H0 if sig. > of significance level α (0.05), and reject H0 or accept
H1 or Ha if sig. < from the level of significance α (0.05).
2. Hypothesis 2 Testing
Hypothesis 2 testing evaluates the difference of abnormal return (AR) before and after stock split. Here there is one dependent variable with two categories, i.e. AR in the period before and AR after stock split and one independent variable, i.e. stock split event. The statistical test used is different test of t test with related sample (paired sample).
Doing paired sample t-test (at significance level α 0.05). 8) Determine H0 and Ha. 9) Decision making can be done by: Accept H0 if sig. > of significance level α (0.05), and reject H0 or accept H1 or Ha if sig. <
from the level of significance α (0.05).
IV.RESULTS AND DISCUSSION
Descriptive
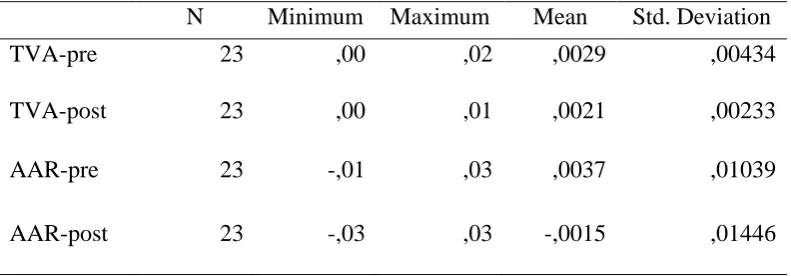
Descriptive statistics are performed to provide an overview or description of the variables studied. In descriptive statistics can be known the minimum, maximum, average, and standard deviation of each variable.
[image:7.595.101.497.288.426.2]Based on the calculation in the attachment, it can be seen that trading volume variables measured by TVA (trading volume activity) both before stock split event and after stock split event and abnormal return variable before stock split event and after stock split can be seen in table 5 below.
Table 1 Descriptive
N Minimum Maximum Mean Std. Deviation
TVA-pre 23 ,00 ,02 ,0029 ,00434
TVA-post 23 ,00 ,01 ,0021 ,00233
AAR-pre 23 -,01 ,03 ,0037 ,01039
AAR-post 23 -,03 ,03 -,0015 ,01446
Source: Secondary data
Table 1 shows that:
1. In the TVA variable, the minimum value in the period before the event is 0, and the maximum is 0.02, the mean is 0.0029 with the standard deviation of 0.00434. While in the period after the event, it can be seen the minimum value of TVA is 0, and the maximum is 0.01, the mean of 0.0021 with the standard deviation of 0.00233. Average TVA variables smaller than the standard deviation show deviations from the average value.
2. In the AAR variable, the minimum value of AAR in the period before the event is -0.01, and the maximum is 0.03, the mean of 0.0037 with the standard deviation of 0.01039. While in the period after the event, it can be seen the minimum value of AAR is -0.03, and maximum is equal to 0.03, mean equal to -0.0015 with standard deviation of 0.01446. Analysis of the AAR variable also indicates the presence of deviations from the mean, since the value of the standard deviation is greater than the mean.
Data Analysis
Prior to hypothesis testing, it is necessary to analyze the data obtained from the raw data obtained from the data collection. Analysis is done by comparing the value of each variable in the period before and after the event, which is the period is five days before the event and five days after the event. The results of the data analysis are as follows:
Table2
Mean of TVA and AAR in Observation Period
TVA AAR
-5 0,003265741 0,002751
-3 0,003381279 0,006066
-2 0,002557439 0,005832
-1 0,002276399 -0,00305
0 0,00245654 -0,76096
1 0,001589325 0,015625
2 0,001877505 0,006028
3 0,002101698 -0,01157
4 0,002107819 -0,00889
5 0,002742475 -0,00882
Source: Secondary data, 2015.
Table 2 shows data from 23 sample firms over 11 trading days divided into five days prior to stock split announcement and five days after stock split announcement for each variable.
Test of Data Normality
Before performing statistical tests, the first step should be done is to screen the data to be processed. Because this research uses different test analysis tools for the related sample (paired sample t-test) for hypothesis testing, the assumption used is normal distributed data. To detect the normality of data from each variable, the data normality test (Kolmogorov - Smirnov test) was used.
The first step is to determine the hypothesis, which is as follows: H0 : The data is normally distributed H1or Ha : The data is not normally distributed
If the result of data processing yields a probability significantly below 5% (0.05) H0 is rejected or data from that variable is not normally distributed.
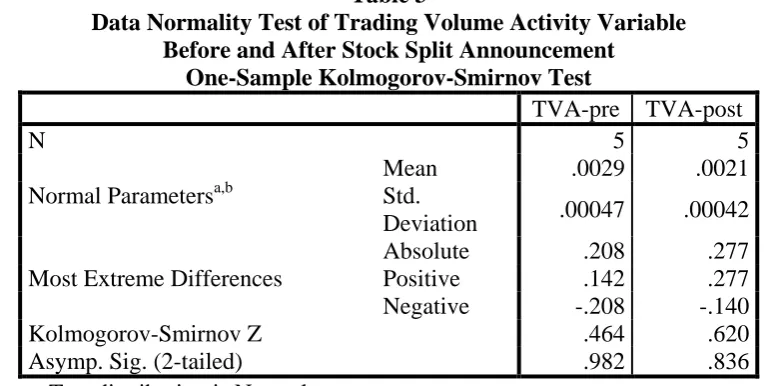
1. Data normality testing ofTrading Volume ActivityVariable
[image:8.595.103.487.575.768.2]Here are the results of testing the normality of data on the variable Trading Volume Activity:
Table 3
Data Normality Test of Trading Volume Activity Variable Before and After Stock Split Announcement
One-Sample Kolmogorov-Smirnov Test
TVA-pre TVA-post
N 5 5
Normal Parametersa,b
Mean .0029 .0021
Std.
Deviation .00047 .00042
Most Extreme Differences
Absolute .208 .277
Positive .142 .277
Negative -.208 -.140
Kolmogorov-Smirnov Z .464 .620
Asymp. Sig. (2-tailed) .982 .836
b. Calculated from data. Source: Secondary data, 2015.
Table 3 shows that the significance level is 0.836 which means greater than probability value of 0.05. The result means that H0 is accepted or can be interpreted that the data has been normally distributed.
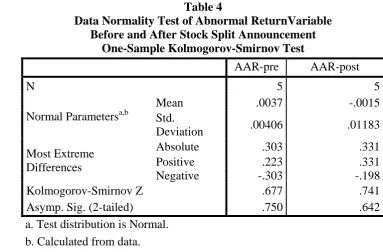
2. Data Normality Testing of Abnormal Return Variable
[image:9.595.94.478.220.472.2]Here are the results of testing the normality of data on the variable Abnormal Return
Table 4
Data Normality Test of Abnormal ReturnVariable Before and After Stock Split Announcement
One-Sample Kolmogorov-Smirnov Test
AAR-pre AAR-post
N 5 5
Normal Parametersa,b
Mean .0037 -.0015
Std.
Deviation .00406 .01183
Most Extreme Differences
Absolute .303 .331
Positive .223 .331
Negative -.303 -.198
Kolmogorov-Smirnov Z .677 .741
Asymp. Sig. (2-tailed) .750 .642
a. Test distribution is Normal. b. Calculated from data. Source: Seconday data, 2015.
Table 4 shows that the significance level is 0.642 which means greater than probability value of 0.05. This result means H0 is rejected or can be interpreted data has been distributed normally.
Hypothesis Testing
Before the test, the hypothesis is determined as follows: H0 : µ1 = µ2 H1 : µ1 ≠ µ2
H0 is accepted if the significance is greater than the level of significance α (0.05), whereas H0 is
rejected if its significance is less than the significance level α (0.05).
1. First Hypothesis
The first hypothesis states that there is a significant difference in stock trading volume in the period before and after the stock split. The volume of stock trading itself is calculated using Trading Volume Activity (TVA) obtained from the number of stocks traded at time t divided by the number of stocks
outstanding at time t.Having known the average TVA of all samples in the period before and after the stock split announcement, then paired samples t test and the results can be seen in table 5 below:
Table5
Test of Difference ofTrading Volume Activity Before and After Stock Split
Paired Differences T df Sig. (2-tailed)
Mean Std.
Deviati on
Std. Error Mean
95% Confidence Interval of the
Difference Lower Upper
Pair 1
TVA-pre – TVA-post
.00078 .00083 .00037 -.00025 .00180 2.097 4 .104
Source: Secondary data, 2015.
The above table shows the result of test of difference on the mean of Trading Volume Activity variable before and after split event. The value of t is 2.097 and the significance value is 0.104 which means greater than the 0.05 significance level. Thus it can be concluded that H0 is accepted or can be said there is no significant difference in the period before and after stock split event, so the first hypothesis is rejected.
2. Second Hypothesis
The second hypothesis states that there is a significant abnormal difference of stock returns in the period before and after the stock split. After knowing the average abnormal return (AAR) in period before and after announcement of stock split, paired sample test is done and the result can be seen in table 6 below:
Table6
Test of Difference ofAbnormal Return Before and After Stock Split
Paired Samples Test
Paired Differences T df Sig.
(2-tailed)
Mean Std.
Deviati on
Std. Error Mean
95% Confidence Interval of the
Difference
Lower Upper
Pair 1
AAR-pre– AAR-post
.00520 .01217 .00544 -.00991 .02031 .955 4 .394
Source: Secondary data, 2015.
The table above shows the different AAR test results before and after the stock split event. From the table obtained t value 0.955 and significance value of 0.394 which means greater than the level of significance 0.05. Thus it can be concluded that there is no significant difference of AAR in the period before and after stock split event, so the second hypothesis is rejected.
Discussion Hypothesis 1
The result of hypothesis testing one proves that there is no statistically significant difference between Trading Volume Activity period before and after the event of stock split, so the hypothesis that there is significant difference of Trading Volume Activity in period before and after stock split is not proven. Based on the average, TVA before the announcement of stock split is 0.0028 and TVA after the announcement of stock split is 0.0020.
significant capital market reaction after the stock split announcement indicates that investors in Indonesia still do not anticipate rapidly the information it receives in the capital market, or it may be that investors consider that the stock split event is not a good news, so there is no difference in stock trading volume significant in the period before and after stock split.
The results of this study support research conducted by Hendrawijaya (2009) and Mila (2010) which states that there is no significant difference in stock trading volume before and after stock split, but this research is contrary to research conducted by Wang, et al (2000) that found a significant difference between the stock trading volume of the period before and after the stock split.
Hypothesis 2
Testing of hypothesis two did not find statistically significant difference between abnormal return before and after event, so that hypothesis that there is significant difference of abnormal return in period before and after stock split is rejected.Based on the average abnormal return before stock breakout announcement is 0.00367182 and abnormal return after the announcement of stock split is -0.001525549. The result proves that there is no significant difference of abnormal return in period before and after stock split.
Theoretically, it is viewed from signaling theory, which states that signaling theory relates to the existence of information asymmetry between managers and investors, where managers can use stock splits to give a positive signal to the market about their expectations in the future. Brennan and Hughes in Hendrawijaya (2010) assume that investors will only invest in stocks that are completely known with certainty (know about). The stock split activity conducted by the firm will be interpreted by the investor as a signal that the manager has a favorable information which is indicated by a significant abnormal return around the stock split announcement. Through this study, different results are obtained, that is, the average abnormal return does not differ significantly in the period before and after the announcement of stock split. This means that investors do not anticipate any new information published to the market, or investors consider that the split event stock is not good news. So as not to change the preferences of investors to investment decisions.
The results of this study support previous research conducted by Wang, et al (2000), Hendrawijaya (2009) and Mila (2010) stating that there is no significant abnormal return before and after stock splits.
V. CONCLUSION Conclusion
This study aims to determine whether there are significant differences in trading volume activity (TVA) and abnormal return period before and after stock splitting. Based on the results of tests that have been done, it can be concluded as follows:
1. The first hypothesis test using paired sample t-test shows that there is no significant difference between trading volume activity before and after stock split. This result contradicts the existing theory. Trading range theory which states that stock split event will cause the increasing of trading volume due to the decline of stock price is not proven. This indicates that stock split events do not result in significant changes in trading volume after the announcement of stock split.
2. The second hypothesis test showed no significant difference between abnormal return before and after stock split. This result is different from the signaling theory which states that managers have good information about the company condition, which is indicated by a positive abnormal return around the stock split announcement. The results, in opposite to signaling theory, prove that stock splitting events do not result in a significant abnormal return after the stock split announcement.
Future Research Suggestion 1. For further researchers:
2. For Issuers:
The results of this study provide input to the issuer that the stock split activity does not guarantee that the volume of stock trading and abnormal return will increase in accordance with its purpose. Therefore, issuers need to consider the external factors that exist, such as political instability and the Indonesian economy that impact on market sentiment and negative issues that may affect market reaction.
3. For investors:
In making investment decisions, investors should pay attention to the policies issued by companies such as stock split announcements because with the stock split information investors can use it as a reference to take the right investment decisions in order to gain profits. In addition, investors should consider external factors such as economic and political factors, market conditions, as this will indirectly affect the activities of the capital market
REFERENCES
Jogiyanto. 2000. TeoriPortofoliodanAnalisisInvestasi. BPFE Yogyakarta. EdisiKetiga. Yogyakarta.
Marwata. 2001. KinerjaKeuangan, HargaSahamdanPemecahanSaham.Seminar Nasional Akuntansi III. Hal. 751 – 769.
Michael, H. 2009. AnalisisPerbandinganHargaSaham, VolumePerdaganganSaham, Dan Abnormal Return SahamSebelum Dan SesudahPemecahanSaham (StudiPada Perusahaan go public Yang MelakukanPemecahanSaham Antara Tahun 2005 – 2008 di BEI). Tesis Program
PascaSarjana Magister SainsManajemenUndip.
Mila, W. 2010. AnalisisPengaruhPemecahanSaham (Stock Split) Terhadap Volume PerdaganganSaham Dan Abnormal Return SahamPada Perusahaan Yang Terdaftar Di BeiTahun 2007–2009.