Gene Expression of Survivin in Colorectal Cancer
Abdel-Aziz A. F. * , El-Hussiny M.A.B**, Bakr N.M. *** , Mehrez.H.A.*
*Biochemistry Division, Department of Chemistry, Faculty of Science, Mansoura University, Mansoura, Egypt **Department of Clinical Pathology, Faculty of Medicine, Mansoura University, Mansoura ,Egypt
***National Research Center, Dokki, Egypt
DOI: 10.29322/IJSRP.9.04.2019.p8874 http://dx.doi.org/10.29322/IJSRP.9.04.2019.p8874
Abstract- Colorectal cancer (CRC) is the third most common cancer type in humans, the fourth most common cause of death annually. Survivin (known as SVV and BIRC5) is the smallest member of the inhibitor of apoptosis protein (IAP) family and it correlates with not only inhibition of apoptosis and a decreased rate of cell death, but also resistance to chemotherapy and tumor aggressiveness.The main goal of this study was to evaluate gene expression of survivin by RT-PCR as well as estimate the level of Oncostatin-M and antioxidants in the peripheral blood of patients with colorectal carcinoma and its relation to metastasis. Results: Our study shows high expression of survivin (p <0.001) and Oncostatin-M (p <0.001) in patients with colorectal cancer more than healthy persons. The present study revealed that CEA concentration was increased in colorectal carcinoma patients group compared to control group, p value was 0.010. Additionally, this study shows high elevation of antioxidants as catalase (p <0.001) , malondialdehyde (p <0.001) in patients group than control group. This proves that early detection of survivin and Oncostatin-M has important role in early screening of colorectal cancer.
Index Terms- survivin, colorectal cancer, antioxidants, oncostatin-m .
I. INTRODUCTION
ancer is an abnormal growth of cells resulting from multiple changes in gene expression leading to dysregulated balance of cell proliferation and cell death and eventually develops into a population of cells. These cells can invade tissues and metastasize to distant sites, causing significant morbidity and death, if untreated[1].However, colorectal cancer incidence has remained relatively stable in the UK over the last decade[2]. In the past 2 decades, the overall morbidity and mortality of colorectal cancer are higher in city urban and in male as compared with rural district and female[3].
There are common mechanisms for colorectal cancer (CRC) formation. Several are connected with oxidative stress-induced cell apoptosis and others are related to imbalanced homeostasis or intake of drugs/toxins[4]. Survivin (known as SVV and BIRC5) is the smallest member of the Inhibitor of Apoptosis Protein (IAP) family, and it is about 16.5 kDa. The protein comprises 142 amino acids organized in two domains: an N-terminal baculovirus-IAP repeat (BIR) domain, linked to a C-terminal α-helix. SVV presents during fetal development, but undetectable in terminally differentiated adult
tissues[5]. The survivin gene locus encodes multiple genetic splice variants with unique properties and functions [6][7]. Survivin accumulates in the centromeres in G2 phase, and then it starts to diffuse to the chromosome arms and is abundant at the inner centromeres in prophase and metaphase of mitosis[8]. In anaphase, survivin re-localizes to the central spindle because it fails to associate with the centromeres[9]. Survivin secreted as a molecule with much expanded role in cellular homeostasis. It is involved in inhibition of apoptosis and regulation of cell proliferation and cell death. Survivin with aurora B and ICP forms a chromosomal passenger complex that bind to their target sites including centromere, midplate and cleavage furrow, where it regulates proper chromosome segregation and cytogenesis[10]. In addition,it correlates with not only inhibition of apoptosis and a decreased rate of cell death, but also resistance to chemotherapy and tumor aggressiveness [11].
peroxidation products like malondialdehyde (MDA) was estimated[21] .
II. PATIENTS AND METHODS Patients
The study was carried out on 50 pre – treatment colorectal cancer patients of both sexes attending to Mansoura University Oncology Center (MUOC), Mansoura, Egypt, their mean of age was 53.8 years with SD ±13.9 and 50 apparently healthy age & sex matched controls, their mean of age was 52.8 years with SD ±5.8 . To confirm the presence of colorectal cancer (CRC), samples were screened morphologically and pathologically. Colorectal cancer patients who received medical treatments, radiotherapy or chemotherapy are excluded.
Blood collection
Morning blood samples were collected from the study participants to be estimated after applying all the precautions. By using a sterile plastic syringe for each patient, 5 ml of venous blood were withdrawn and divided into 1ml that was put in a tube containing EDTA for survivin and 4ml were put in a clean and dry test tube then allowed to centrifuge to separate serum for estimation of Oncostatin-M (OSM), superoxide dismutase (SOD), catalase (CAT), malondialdehyde (MDA) and glutathione(GSH).
III. DETECTION OF SURVIVIN BY REAL TIME PCR
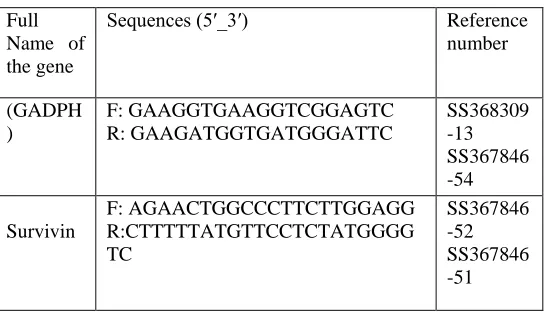
Total RNA was extracted from venous blood by using Thermo Scientific GeneJet RNA Purification utilizing the method of Chomczynski and Sacchi [22], and Boom et al.[23] . The extracted RNA was transcript to cDNA by SensiFASTTM cDNA Synthesis Kit (Bioline USA Inc., USA) based on the instructions of manufacturer. We used the housekeeping gene (GADPH) to normalize mRNA concentrations. Quantitative PCR was to compare expression levels of survivin transcripts. The relative expression levels of reference samples and survivin in the blood samples were determined by quantitative PCR using real time RT-PCR analyses (The Applied Biosystems™ StepOne . RT-PCR were performed using a sensi FastTM SYBR NO-ROX kit (Bioline USA Inc., USA) in a final volume of 20 ml. An initial PCR activation step was 2 min at 95○C followed by 35 cycles of 5 s at 95○C , 20 s at 61○C, 10 s at 72○C and 5-10 min at 72○C. The sequence of primers used in real-time PCR was designed according to kit of Biosearch Technologies Custom Oligonucleotide Synthesis. The sequence of primers used in real-time PCR are shown in Table (1).
Full Name of the gene
Sequences (5′_3′) Reference
number (GADPH ) F: GAAGGTGAAGGTCGGAGTC R: GAAGATGGTGATGGGATTC SS368309 -13 SS367846 -54 Survivin F: AGAACTGGCCCTTCTTGGAGG R:CTTTTTATGTTCCTCTATGGGG TC SS367846 -52 SS367846 -51
Table (1). It was used to reverse transcribe and expand the RNA template for 35 cycles so finally CT was estimated.
Assessment of the biochemical parameters
Quantitative determination of Oncostatin M (OSM) was done by using Abcam’s Oncostatin–M Human ELISA Kit based on Croci DO et al [24], Ltd. ,USA based on the manufacturer’s instructions. Determination of serum catalase activity was done by the method of Aebi [25] and Fossati et al [26] by using a commercially available kit (Biodiagnostic, Dokki, Giza, Egypt), by adding 0.5 ml of reagent 1 (chromogen buffer) to 50 μl of serum sample then 100μl of reagent 2 (H2O2). Then adding 0.2 ml of reagent 3 ( catalase-inhibitor) and 0.5 ml of reagent 4 (peroxidase enzyme ). Measure the pink colour that appeared at 510 nm.
Determination of blood reduced glutathione content was done by the method of Beutler et al [27] using a commercially available kit (Biodiagnostic, Dokki, Giza, Egypt), by adding 0.5 ml of reagent 1 (trichloroacetic acid) to 0.1 ml of blood sample, then centrifuge. Then adding 1.0 ml of reagent 2 (buffer) to 0.5 ml of supernatant .After that, add 0.1 ml of reagent 3 ( 5,5′ -dithiobis(2-nitrobenzoic acid)). Measure the colour at 405 nm. Malondialdehyde was determined by the method of Ohkawa et al [28]by using Thiobarbituric acid (TBA) by adding 1 ml of it to 0.2 ml of serum then heat in boiling water bath for 30 minutes, cool and read the absorbance of the pink product at 543nm. Superoxide dismutase (SOD) was determined by using Nishikimi et al [29]method which relies on the ability of the enzyme to inhibit the phenazinemethosulfate (PMS)- mediated reduction of nitroblue tetrazolium dye.
IV. STATISTICAL ANALYSIS
Data obtained from the present study were analysis using SPSS versions 20. Continuous data were expressed in the form of mean ± SD while categorical data were expressed in the form of number and percent. Student t test, ANOVA and regression analysis by utilizing univariate and multivariate were applied for continuous data. Whereas, categorical data were done using Chi-square test.
V. RESULTS
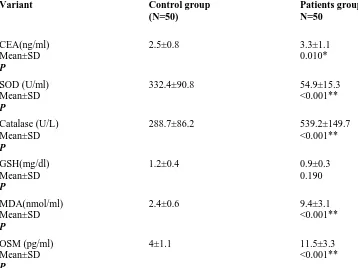
[image:2.612.310.583.54.210.2]antigen (CEA), catalase, superoxide dismutase (SOD), malondialdehyde (MDA), and Oncostatin M (OSM) concentration. Whereas, glutathione concentration (GSH) shows
no significant difference between patients group compared with control groups.
Table (2). Comparison of some laboratory data between CRC patients and control groups.
Variant Control group
(N=50)
Patients group N=50
CEA(ng/ml) Mean±SD P
2.5±0.8 3.3±1.1
0.010*
SOD (U/ml) Mean±SD P
332.4±90.8 54.9±15.3
<0.001**
Catalase (U/L) Mean±SD P
288.7±86.2 539.2±149.7
<0.001**
GSH(mg/dl) Mean±SD P
1.2±0.4 0.9±0.3
0.190
MDA(nmol/ml) Mean±SD P
2.4±0.6 9.4±3.1
<0.001**
OSM (pg/ml) Mean±SD P
4±1.1 11.5±3.3
<0.001**
**P <0.001, highly significant. CEA: Carcinoembryonic antigen & SOD: Superoxide dismutase GSH: Glutathione & MDA: Malondialdehyde & OSM: Oncostatin-M
Table (3) shows that mean survivin expression was 1.5. Cases showed significantly higher survivin concentration
(upregulation) when compared to control group.
Control N=50
Cases N=50
P
Survivin expression Mean±SD 1 0 1.5±0.5 <0.001T***
Median (min-max)) 1 (1-1) 1.2 (0.9-3.3)
[image:3.612.87.445.139.407.2]Fig.1 clarifies survivin concentration. It was significantly higher in patients group compared with control group, P <0.001.
The patients group was divided according to the location of cancer into 3 groups: colon cancer (25 patients), colorectal cancer (14 patients), and rectum cancer (11 patients). Fig.(2) reveals that there were no significant differences in survivin expression between colon cancer subgroup, p value was 0.6
Fig.(2) Survivin espression in colon cancer, colorectal cancer and rectal cancer patients.
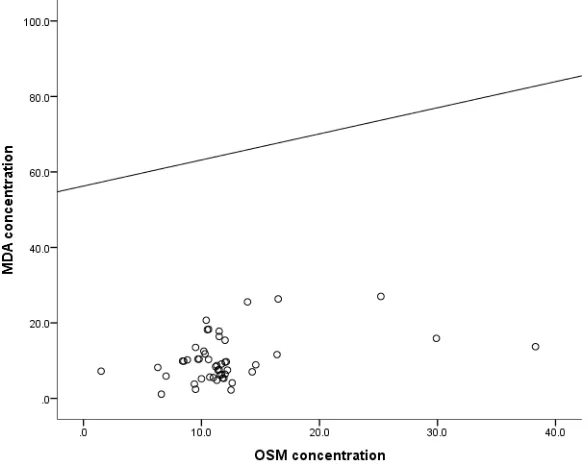
MDA concentration showed significant positive correlation with OSM concentration and negative correlation with survivin expression as shown in Fig(3) and Fig(4).
0 0.5 1 1.5 2 2.5
Control Cases
Su
rvvi
n ex
pr
es
sio
n
p<0.001
0 0.5 1 1.5 2 2.5
Colon Colorectal Rectum
Su
rvi
vi
n ex
pr
es
sio
n
Fig (3). Linear Pearson correlation of MDA with OSM concentration in patients group.
Fig(4) Linear Pearson correlation of MDA with survivin expression in patients group.
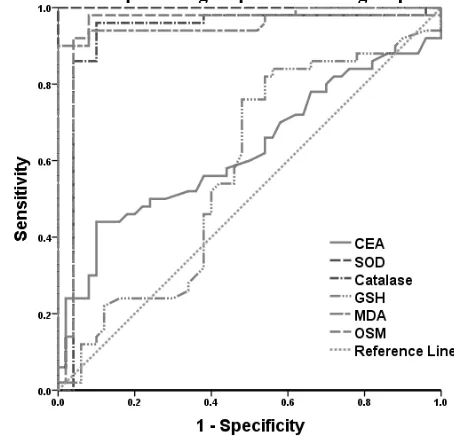
[image:5.612.162.456.60.293.2]CEA SOD Catalase GSH MDA OSM
AUC 0.626 1 0.929 0.576 0.963 0.942
Cut off 4.3 <164.7 350.3 <1.2 4.7 6.25
Sensitivity (%) 44 100 96 76 90 98
Specificity (%) 90 100 90 52 100 92
PPV (%) 81.5 100 90.6 61.3 100 92.5
NPV (%) 61.6 100 95.7 68.4 90.9 97.9
Accuracy (%) 67 100 93 64 95 95
P - <0.001 <0.001 0.211 <0.001 <0.001
AUC, area under the curve; CI, confidence interval; PPV, positive predictive value; NPV, negative predictive value; p1, probability for discrimination between colorectal carcinoma cases and control group; p2, comparison between AUC of CEA and AUC of each marker
Table (5) Performance criteria, AUC and cut off values of some laboratory markers for discrimination between colorectal carcinoma patients group and control group.
Fig (5). AUC and cut off values of some laboratory markers for discrimination between colorectal carcinoma cases and control group.
Regression analysis was conducted for prediction of colon, rectal and colorectal cancer within healthy control subjects, using age, gender, and laboratory data as covariates. Higher catalase, MDA, OSM ,survivin expression and lower hemoglobin concentration, SOD expression were associated with risk of colon, rectal and colorectal cancer development in univariate analysis. While in multivariate analysis, only higher MDA, OSM and survivin expression were considered as independent risk factors for colon , rectal and colorectal cancer development, these data were explained by Table (6).
Univariable Multivariable
p OR 95% CI p OR 95% CI
Age 0.376 1.207 0.120 1.699
Gender 0.198 0.987 0.198 2.198
Total leucocytic count 0.123 2.024 0.459 2.806
Hemoglobin 0.001 0.206 0.109 0.389 0.072 0.601 0.435 1.832
Platelet count 0.889 1.000 0.995 1.004
ALT (U/L) 0.898 0.998 0.964 1.033
AST (U/L) 0.194 1.028 0.986 1.072
Bilirubin 0.202 1.663 0.761 3.633
Albumin 0.071 1.445 0.101 4.817
Creatinine 0.087 1.456 0.287 2.198
CEA 0.157 1.005 0.998 1.012
SOD 0.005 0.998 0.997 0.999 0.130 2.824 0.180 8.731
[image:6.612.36.560.56.164.2] [image:6.612.195.422.240.461.2]GSH 0.525 1.031 0.939 1.132
MDA <0.001 3.499 1.988 6.156 0.009 5.235 1.517 18.060
OSM <0.001 1.555 1.325 1.826 0.002 1.085 1.030 1.143
Survivin expression 0.014 1.407 1.199 1.832 0.006 1.365 1.198 1.873
OR, odds ratio; CI, confidence interval.
Table (6). Regression analysis for prediction of colon,rectal and colorectal cancer .
VI. DISCUSSION
In the current study, the mean age of patients group was 53.8 ±13.9 years, while in control group was 52.8±5.8 years. There was no statistically significant difference between mean ages in our study groups. This is in line with Chernyavskiy et al [30] who found colon cancer was increased at younger ages (20-54 years). The relative different in age between our series and other studies may be attributed to different nature of daily behaviors, habitats, and time of correct diagnosis.
Regarding the sex in the current study, (34%) of patients were females and (66%) were males in patients group, while control group (40%) of patients were females and (60%) were males. There were no statistically significant differences between sex distributions in our study. This near-equal sex distribution was also reported by the studies of Gies et al [31] who determined 60% of patients were male and the study of Ng et al [32] the authors were noted not statistically significant in terms of age, gender.
Our results clarify hemoglobin concentration was significantly lower in patients group compared with control group (p <0.001). This is in agreement with Al-Saeed et al [33] who found that right-sided CRC had significantly low hemoglobin levels ( P = 0.001) and it can be utilized as a prognostic markers in CRC patients. This is may be due to the exits of blood with human wastes (stool).
In addition to, mean values of white blood cells, and platelets were 8.35 +/-SD 2.44, and 311.6 x 10 3 /mL +/- SD8.54, respectively which also was in line with previous studies. Mean values of white blood cells, and platelets were 11.9 SD 2.3, 7.67 10 6 /mL SD 2.44, and 343 x 10 3 /mL +/-SD 164.4, respectively (Al-Saeed et al.,) .The relative increased platelet count may be explained by it has an important role in metastasis of circulating tumor cells (CTCs) (Liang et al [34]. On the other hand, no significant differences were found regarding to clinical chemistry data that is comprised with Park et al [35] and Tsai et al [36] . This may be explained by none of our patients presented with colorectal liver metastasis. Furthermore, our results are in accordance with the study of Launay-Vacher et al [37] that found all colorectal patients have normal creatinine level.
The present study revealed that CEA concentration was increased in colorectal carcinoma patients group compared to control group, p value was 0.010. This is agreement with the study of Yoo and Yeo [38], that proved that CEA expression is evaluated to be higher in colon cancer cells , and is associated with response of rectal cancer to radiotherapy.
In respect to superoxide dismutase, lower SOD level was determined in patients group compared to control group, p value <0.001. Moreover, SOD concentration showed significant positive correlation with AST concentrations. This is in harmony with the aforementioned studies. Cancer cells have lower
antioxidant enzyme activity (Superoxide dismutases, catalase and glutathione peroxidases) when compared with their normal counterparts (Janicka et al [39]).
In the current study, increased catalase concentration in patients group compared to control group, p value was <0.001. In agreement with, concentrations of catalase in the colon cancer group are significantly higher than controls (Martin Mateo et al [40])
Bhagat et al [41], revealed a significant increase in the level of serum lipid peroxide such as malondialdehyde (MDA) as an oxidant (P<0.001) which had an important role in progression and pathogenesis of colorectal cancer. Similar findings were noted by the current study which determined significant increase of MDA concentration in patients group as compared to control group (P<0.001).
Regarding the OSM assessment, there was significant increase of OSM concentration in patients group compared to control group, p value was <0.001. This is in accordance with the former study of Gurluler et al [42], who noted significant higher serum OSM concentrations were detected in colon cancer patients than in controls (p < 0.001).
Our study clarifies survivin expression in colorectal cancer patients. It was determined significantly higher in patients group compared with control group, P <0.0001. Also, the study of Gunaldi et al [43], found that serum survivin levels were significantly higher in cancer patients than healthy subjects (P = 0.019) and these patients had 4 times increased risk of cancer. The study of Shojaei et al [44], showed that survivin is overexpressed in almost cancer types and has a crucial role in cancer progression, cancer cell resistance to anticancer drugs and ionizing radiation. Survivin has unique characteristics which make it a negative prognostic factor for patients with cancer (Li et al [45]).
Our results clarified that regression analysis was conducted for prediction of colon, rectal and colorectal cancer using age, gender, and laboratory data as covariates. Higher catalase, MDA, OSM, survivin expression and lower hemoglobin concentration, SOD were associated with risk of colon, rectal and colorectal cancer development in univariate analysis. While in multivariate analysis, only higher MDA, OSM and higher survivin expression were considered as independent risk factors for colon , rectal and colorectal cancer cancer development..
VII. CONCLUSIONS
screening of CRC. Additionally, their overexpression is conducted for prediction of colon, rectal and colorectal cancer within healthy control subjects.
ACKNOWLEDGMENT
I am grateful to Prof. Dr. Abdel-Aziz Fatouh Abel-Aziz, Dr. Mona Abu Bakr Al-Husseiny and Dr. Noha Mohamed Abd El Fattah Bakr for their support and giving me good guidelines for assignment throughout numerous consultations .
REFERENCES
[1] Ragunath P. K., Reddy B. V., Abhinand P. A., and Ahmed S. S. (2012).
Relevance of systems biological approach in the differential diagnosis of invasive lobular carcinoma & invasive ductal carcinoma. Bioinformation; 8(8): 359-364.
[2] Soriano L. C., Soriano-Gabarro M., and Garcia Rodriguez L. A.
(2018). Trends in the contemporary incidence of colorectal cancer and
patient characteristics in the United Kingdom: a population-based cohort study using The Health Improvement Network. BMC Cancer;18(1): 402.
[3] Guo T., Xie L., Zhao J., Song W., Dai W., Liu F., and Xu Y. (2018).
Trend analysis of morbidity and mortality of colorectal cancer in China from 1988 to 2009. Zhonghua Wei Chang Wai Ke Za Zhi; 21(1): 33-40.
[4] Al-Henhena N., Khalifa S. A., Ying R. P., Ismail S., Hamadi R.,
Shawter A. N.,and El-Seedi H. R. (2015). Evaluation of chemopreventive
potential of Strobilanthes crispus against colon cancer formation in vitro and in vivo. BMC Complement Altern. Med.; 15(1): 419.
[5] Ambrosini G., Adida C., and Altieri D. C. (1997). A novel anti-apoptosis
gene, survivin, expressed in cancer and lymphoma. Nat. Med.; 3(8): 917-921.
[6] Yamada Y., Kuroiwa T., Nakagawa T., Kajimoto Y., Dohi T., Azuma
H., and Miyatake S. (2003). Transcriptional expression of survivin and its
splice variants in brain tumors in humans. J. Neurosurg.; 99(4): 738-745.
[7] Badran A., Yoshida A., Ishikawa K., Goi T., Yamaguchi A., Ueda T.,
and Inuzuka M. (2004). Identification of a novel splice variant of the
human anti-apoptopsis gene survivin. Biochem. Biophys. Res. Commun.; 314(3):902-907.
[8] Beardmore V. A., Ahonen L. J., Gorbsky G. J., and Kallio M. J. (2004).
Survivin dynamics increases at centromeres during G2/M phase transition and is regulated by microtubule-attachment and Aurora B kinase activity. J. Cell. Sci.; 117(Pt 18): 4033-4042.
[9] Dai D., Liang Y., Xie Z., Fu J., Zhang Y., and Zhang Z. (2012). Survivin
deficiency induces apoptosis and cell cycle arrest in HepG2 hepatocellular carcinoma cells. Oncol. Rep.; 27(3): 621-627.
[10] Khan S., Jutzy J. M., Valenzuela M. M., Turay D., Aspe J. R., Ashok
A., and Wall N R. (2012). Plasma-derived exosomal survivin, a plausible
biomarker for early detection of prostate cancer. PLoS One; 7(10): e46737.
[11] Garg H., Suri P., Gupta J. C., Talwar G. P., and Dubey S. (2016).
Survivin: a unique target for tumor therapy. Cancer Cell International; 16(1):49.
[12] Shrivastava R., Singh V., Asif M., Negi M P S., and Bhadauria S.
(2018). Oncostatin M upregulates HIF-1alpha in breast tumor associated
macrophages independent of intracellular oxygen concentration. Life Sci.; 194:59-66.
[13] Chollangi S., Mather T., Rodgers K. K., and Ash J. D. (2012). A unique
loop structure in oncostatin M determines binding affinity toward oncostatin M receptor and leukemia inhibitory factor receptor. J.Biol. Chem.; 287(39):32848-32859.
[14] Komori T., and Morikawa Y. (2018). Oncostatin M in the development of
metabolic syndrome and its potential as a novel therapeutic target. Anatomical Science International;93(2):169-176.
[15] Stephens J M., and Elks C M. (2017). Oncostatin M: Potential
Implications for Malignancy and Metabolism. Curr Pharm Des,23(25); 3645-3657.
[16] Smigiel, J., Parvani, J. G., Tamagno, I., Polak, K., & Jackson, M. W.
(2018). Breaking the oncostatin M feed-forward loop to suppress metastasis
and therapy failure. J. Pathol.; 245(1):6-8.
[17] Bjorklund G., and Chirumbolo S. (2017). Role of oxidative stress and
antioxidants in daily nutrition and human health. Nutrition;33:311-321.
[18] Fukai T., and Ushio-Fukai M. (2011). Superoxide dismutases: role in
redox signaling, vascular function, and diseases. Antioxid Redox Signal,; 15(6):1583-1606.
[19] Putnam C D., Arvai A S., Bourne Y., and Tainer J A. (2000). Active
and inhibited human catalase structures: ligand and NADPH binding and catalytic mechanism. J. Mol. Biol.;296(1):295-309.
[20] Glorieux C., and Calderon PB. (2017). Catalase, a remarkable enzyme:
targeting the oldest antioxidant enzyme to find a new cancer treatment approach. Biol. Chem.;398(10):1095-1108.
[21] Skrzydlewska E., Sulkowski S., Koda M., Zalewski B., Kanczuga-Koda
L., and Sulkowska M. (2005). Lipid peroxidation and antioxidant status in
colorectal cancer. World J. Gastroenterol.; 11(3):403-406.
[22] Chomczynski,P. and N. Sacchi. (1987). Single-step method of RNA
isolation by acid guanidinium thiocyanate-phenol-chloroform extraction. Anal. Biochem.; 162:156-195.
[23] Boom,R., C.J.A. Sol, M.M.M. Salimans,C.L. Jansen, P.M.E.W.Dillen, and J. van der Noordaa. (1990). Rapid and simple method for purification of nucleic acids. J.Clin.Microbiol.;28:495-503.
[24] Croci DO et al (2012). Disrupting galectin-1 interactions with N- glycans
suppressors hypoxia-driven angiogenesis and tumorigenesis in Kaposki’s sacroma. J.Exp. Med.;209:1985-2000.
[25] Aebi H. (1984). Catalase in vitro. Method Enzymol.;105:121-6.
[26] Fossati P, Prencipe L,Bert G. (1980). Use of 3,5-
dichloro-2-hydroxybenzene sllforic acid /4-amino phenazone chromogenic system in direct enzymic assay of uric acid in serum and urine. Clin. Chem.;26:227-31.
[27] Beutler E, Duron O, Kelly MB. (1963). Improved method for the
determination of blood glutathione. J. Lab. Clin. Med.;61:882-8.
[28] Ohkawa H., Ohishi N., and Yagi K., (1979). Assay of lipid peroxidases in
animal tissues by thiobarbituric acid reaction.Analytical biochemistry;95:351-358.
[29] Nishikimi M., Appaji N., and Yagi K., (1972). The occurrence of super
oxide anion in the reaction of reduced phenazinemethosulfate and molecular oxygen. Biochem. Biophys. Res. Common.;46:849-854.
[30] Chernyavskiy P., Kennerley V. M., Jemal A., Little M. P., and
Rosenberg P. S. (2018). Heterogeneity of colon and rectum cancer
incidence across 612 SEER counties 2000-2014. Int. J. Cancer.; 31776.
[31] Gies A., Cuk K., Schrotz-King P., and Brenner H. (2018). Direct
comparison of ten quantitative fecal immunochemical tests for hemoglobin stability in colorectal cancer screening. Clin. Transl. Gastroenterol.;9(7): 168.
[32] Ng J. Y., Tan I. J., and Tan K. K. (2018). Are hemoglobin levels really
lower in faecal immunochemical test positive patients with colorectal cancer surgeon; 16(1):36-39.
[33] Al-Saeed E. F., Tunio M. A., Al-Obaid O., Abdulla M., Al-Anazi A.,
AlShenaifi J. Y., and Al-Obaidan T. (2014). Correlation of pretreatment
hemoglobin and platelet counts with clinicopathological features in colorectal cancer in Saudi population. Saudi J. Gastroenterol.; 20(2):134-138.
[34] Liang H., Yang C., Zhang B., Wang H., Liu H., Zhao Z., and Lai X.
(2015). Hydroxyethyl starch 200/0.5 decreases circulating tumor cells of
colorectal cancer patients and reduces metastatic potential of colon cancer cell line through inhibiting platelets activation. Med. Oncol.; 32(5):151.
[35] Park J. S., Park H. C., Choi D. H., Park W., Yu J. I., Park Y. S., and
Park J. O. (2014). Prognostic and predictive value of liver volume in
colorectal cancer patients with unresectable liver metastases. Radiat. Oncol. J.; 32(2):77-83.
[36] Tsai, H. J., Hsieh, M. Y., Tsai, Y. C., Liu, Z. Y., Hsieh, H. Y., Lee, C.
M., and Huang, C. T. (2014). Liver function tests may be useful tools for
advanced cancer patient care: a preliminary single-center result. Kaohsiung J. Med. Sci.;30(3):146-152.
[37] Launay-Vacher V., Janus N., and Deray G. (2016). Renal insufficiency
[38] Yoo B. C., and Yeo S. G. (2017). Identification of CEA-interacting proteins in colon cancer cells and their changes in expression after irradiation. Radiat. Oncol. J.;35(3):281-288.
[39] Janicka A., Szymanska-Pasternak J., and Bober J. (2013).
Polymorphisms in the oxidative stress-related genes and cancer risk. Ann. Acad. Med. Stetin;59(2):18-28.
[40] Martin Mateo M. C., Martin B., Santos Beneit M., and Rabadan J.
(1997). Catalase activity in erythrocytes from colon and gastric cancer
patients. Influence of nickel, lead, mercury, and cadmium. Biol. Trace Elem. Res.;57(1):79-90.
[41] Bhagat S. S., Ghone R. A., Suryakar A. N., and Hundekar P. S. (2011).
Lipid peroxidation and antioxidant vitamin status in colorectal cancer patients. Indian J. Physiol. Pharmacol; 55(1):72-76.
[42] Gurluler E., Tumay L. V., Guner O. S., Kucukmetin N. T., Hizli B., and
Zorluoglu A. (2014). Oncostatin-M as a novel biomarker in colon cancer
patients and its association with clinicopathologic variables. Eur. Rev, Med. Pharmacol Sci.; 18(14):2042-2047.
[43] Gunaldi M., Isiksacan N., Kocoglu H., Okuturlar Y., Gunaldi O., Topcu T. O., and Karabulut M. (2018). The value of serum survivin level in early diagnosis of cancer. J. Cancer Res. Ther.; 14(3):570-573.
[44] Shojaei F., Yazdani-Nafchi F., Banitalebi-Dehkordi M., Chehelgerdi M., and Khorramian-Ghahfarokhi M. (2018). Trace of survivin in cancer. Eur. J. Cancer Prev., 453.
[45] Li W., Lee M. R., Kim T., Kim Y. W., and Cho M. Y. (2018). Activated
STAT3 may participate in tumor progression through increasing CD133/survivin expression in early stage of colon cancer. Biochem. Biophys. Res. Commun.; 497(1):354-361.
AUTHORS
First Author – Abdel-Aziz A. F, Biochemistry Division, Department of Chemistry, Faculty of Science, Mansoura University, Mansoura, Egypt
Second Author – El-Hussiny M.A.B, Department of Clinical Pathology, Faculty of Medicine, Mansoura University, Mansoura ,Egypt
Third Author – Bakr N.M, National Research Center, Dokki, Egypt