Information Quality Impact toward Continuous
Intention of Using Tax E-Filing System
Radhi Abu Bakar 1 Mustakim Melan 2
uum.edu.my
1,21,2
Fakulti Pengurusan Teknologi & Logistics, Universiti Utara Malaysia
DOI: 10.29322/IJSRP.8.8.2018.p8050 http://dx.doi.org/10.29322/IJSRP.8.8.2018.p8050
Abstract: Even though tax e-filing system have improved,
issues regarding information quality such as the correctness of the output information, the availability of the output information at a time suitable for its use, and the comprehensiveness of the output information content issues which forced the users to queue in the system still exist. The purpose of this study is to investigate the relationship between information quality and individual taxpayers’ continuous intention toward using e-filing system in Malaysia. This study adopts the DeLone & McLean Information System Success Model as a theoretical basis firstly because it is a well-established theory and is widely used in information system technical-related research..
This review will include quantitative techniques and focused on individual taxpayer in Malaysia. The quantitative data that gained from the questionnaire are analysed by using the Smart PLS3. The methods of data analysis are selected based on the research questions and the variable characteristics.
Keyword: E-filing, Information Quality, Individual Taxpayer,
IS Success Model, Continuous Intention
I. INTRODUCTION
The development and management of e-government systems are becoming an essential element of modern public administration [1]. Government agencies around the world have embraced the digital revolution and placed a wide range of materials on the web including publications, databases, and actual online government services [2]. The initiatives of having such electronic information have been introduced worldwide into the early years in 1993 by the United States of America: Information superhighway updated with expanded electronic government 2001; followed by Malaysia: Electronic government in 1997; a year after by the United Kingdom: Information age government; in year 1999 by Canada: Government online; and in year 2000 by Singapore: E-government action plan [3].
According to Banerjee and Chou [4], e-government is to seem to be as a tool for the government to provide information, services and access in an electronically easiest way via personal computers, kiosks, telephones and other resources. E-government is technically referring to the delivery of information and services online via the internet [5] and it is claimed to be cost saving and improve public
satisfaction. E-government has become increasingly important to the aims at better and effective governance together with the significant benefits including the radically shrinking communications and information costs, improving connectivity, maximizing speed, broadening to reach, eradicating distance and encouraging participation of public in government [5]
Like many other developing countries, Malaysian government also has been investing in e-government [6]. Malaysia’s strategic shift into the information and knowledge era offers the country and the world an attractive global multimedia environment where the unique elements and attributes of information, ideas, people, service and technology are able to fuse, grow and deliver a globally replicable chain of innovative products, services and best practices [7].
The idea of moving towards e-government in Malaysia as an alternative of the existing manual system started with the vision to be achieved in year 2020 to become a fully developed country. In rationalizing the vision, the Malaysian Government since then is spending more than RM211 million [8].
One prominent type of e-government is the introduction of the e-filing system for income tax. Compared to other online service delivered by government, online tax filing is one of the most developed and widely used services. In the public sector with the move of online service, tax authorities tend to be at the leading edge of IT application [9]. Through this system, taxpayers are able to submit their tax returns electronically to the tax authorities.
been deems to be important for long term sustainable of web-based services [19] and central to the survival for the electronic service providers.
Moreover, even though tax e-filing system have improved [15], gained significant response and existed many years in most of the countries including in Malaysia, issues regarding information quality such as whether information acquired by the system is relevant for users, complete and easy to understand and technical difficulties which forced the users to queue in the system still exist and this caused user dissatisfied and weaken overall users' perception towards the system [20].
II. THE DELONE & MCLEAN (D & M) IS SUCCESS MODEL
The exploration of IS (Information System) continuous intention has been shaped significantly by DeLone and McLean’s (1992) IS Success Model. The model introduced six major variables of information system continuous intention; System Quality, Information Quality, Information System Use, User satisfaction, Individual Impact, and Organizational Impact. In the D & M IS Success model “System Quality” measures technical success, “Information Quality” measures semantic success and “Use, User satisfaction, Individual Impact and Organizational Impact” measures effectiveness success.
In 2003, DeLone & McLean extended their model and added service quality as an important indicator of success measure. Instead of adding more success measures, DeLone and McLean (2003) combined the different impact measures and categorized them as a net benefit in their extended model. The model includes six success dimensions, and holds that the constructs of information quality, system quality, and service quality individually and jointly affect the factors of use and user satisfaction. The model further states that there is a reverse relation between the amount of system use and user satisfaction. User satisfaction and use jointly affect net benefit.
This study only focused on information quality and how it relates with the continuous intention to use e-filing. Information quality is defined as the extent to which the information provided best fits customer needs [21], usually based on measures on how accurate, relevant, timely, and complete the information is to address such needs [22]. Information quality deals with the character of the real information that is produced by the IS and the extent to which the information produced meets the expected needs of the users [23]. Continuous intention is ones intention to continue using or long term usage intention of a technology [8]. In this study, eight (8) items were selected to measure information quality in areas that covered completeness, timely and precision as the main characteristics of information quality.
III. METHODOLOGY
The unit of analysis chosen for this study is the individual taxpayers in Malaysia who have used the e-filing system to file their tax online at least once. Based upon IRBM’s annual report [24], there are 2,922,229 millions individual taxpayers population throughout Malaysia who have used the e-filing system in year 2015. Sekaran (2003) suggests that for a population of over 1 million, a sample size of 384
is acceptable [25]. The present study targets sample of 2,000 respondents, approximately 143 taxpayers from each branch of the 14 states’ capital city of Malaysia. The Malaysian e-filing service http://ez.hasil.gov.my is considered an application area for this study.
The research process designed to achieve the aims and answer the questions [26] was conducted in quantitative method using structured, closed item surveys. Simple random sampling [27] will be used in this research study. Simple random sample is chosen from a larger set of a population. A simple random sample is a subset of a statistical population [26] in which each member of the subset has an equal probability of being chosen. A simple random sample is meant to be an unbiased representation of a group.
Data analysis for this quantitative phase of the research was done using the SEM approach [26]. PLS path modeling becomes more appropriate for real world applications and more advantageous to use when models are complex [28]. The soft modeling assumptions of PLS technique (i.e., ability to flexibly develop and validate complex models) gives it the advantage of estimating large complex models [29]. Measurement model was used to explain or assess constructs’ reliability and validity [26] of the current study. Secondly, structural model was used to conduct bivariate correlation analysis and simultaneous regressions analyses to establish correlations, and relationship effects among constructs under investigation. Additionally, using the PLS mechanisms of algorism and bootstrapping to examine the moderating effects. Partial least squares (PLS) is now well-known as the alternative to SEM method – this includes AMOS, LISREL, and other programs [30].
IV. FINDING
The purpose of this study is to investigate [26] the relationships among latent variables; therefore the latent analysis technique was the suitable option. Total of 406 surveys were complete and returned and additionally decidedly usable giving a reasonably worthy rate. In this way, the example scope of 406 for the review was remain adequate to execute different measurable assessments and give dependable yield with arrangement [31].
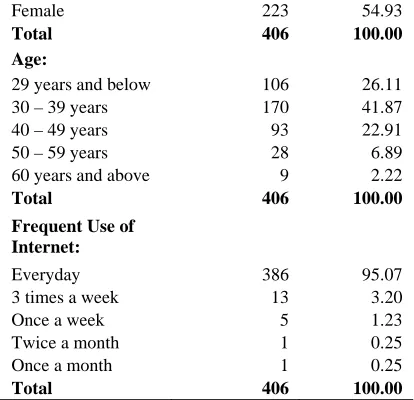
Table 1 summaries the characteristics of the 406 respondents in the sample from e-filing user samples of individual taxpayers in Malaysia. In total, from the 406 respondents, the respondents are 183 male respondents (45.07 percent) and 223 females (54.93 percent). The majority numbers of respondents were in an age group of 30-39 totalling 170 (41.87 percent). The lowest numbers of respondents were in an age group of 60 or above totalling 9 (2.22 percent). In a response to the question about how frequent one uses the internet, 95.07 percent of the respondents chose the option of everyday.
Table 1: Profiles of respondent characteristics
Profiles of E-filing User Samples
Respondent
Characteristics Responses Percent
Gender:
Female 223 54.93
Total 406 100.00
Age:
29 years and below 106 26.11
30 – 39 years 170 41.87
40 – 49 years 93 22.91
50 – 59 years 28 6.89
60 years and above 9 2.22
Total 406 100.00
Frequent Use of Internet:
Everyday 386 95.07
3 times a week 13 3.20
Once a week 5 1.23
Twice a month 1 0.25
Once a month 1 0.25
Total 406 100.00
This examination embraced internal consistency reliability [26]. This sort of unwavering quality is utilized to survey a scale whereby a few things are summed to frame an aggregate mark to be develop [31]. Subsequently, the interior reliability unwavering quality was legitimate correlation information of this review in the survey questionnaire [26]. The Survey questionnaire are in the pattern of a Likert scale.
To guarantee that the instrument created delivered exactly and precisely regarding estimations [26], Cronbach's coefficient alpha was chosen as a proper factual test for evaluating the dependability and legitimacy of the survey questionnaire. These results are reported in Table 2.
Table 2: Cronbach’s Alphas, rho_A, Composite Reliability and Average Variance Extracted(AVE)
Measurement Item Item
Cronbach's Alpha rho_A
Composite Reliability (AVE)
Information
Quality 8 0.888 0.901 0.912 0.571
Discriminant validity evaluation has turned into a for the most part acknowledged essential for investigating connections between dormant factors. For difference based auxiliary condition demonstrating, for example, halfway slightest squares, the Fornell-Larcker paradigm and the examination of cross-loadings are the predominant methodologies for assessing discriminant legitimacy.
[image:3.596.44.251.55.255.2]By method for a reenactment contemplate, we demonstrate that these methodologies don't dependably recognize the absence of discriminant legitimacy in like manner research circumstances. Therefore researcher propose an alternative approach, based on the multitrait-multimethod matrix, to assess discriminant validity: the Heterotrait-Monotrait ratio of correlations. These results are reported in Table 3.
Table 3: Discriminant Validity: Heterotrait-Monotrait Ratio
Continuous Intention To
Use
Information Quality
Continuous Intention To Use 1.000
Information Quality 0.879 1.000
[image:3.596.308.521.55.125.2]As illustrated in Figure 1, Information Quality (IQ) as a latent construct was measured by eight items comprising of IQ1 to IQ8. In addition, the endogenous variable is the continuous intention to use (CITU) e-filing. This was measured in five items (indicators).
Figure 1: The Establishment of theConstructs
Table 4: The Establishment of the Constructs
Construct Item Loading T Value Square R R Square Adjusted
Information Quality (IQ)
IQ1 0.849 49.712
0.673 0.668
IQ2 0.450 9.413
IQ3 0.823 41.066
IQ4 0.773 34.289
IQ5 0.778 29.150
IQ6 0.756 26.570
IQ7 0.787 42.508
IQ8 0.757 24.636
Once the goodness of the outer model has been confirmed (Table 4), the next stage was to test the hypothesized relationships among the variables. By running PLS Algorithm (Figure 2) and bootstrapping (Figure 3) using SmartPLS, the hypothesized model was tested.
[image:3.596.327.537.216.328.2] [image:3.596.310.526.633.750.2]Figure 3: Path Model Significance Result
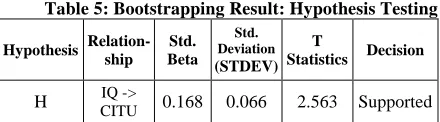
For the purpose of concluding whether the path coefficients are statistically significant or not, bootstrapping techniques embedded in this study with SmartPLS 3. As reported in Table 5, the T- Values with each path coefficient were generated using bootstrapping technique and P-Values subsequently were generated.
Table 5: Bootstrapping Result: Hypothesis Testing
Hypothesis Relation-ship
Std. Beta
Std. Deviation (STDEV)
T
Statistics Decision
H IQ ->
CITU 0.168 0.066 2.563 Supported The results showed that Information Quality (IQ) has significant effect on the continuous intention to use e-filing
system (β= 0.168, t*=2.563, p<0.05). Therefore, the
hypothesis of the effect of Information Quality (IQ) on continuous intention to use e-filing system was supported. From the PLS model, it has been exactly and hypothetically found that the best miserly model was accomplished with no changes [32]. The basic model was in this way acknowledged as the final model.
The finding proposed that information quality shows critical components that impact continuous intention to use e-filing system. What's more, it was found that information quality variables were imperative elements influencing to e-filing system adoption at a critical level of 0.05.
In this study, the aftereffects of hypotheses testing research address as real discoveries are presented. In this section, the research questions below can be answered by testing hypotheses.
Research Question: What is the relationship between Information Quality and continuous intention toward using e-filing system?
Hypotheses: There is a positive relationship between Information Quality and continuous intention toward using e-filing system.
V. THEORY AND PRACTICES IMPLICATIONS
This study identifies an important determinant of information quality impact toward continuous intention of using tax e-filing system. From the results it was found that information precision, information timeliness and sufficiency or completeness of the important information characteristics were used to evaluate continuous intention of using tax e-filing system. The implication of the results indicates that information presented should be more precise and should cater to the citizen’s needs, they should also provide information at the right time and information
should be sufficient for the citizen to complete the tax-related activities. According to Chen [33], information quality is the important characteristic of online tax web sites. Chen [33] measures information quality of tax web sites, focusing on accuracy, timeliness, and completeness of information presented in the web sites. To retain the current users, the tax authority needs to simplify the interface design to make the system easier to use. They should try to maintain easy design and functionality of the web site where citizens can get fast access to the information, get anywhere on the web site very easily and find the necessary information. They need to provide a well-organized web site that will help citizens to complete their tax related task with a minimal effort.
Along with the theoretical contributions, there are some practical implications of the research findings. It is important for the practitioner such as IRBM and other government organizations that are involved with the delivery of e-services, to be aware of the factors that contribute towards the future maintenance of the quality of the e-government services. The results can help IRBM to identify the key quality criteria for the e-filing web site that are valued by citizens, thus can improve its service delivery process. Additionally, IRBM can use the results to retain the current users and, along with that, they can use them to create new users. Both of these are important in making the service successful.
VI. LIMITATIONS AND EXTENSIONS
Significance of any examination is to understand its impediments[34]. This study makes a commitment to the level of advancement appropriation writing, however despite the fact that this review has given pertinent and intriguing bits of knowledge into the continuous intention of using tax e-filing system, it is vital to perceive its restrictions. There are a few constraints that should be recognized. Information technology has changed quickly.
The first limitation of the current study is that it was not possible to collect individual online taxpayers’ addresses from the tax authorities. Because of personal confidentiality concerns, the tax authority was unwilling to provide the addresses of online taxpayers. Walk-in taxpayers that were dealing at the IRBM’s service counter at all branches within Malaysia who were experienced with the e-filing system were selected as a sample for the data collection. The external validity of the research results thus may be limited to Malaysia.
Another limitation lies in the fact that the items used to measure information quality were selected from different studies. These constructs were measured directly with items, and dimensions were not included in this study. In the empirical analysis, trace of multidimensionality was not found within the items treated in the model. However, there can be additional items used to measure the variables, and it is proposed that further research may be conducted including additional items to judge the dimensionality as well as possible extension of the model even further.
[image:4.596.38.258.275.336.2]geographical locations and within their respective tax e-filing or similar comparable services.
VII.CONCLUSION
This research explored an important area of e-government particularly in the online tax system. It focused on the Malaysian online tax system and evaluated Malaysian tax information-related web sites to find out the impact of information quality criteria on the continuous intention of using such web sites. A citizen survey was conducted to identify the impact of information quality criteria from a user’s perspective. Results indicate that information preciseness, timeliness, and completeness were found to have an impact on the continuous intention of using government e-services.
REFERENCES
[1] Torres, L., Pina, V., and Acerete, B. (2005) E-Government developments on delivering public services among EU cities. Government Information Quarterly, 22(2), 217−238.
[2] West, D. M. (2002). Global eGovernment, 2002. Available: http://www.insidepolitics.org/egovt02int.html (Accessed 06 April 2016).
[3] Accenture. (2005) Leadership in customer service: New expectations, new experience. Retrieved 5 April, 2016, from www.accenture.com/xdoc/en/industries/government
[4] Banerjee, P., and Chou, P. (2004) An evaluation framework for analyzing e-government convergence capability in developing countries. Electronic Government, 1 (1), 29-48.
[5] Akman, I., Yazici, A., Mishra, A., & Arifoglu, A. (2005). E-Government: A global view and an empirical evaluation of some attributes of citizens. Government Information Quarterly, 22, 239-257.
[6] Lean, Zailani S, Ramayah T, Fernando Y. (2009). Factors influencing intention to use e-government services among citizens in Malaysia. International Journal of Information Management 2009; 29(6): 458-475.
[7] Muhammad Rais AK and Nazariah MK (2003) E-government in Malaysia. Pelanduk Publications (M) Sdn Bhd 2003.
[8] Azrnan, A. (2012) E-Government. Sabah: The Malaysian Administrative Modernisation and Management Planning Unit.
[9] Connolly, R. and Bannister, F. (2008). eTax Filing & Service Quality: The Case of the Revenue Online Service, Proceedings of World Academy of Science, Engineering and Technology, Volume 28, April 2008, issn 1307-6884.
[10] Hussein, R., Mohamed, N., Ahlan, A. R., and Mahmud, M. (2011) E-government application : an integrated model on G2C adoption of online tax. Transforming Government: People, Process and Policy, 5(3), 225–248.
[11] Ramoo, V., Ramayah, T., Lo, M.-C., & Ping, T. A. (2013). Electronic Tax Filing: Preliminary Evidence from a Developing Country. In Pablos, Patricia Ordóñez De Lovelle, Juan Manuel Cueva Gayo, Jose Emilio Labra Tennyson, Robert D. (eds). E-Procurement Management for Succefull Electronic Government Systems (pp. 147–156).
[12] Azmi, A. A. C., Kamarulzaman, Y., & Hamid, N. H. A. (2012). Perceived Risk and the Adoption of Tax E-Filing. World Applied Sciences Journal, 20(4), 532–539.
[13] Ghazali, N. (2014). The Adoption Factors of Using e-Government Services (Study Case in Malaysia). In 2nd International Conference on Technology, Informatics, Management, Engineering & Environment Bandung, Indonesia (pp. 326–330).
[14] Aziz, S. A., & Idris, K. M. (2012). The Determinants of Tax E-filing among Tax Preparers in Malaysia. World Journal of Social Sciences, 2(3), 182–188.
[15] Punitha, C., & Ibrahim, A. (2015). The Influence of Perceived System Quality and Perceived Information Quality Towards Continuance Intention of Tax E-Filing System in Malaysia. Journal of Technology and Operations Management, 10(2), 52–63.
[16] Alalwan, J. A. (2013). Continuance Intention to Use Government 2.0 Services : The Impact of Citizens’ Satisfaction and Involvement. International Journal of Electronic Government Research, 9(3), 58–73.
[17] Thominathan, S., & Ramayah, T. (2014). Explaining the e-Government Usage Using Expectation Confirmation Model: The Case of Electronic Tax Filing in Malaysia. In L. G. Anthopoulos & C. G. Reddick (Eds.), L. G. Anthopoulos and C. G. Reddick (eds.), Government E-Strategic Planning and Management, Public Administration and Information Technology (Vol. 3, pp. 287–304). New York, NY: Springer New York.
[18] Hu, P. J.-H., Brown, S. A., Thong, J. Y. L., Chan, F. K. Y., & Tam, K. Y. (2009). Determinants of service quality and continuance intention of online services: The case of eTax. Journal of the American Society for Information Science and Technology, 60(2), 292–306.
[19] Lee, Y., & Kwon, O. (2011). Intimacy, familiarity and continuance intention: An extended expectation -confirmation model in web-based services. Electronic Commerce Research and Applications, 10(3), 342–357.
[20] Chen, J. V., Jubilado, R. J. M., Capistrano, E. P. S., & Yen, D. C. (2015). Factors affecting online tax filing-An application of the IS Success Model and trust theory. Computers in Human Behavior, 43, 251–262.
[21] Chang, I. C., Li, Y. C., Hung, W. F., and Hwang, H. G. (2005), “An empirical study on the impact of quality antecedents on tax payers acceptance of internet tax-filing systems”, Government Information Quarterly, Vol. 22, pp. 389-410.
[22] DeLone , W. H., & McLean, E. R. (2003), The DeLone & McLean Model of information system success: A Ten-Year Update, Journal of Management Information System, 19(4), 9-30.
[23] Rai, A., Lang, S. S., and Welker, R. B. (2002), Assessing the Validity of IS Success Models: An Empirical Test and Theoretical Analysis, Information Systems Research, 13(1), pp 50-69.
[24] Inland Revenue Board Malaysia (IRBM). (2016). Annual Report 2015. http://www.hasil.gov.my/pdf/pdfam/laporan_ tahunan_2015.pdf.
[25] Sekaran, U. (2003), Research Methods for Business: A Skill-Building Approach, 4th (Ed.), John Wiley & Sons, Inc., New York.
[26] Jalil, N.A., & Melan, M. (2017). Technology Characteristics Effect toward Business Intelligence in Multinational Corporation. Imperial Journal of Interdisciplinary Research, 3(2), 477–482.
[27] Sekaran, U. (2000), Research Method for Business: A Skill-Building Approach, John Wiley and Sons, Inc., New York.
[28] Fornell, C., & Bookstein, F. (1982). A comparative analysis of two structural equation models: LISREL and PLS applied to market data, in C. Fornell (Ed.), A second generation of multivariate analysis (Vol. 1, pp. 289– 323). New York, NY: Praeger.
[29] Akter, S., D’Ambra, J. & Ray, P. (2011). An Evaluation of PLS based Complex Models: The Roles of Power Analysis, Predictive Relevance and GoF Index. In Proceedings of the Seventeenth Americas Conference on Information Systems, Detroit, Michigan, August 4th-7th
2011.
[30] Hair, J., Black, W. C., Babin, B. J., & Anderson, R. E. (2010). Multivariate Data Analysis (7th ed.). Upper Saddle River, New Jersey: Pearson Education International.
[31] Hair, J., Black, W. C., Babin, B. J., Anderson, R. E. and Tatham, R. (2006). Multivariate Data Analysis (6th ed.). Upper Saddle River, New Jersey: Prentice-Hall.
[33] Chen, C. (2010), “Impact of quality antecedents on taxpayer satisfaction with online tax-filing systems – an empirical study”, Information & Management, Vol. 47, pp. 308-15.