International Journal of Emerging Technology and Advanced Engineering
Website: www.ijetae.com (ISSN 2250-2459,ISO 9001:2008 Certified Journal, Volume 5, Issue 10, October 2015)
117
Analysis, Detection and Classification of ECG Signal for
Myocardial Infarction using Simple Cross-correlation Function
Akhila. N
1, Tessamma Thomas
21Former Student, 2Retired Professor, Department of Electronics, Cochin University of Science and Technology, Cochin,
Kerala, India
Abstract—Analysis of standard clinical electrocardiogram signal is one of the basic routine tests for preliminary screening of cardiac disorders. This work deals with classification of normal and IMI (Inferior Myocardial Infarction) ECGs and presents a method for analysis of Electrocardiogram (ECG) patterns using Cross Correlation. The application of cross correlation to two ECG beats and the cross examination of the results reveals the localized similarities of the signals. In this paper two novel parameters are used for the analysis and classification of ECG signals; they are the maximum and average value of the cross correlated spectrum. Also, in this work, two methods are developed for the classification of MI: Method 1 directly uses the extracted single beat of ECG signal for further processing whereas Method 2 uses the average value of corresponding coefficients in the first 5 beats of the ECG signal as the single beat sample for further processing. The recognition score obtained for first method is 80% and that for second method is 91% .
Keywords— Electrocardiogram, QRS complex, Cross correlation, Myocardial infarction
I. INTRODUCTION
Electrocardiogram (ECG) is widely used for diagnosing many cardiac diseases, which is one of the major causes of mortality all over the world. The diagnosis of cardiovascular diseases and its prevention is a very important issue in the medical field. The analysis of standard clinical electrocardiogram signal is one of the basic routine tests for preliminary screening of cardiac disorders. The abnormality considered in this scenario is the Inferior Myocardial infarction (IMI) or simply the heart attack. Using the basic concepts of cross correlation function, Myocardial infarction can be detected easily.
The proper analysis of individual ECG beats including their characteristic shape, morphological features, and spectral properties can yield significantly correlated clinical information for automatic detection of the ECG pattern. However, this is a challenging problem because the most of the characteristics of ECG signals show significant variations for different patients under different physical conditions.
For better results of ECG analysis, reliable and accurate detection of ECG features are required. Many methods for ECG analysis and classification have been developed using different tools like wavelet transform, neural networks etc, each with different distinguishing features [1][2][3][4][5]. In the papers by Swati Banerjee and Madhuchhanda Mitra [1][2] and [3], detection of Myocardial infarction(MI) is performed using cross wavelet transform. These papers gives a detailed approach on denoising, R-peak detection and single beat extraction of ECG signals.
Many algorithms have been developed for the purpose of QRS detection. Most of these methods have been derived from Artificial Neural Networks, genetic algorithms, wavelet transforms and filter banks[6]. Pan-Tompkins algorithm is one of the first algorithms used for QRS detection, which uses the concept of signal derivatives for detection of the prominent slope of the QRS complex [5]. Neural Networks have been used for QRS detection, by training adaptive, non-linear ECG signal predictors[7]. Other approaches includes, multi-resolution wavelet analysis[8][9], cross‐correlation methods[10][11][12] etc. Almost all of these algorithms share a common algorithmic structure, that is, a preprocessing stage, a feature extraction stage, and a decision stage in which peak detection and decision logic are included.
In this work a method for analysis of ECG signals using the concept of Cross Correlation is developed. The cross-correlation between two time-domain signals yields a measure of similarity between the two analyzed waveforms. The ECG signal is first denoised before any further processing. This is done using the concept of wavelet decomposition[13]. Then R peak registration followed by single beat extraction should be done[1][4]. After preprocessing the normal and abnormal samples, the concept of simple cross correlation is applied on them. Only inferior MI class is considered for this work. Inferior MI is identifiable from the inferior leads II, III and aVF. Lead III data is selected for this work.
International Journal of Emerging Technology and Advanced Engineering
Website: www.ijetae.com (ISSN 2250-2459,ISO 9001:2008 Certified Journal, Volume 5, Issue 10, October 2015)
118 II. OVERVIEW OF CROSS CORRELATION
Cross correlation is a simple measure to check the extent of similarity between two signals. The similarity of two signals can be measured as a function of lag or shift of one signal with respect to the other signal.
A. Concept of Cross Correlation
Cross correlation is used to find out the proximity of alignment of two signals. If the cross correlation value is closer to 1, it indicates high level of correlation or matching of the two signals. The cross-correlation will yield a 0 when there is totally no correlation. A negative value indicates one of the signal increases as the other decreases.
For a length N vector, the raw correlation values are given by
The output vector C has elements given by
The correlation function requires normalization to estimate the function properly. In signal processing the cross-correlation is a convolution operation with one of the two sequences reversed. Since time reversal corresponds to complex conjugation in the frequency domain, the DFT can be used to compute the cross-correlation [17][18].
B. Cross Correlation Function
The Correlation function r = xcorr(x,y) returns the cross-correlation of two discrete-time sequences, x and y. Cross-correlation measures the similarity between x and shifted (lagged) copies of y as a function of the lag. If x and y have different lengths, the function appends zeros at the end of the shorter vector so it has the same length, N, as the other. xcorr estimates the cross-correlation sequence of random processes. Autocorrelation is handled as a special case.
The true cross-correlation sequence is
where xn and yn are stationary random processes,
-and E {} is the expected value
operator. xcorr must estimate the sequence because, in practice, access is available to only a finite segment of the
infinite-length random process. returns
the cross-correlation sequence in a length 2N-1 vector, where x and y are length N vectors.
is the autocorrelation sequence for the vector x. Where x is an N-by-P matrix,
returns a matrix with 2N-1 rows whose P2 columns contain the cross-correlation sequences for all combinations of the columns of X [23][24].
III. DESIGNED METHODOLOGY
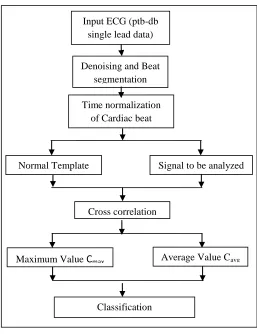
The designed algorithm includes denoising of data, R-peak detection for beat segmentation, single beat extraction, cross correlation of the two signals in frequency domain, parameter extraction and finally classification of data as normal or abnormal. According to the approach by which the single beats for both Normal template and Sample template are extracted, there are two methods: In the first method, from the R-peaks, single beat of signal is directly extracted. In the second method, the single beat is extracted as an average of the first five beats of the sample.
A. Denoising and R-peak registration
Denoising is one of the major tasks in the pre-processing stage. The method used for denoising [4] is DWT based
decomposition of signal and then the selective
reconstruction of the coefficients. Here, 10-level
decomposition is performed. The coefficients
corresponding to the noise frequencies are identified and removed during reconstruction process.
High frequency noises are eliminated by discarding the detail coefficients D1, D2. Approximation coefficientA10 contains the baseline noise along with the DC component of the ECG. Powerline interference component is concentrated in the A5 coefficient. So by removing all these specified coefficients and reconstructing the signal, a denoised ECG signal array is obtained.
In an ECG signal, the peaks with maximum amplitude are the R-peaks. R-peak registration process is also done by DWT based decomposition of signal and then selective reconstruction of the coefficients D3,D4 and D5 [4]. The frequency bands corresponding to the R-peaks are concentrated in these 3 sets of coefficients. The algorithm for R peak detection is given as:
1.Peak = absolute_maximum (QRS region). 2. IF Peak is POSITIVE.
International Journal of Emerging Technology and Advanced Engineering
Website: www.ijetae.com (ISSN 2250-2459,ISO 9001:2008 Certified Journal, Volume 5, Issue 10, October 2015)
119
B. Normalization of cardiac cycles
For amplitude normalization, the simple normalization procedure is performed. ie, the signal amplitudes are divided by the absolute maximum amplitude of the signal so that the signal level varies in the interval [-1,1] only.
For point-to-point correlation analysis, there should be equal number of samples in all the beats. For this purpose, Fourier transform based interpolation is used. After interpolation, all segmented beats have 1000 samples.
C. Single beat extraction
Once the R peak registration is done, the RR interval is computed and divided into 2:1 ratios (say, 2x: x points) [1][2][3]. A single cardiac cycle gives the details of the pathological condition of the subject. So each signal needs to be segmented before subjecting it to cross correlation analysis.
Considering x points to the left and 2x points to the right of the R index, one cardiac beat can be extracted. As the heart rate varies for each subject, the length of the cardiac cycle also varies.
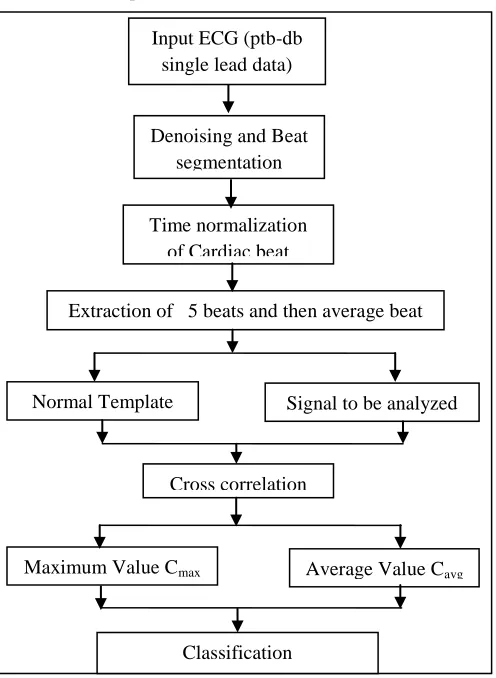
In this work, two methods are performed: Method 1 directly uses the extracted single beat of ECG signal for further processing whereas the method 2 uses the average value of corresponding coefficients in the first 5 beats of the ECG signal as the single beat sample for further processing. The averaging in method 2 take care of the fluctuations of ECG from one beat to the next and thus improves the result than method 1. The schematic representations of both the methods are shown in figure1 and figure 2 respectively.
D. Cross Correlation
After single beat extraction, the extracted single beat of the sample to be analyzed is cross-correlated with the single beat of the Normal sample.
In Method 1, the single beats of both normal and abnormal templates are subjected to simple cross correlation.
[image:3.612.325.582.130.464.2]In Method 2, instead of considering one beat of the normal sample for analysis, average beat of the first 5 beats are extracted as in the case of the abnormal ECG and cross correlation is found out between them. The number of beats to be averaged is fixed by observing the ECG signal variation.
Fig. 1. Schematic representation of Method 1
The algorithm used for cross correlation is same for both the methods. The only difference is in selecting the single beat for correlation. The algorithm for finding cross-correlation of normal and abnormal beats is given as:
1. The FFTs of the normal and the testsample template signals of onebeat are first obtained.
2. Then their magnitudes are found out.
3. This magnitude of FFT of the Normal and Sample signals
are used as the two sequences.
4. Cross-correlated array is obtained using cross-correlation
function.
E. Parameter Extraction
The parameters for classification are extracted, from the cross correlated result array. The parameters for classification are given below.
Input ECG (ptb-db single lead data)
Denoising and Beat segmentation
Time normalization of Cardiac beat
Normal Template Signal to be analyzed
Cross correlation
Maximum Value
Cmax
Average Value CavgInternational Journal of Emerging Technology and Advanced Engineering
Website: www.ijetae.com (ISSN 2250-2459,ISO 9001:2008 Certified Journal, Volume 5, Issue 10, October 2015)
120 1. Cmax : Maximum correlated value
This represents the maximum value of the result array. 2. Cavg : Average correlated value
This represents the average value of the result array.
F. Classification
For a bulk number of ECG samples, the above parameters are analyzed and a threshold value is set for each of the parameter. Threshold based comparison method is employed for final classification. Based on the obtained threshold, the sample can be classified as either normal or abnormal. The classification rule can be summarized as follows :
1. Cmax = absolute_maximum (cross-correlation result array).
2. Cavg = mean (cross-correlation result array). 3. IF Cmax>= Cmax_th and Cavg>= Cavg_th THEN ‘Sample is Normal’.
[image:4.612.43.291.361.700.2]4. ELSE ‘Sample is Abormal’.
Fig. 2. Schematic representation of Method 2
IV. EXPERIMENTAL OBSERVATIONS AND RESULTS
In this work, a method for analysis of ECG patterns using Cross-correlation is presented. ECG signal analysis is done in MATLAB .
A. Data
All the data used for this work are taken from the Physikalisch-Technische Bundesanstalt diagnostic 12-lead ECG database (ptbdb) of Physionet [16]. Single lead data (here, lead III) is selected for this work. The sampling frequency of the dataset is 1 kHz. The results are tested in Lead-iii of 45 samples including 17 normal and 28 abnormal samples. Since it is an abundant and well-classified dataset , it proves the perfect database for this work.
B. Selection of the Normal Template
The normal template selected is the beat ensemble of a 25 year old pathologically normal non smoking male individual with a heart rate of 72 beats/min.
C. Denoising and R-peak registration
The preprocessing stage consists of the lead selection and DWT decomposition of the lead data. 10-level DWT based decomposition is performed in the preprocessing stage. In the ptb-db data files, sampling frequency of the ECG data is 1 kHz. Daubechie’s wavelet families are similar to the shape of the QRS and hence db4 is selected as the mother wavelet for the present analysis.
The selected ECG signal is first denoised using the concepts of DWT, by eliminating specified coefficients D1, D2, A5 and A10 and then reconstructing the signal. The ECG signal selected for analysis and the denoised signal is shown in the figure 3.
The QRS region is obtained from the detail coefficients D3, D4 and D5. Inorder to obtain the QRS region, the denoised signal is once again decomposed with n=10 levels. Then the required coefficients D3, D4 and D5 only are selected and reconstructed.
The normalized R-peaks detected using specified algorithm is shown below in the figure 4. The R peaks are the maximum amplitude values within the QRS windows. Input ECG (ptb-db
single lead data)
Denoising and Beat segmentation
Time normalization of Cardiac beat
Extraction of 5 beats and then average beat
Normal Template Signal to be analyzed
Cross correlation
Maximum Value Cmax Average Value Cavg
International Journal of Emerging Technology and Advanced Engineering
Website: www.ijetae.com (ISSN 2250-2459,ISO 9001:2008 Certified Journal, Volume 5, Issue 10, October 2015)
121
[image:5.612.49.299.134.341.2]Fig. 3. ECG signal before and after denoising respectively
Fig. 4. The detected R-peaks after normalization
D. Extracted single beats and Correlation plots
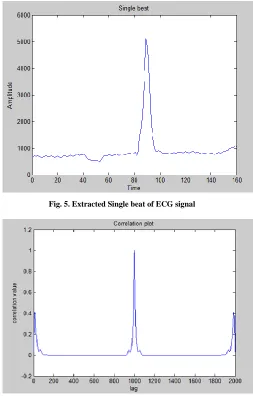
From the obtained R-peaks a single cardiac beat can be extracted by considering x points to the left and 2x points to the right of R index. The extracted single beat for an ECG sample is shown in the following figure 5.
The single beats of both normal and abnormal templates are subjected to simple cross correlation. Correlation plot is used to represent the cross-correlation results in a graphical form. Y axis represents cross-correlation value and X-axis shows lag or signal shift.
The correlation plot for a normal sample is shown in the figure 6. It is clear from the plot that it possesses a high correlation (approximately 1).
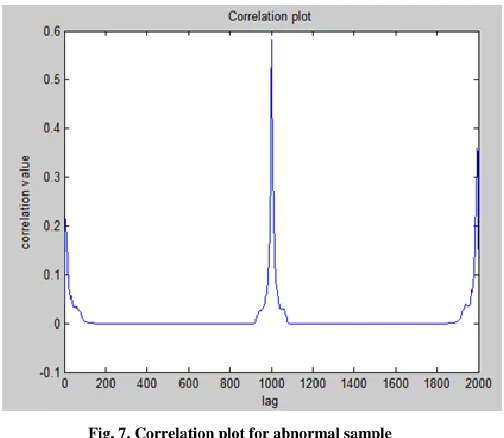
The correlation plot for an abnormal sample is shown in fig.7. Here, correlation value is less as well as the waveform is slightly distorted.
E. Parameter extraction and classification
Threshold values are to be next fixed up for the 2 parameters for the distinction between the normal and abnormal ECG sample sets.
In method1, by observing the range of values for a set of normal and abnormal samples, the threshold values are fixed as: Cmax=0.9650 and Cavg=0.0240.
[image:5.612.322.575.309.705.2]For method 2 also, the same set of normal and abnormal samples are observed for fixing the threshold values, and the values selected for final calculation are : Cmax=0.9448 and Cavg=0.1209.
Fig. 5. Extracted Single beat of ECG signal
[image:5.612.49.299.364.555.2]International Journal of Emerging Technology and Advanced Engineering
Website: www.ijetae.com (ISSN 2250-2459,ISO 9001:2008 Certified Journal, Volume 5, Issue 10, October 2015)
122
F. Discussion
[image:6.612.48.300.244.463.2]Table 1 shows the analysis results of the 2 methods on the 45 normal and abnormal (IMI) ECG data sets. It can be seen that, recognition score for normal and abnormal data are respectively, 64.71% and 89.28% for method 1 and that for method 2 are 82.35% and 96.43% respectively. The results are significantly improved for the 2nd method, as the variations over the beats are averaged out in the 2nd method, to give a better representation of the samples.
Fig. 7. Correlation plot for abnormal sample
TABLEI
ANALYSIS RESULTS OF THE SAMPLE DATA
Method Method 1 Method 2
Typesof
samples Normal Abnormal Normal Abnormal
No. ofSamples
Observed 17 28 17 28
No. ofSamples correctly detected
11 25 14 27
Accuracy/ Recognition
score ( % )
64.71 89.28 82.35 96.43
Over all
accuracy(%) 80.00 91.11
For method 1, the analysis with 45 different normal and abnormal sample gives an overall accuracy of 80%. This is a simple method with comparatively less calculation, good accuracy.
For method 2, averaging of first 5 beats of a sample yield an averaged single beat. This modification yields better results. Better accuracy is obtained. Using threshold based comparison when the same sets of 45 samples are analyzed, it gives an overall accuracy of 91%. So using this simple method with comparatively less calculation better accuracy is obtained. Also more number of normal samples are correctly detected.
V. CONCLUSION
Heart diseases are one of the main causes of death in most countries of the world. Therefore, the diagnosis of cardiovascular diseases and its prevention is a very important issue in the medical field. The analysis of standard clinical electrocardiogram signal is one of the basic routine tests for preliminary screening of cardiac disorders.
Cross correlation is applied to the two time series ECG samples, which reveals the localized similarities as well as the extent of mismatches between the two series. The maximum and average values of correlation i.e., Cmax and
Cavg are used for the cross examination of a single normal
and abnormal beat with that of a standard normal template beat.
Using threshold based comparison, when a set of 45 ECG samples are analyzed for Myocardial infarction, it gives an average recognition score of 80% and 91.11 % respectively for method 1 and method 2. Method 2 is a more simple method with comparatively less calculation, better accuracy. The results are significantly improved for the 2nd method, as the variations over the beats are averaged out in the 2nd method, to give a better representation of the samples
In future, the work can be extended to classify the ECG signal based on these extracted features, using signals from more than a single lead or a different parameter can be used to classify signal as normal or abnormal. This can be further extended to find out different cardiac abnormalities other than MI.
REFERENCES
[image:6.612.43.296.493.708.2]International Journal of Emerging Technology and Advanced Engineering
Website: www.ijetae.com (ISSN 2250-2459,ISO 9001:2008 Certified Journal, Volume 5, Issue 10, October 2015)
123
[2] Swati Banerjee, M. Mitra, ‘An approach for ECG based Cardiac abnormality detection through the Scope of Cross Wavelet Transform’ , IEEE Proceedings of 4th International Conference on
Intelligent Human Computer Interaction, Kharagpur, India,
December 27-29, 2012
[3] Swati Banerjee, M. Mitra, ‘Application of Cross wavelet Transform and Wavelet Coherence for classification of ECG patterns’ , 2012 Third International Conference on Emerging Applications of Information Technology (EAIT)
[4] S. Banerjee, R. Gupta, and M. Mitra, ‘Delineation of ECG characteristic features using multiresolution wavelet analysis method’,Measurement, vol. 45, no. 3, pp. 474–487, Apr. 2012. [5] P. Jiapu and W. J. Tompkins, ‘A real time QRS detection algorithm’
IEEE Trans. Biomed. Eng., vol. 32, no. 3, pp. 230 236, Mar. 1985. [6] Carsten Meyer, Jose Fernadez Gavela, Matthew Harris, ‘Combining
Algorithms in Automatic Detection of QRS Complexes in ECG Signals’, IEEE transactions on Information Technology in Medicine, Vol. 10, No.3, July 2003.
[7] Reaz, M.B.I , Sze Wei Lee. ‘Detection of the R-wave peak of QRS complex using Neural network’ , Information and Communication Technologies: From Theory to Applications, 2004. Proceedings. 2004 International Conference on 19-23 April 2004, 0-7803-8482-2. [8] Li C., Zheng V, and Tai C, ‘Detection of ECG characteristic points
using wavelet transforms’, IEEE Trans. on BME, vol. 42, pp. 21 – 28,1995.
[9] Saurabh Pal , Madhuchhanda Mitra, ‘Detection of ECG characteristic points using Multiresolution Wavelet Analysis based Selective Coefficient Method’, Elsevier, www.elsevier. com/locate/measurement, Measurement 43 (2010) 255–261,October 2009
[10] Swati Banerjee, M. Mitra, ‘Cross Wavelet Transform Based Analysis of Electrocardiogram Signals’ , International Journal of Electrical, Electronics and Computer Engineering 1(2): 88-92(2012) Special Edition for Best Papers of Michael Faraday IET India Summit-2012, MFIIS-12
[11] Arun Navaria, Dr.Neelu Jain, ‘Denoising and feature extraction of ECG using Discrete Wavelet Transform’, International Journal of Emerging Technologies in Computational and Applied Sciences,5(3),June-August 2013,pp.222-226
[12] Vanisree K, Jyothi Singaraju, ‘Automatic Detection of ECG R-R Intervalusing Discrete Wavelet Transformation’ , Vanisree K et al. / International Journal on Computer Science and Engineering (IJCSE), ISSN : 0975-3397,Vol. 3 No. 4 Apr 2011
[13] C. Torrence and G. P. Compo, A practical guide to wavelet analysis, Bull. Amer. Meteo-rol. Soc., vol. 79, no. 1, pp. 6178, 1998. [14] A. Grinsted, J. C. Moore, and S. Jevrejeva, ‘Application of the cross
wavelet transform and wavelet coherence to geophysical time series’, Nonlinear Process Geophys., vol. 11, nos. 56, pp. 561566, 2004.
[15] Mahmoodabadi, S. Z., A. Ahmadian, M. D. Abolhasani, M. Eslami, and J. H. Bidgoli. "ECG feature extraction based on multiresolution wavelet transform." In Engineering in Medicineand Biology Society, 2005. IEEE-EMBS 2005. 27th Annual International Conference of the,pp. 3902-3905. IEEE, 2006.
[16] PTB Diagnostic ECG Database Directory, Physiobank Archive Index, PTB Diagnostic ECG Database [Online]. Available: <http://physionet.org/physiobank/database>
[17] J. G. Proakis and D. G. Manolakis, Digital Signal Processing, Engle-wood Cliffs, NJ, USA: Prentice-Hall, Apr. 2006.
[18] Soman, K. P., and K. I. Ramachandran., Insight Into Wavelets From Theory To Practice,2Nd Ed. PHI Learning Pvt. Ltd., 2005. [19] Mahmoodabadi, S. Z., A. Ahmadian, M. D. Abolhasani, M. Eslami,
and J. H. Bidgoli. ”ECG feature extraction based on multiresolution wavelet transform.” In Engineering in Medicine and Biology Society, 2005. IEEE-EMBS 2005. 27th Annual International Conference of the, pp. 3902-3905. IEEE, 2006.
[20] Swati Banerjee and Madhuchhanda Mitra, ‘Classification of ST and Q Type MI variant using thresholding and neighbourhood estimation method after cross wavelet based analysis’, Research gate,http://www.researchgate.net
[21] ECG learning <http://ecg.utah.edu/outline>
[22] Measuring signal similarities – concept of correlation MATLAB, <http://in.mathworks.com/help/signal/examples/measuring-signal-similarities.html>