Development and validity testing of an
IPFspecific version of the St George's
Respiratory Questionnaire
Yorke, J, Jones, PW and Swigris, JJ
http://dx.doi.org/10.1136/thx.2010.139121
Title
Development and validity testing of an IPFspecific version of the St
George's Respiratory Questionnaire
Authors
Yorke, J, Jones, PW and Swigris, JJ
Type
Article
URL
This version is available at: http://usir.salford.ac.uk/12817/
Published Date
2010
USIR is a digital collection of the research output of the University of Salford. Where copyright
permits, full text material held in the repository is made freely available online and can be read,
downloaded and copied for noncommercial private study or research purposes. Please check the
manuscript for any further copyright restrictions.
For more information, including our policy and submission procedure, please
Submitted to Thorax March 2010
Development and Validity Testing of an IPF-Specific Version of the SGRQ
Janelle Yorke, RN, PhD1 Paul W. Jones, MD2 Jeffrey J. Swigris, DO, MS3
1
School of Nursing, University of Salford, Greater Manchester UK
2
Respiratory Medicine, Cardiac and Vascular Sciences, St. George’s, University of London, London UK
3
Autoimmune Lung Center and Interstitial Lung Disease Program, National Jewish Health, Denver, Colorado
Dr. Swigris is supported in part by a Career Development Award from the NIH (K23 HL092227)
Running Title: SGRQ-I Abstract Word Count: 249 Word Count: 2830
Author Correspondence: Jeffrey J. Swigris, DO, MS Assistant Professor of Medicine
Autoimmune Lung Center and Interstitial Lung Disease Program National Jewish Health
Rationale: The Saint George’s Respiratory Questionnaire (SGRQ) is often applied to assess health related quality of life (HRQL) in patients with idiopathic pulmonary fibrosis (IPF). Some SGRQ items will inevitably have weaker measurement properties than others when applied to this population. This study was conducted to develop an IPF-specific version of the SGRQ. Methods: We analysed data from a recently completed trial that enrolled subjects with IPF who completed the SGRQ and other meausures at baseline and six months. There were four phases to this study: 1) remove items with missing responses and using Rasch analysis on retained items to identify fit and refine item response categories; 2) develop a new scoring scheme; 3) test agreement between original and revised versions, and test construct validity of the revised SGRQ; and 4) reword to finalize the IPF-specific version (SGRQ-I).
Results: Items were removed due to missing responses (n=6) and misfit to the Rasch model (n=10). For certain items, disordered response thresholds were identified and corrected by collapsing response categories. A scoring algorithm was developed to place SGRQ-I scores on scale with SGRQ scores. For any given outcome measure (e.g., pulmonary physiology, functional capacity, dyspnea), correlations were similar between pairs that included original SGRQ scores and corresponding pairs that included SGRQ-I scores. Internal reliability for each SGRQ-I component was comparable to the original SGRQ (Symptoms 0.62; Activities 0.80; Impacts 0.85).
Conclusions: The SGRQ-I contains items from the original SGRQ that are the most reliable for measuring HRQL in patients with IPF.
Idiopathic pulmonary fibrosis (IPF) is a progressive fibrotic interstitial lung disease (ILD) that induces shortness of breath,1 resulting in poor quality of life2,3 and significantly shortened survival for most patients.4 Available treatments have no reliable effect on prolonging life. In patients with IPF, health related quality of life (HRQL) is increasingly viewed as an important outcome used to assess the effectiveness of treatments and to monitor disease trajectory. HRQL refers specifically to a person’s satisfaction with life domains that either affect or are affected by his or her health status.5 A plethra of generic and condition-specific instruments exsit to measure HRQL. Condition-specific instruments are tailored to patients with the disease of interest, a quality that makes them more sensitive to underlying change than generic instruments.5 For IPF, at this time, no disease-specific measure of HRQL is available, so investigators have used generic or non-IPF respiratory-specific instruments to measure HRQL in multi-center trials.6,7 The potential problem is that these instruments may not capture many of the effects IPF has on patients’ lives,8 thus calling into question whether HRQL results from these trials are valid.
The Saint George’s respiratory questionanire (SGRQ) was originally designed and validated for use in patients with chronic obstructive pulmonary disease (COPD).9 It has been in existence for nearly two decades. It has been validated for use in other chronic respiratory diseases, and it also appears to possess acceptable validity and reliability for use in patients with IPF.10-12 However, it is enevitable that some SGRQ items have weaker measurement properties than others when applied to patient populations other than the one for which it was developed. Removing such items, and modify response options for retained items, would generate a version of the SGRQ tailored for patients with IPF. This study was conducted to refine the content of the SGRQ to develop an IPF-specific version.
Overview and Study Sample
For this study, we used data from a recently completed multi-centered, placebo-controlled trial (the Bosentan Use in ILD-1 or BUILD-1)6. In BUILD-1, subjects were randomized to receive either bosentan or placebo; for the current study, data from these two groups were pooled. Subjects underwent assessments of pulmonary physiology, and completed a six-minute walk test (6MWT), the SGRQ, Short Form-36 (SF-36), and Baseline/Transition Dyspnoea Index
(BDI/TDI) at baseline, six months, and twelve months. For this analysis, we used data collected at baseline and six months. Subjects in BUILD-1 had very well-defined IPF according to international guidelines.1
Outcome Measures
SGRQ. The SGRQ is a COPD-specific, self-administered HRQL instrument that contains 50 items divided into three components: Symptoms (n = 8). Activity (n = 16), and Impacts (n = 26).9 Each item has an empirically derived weight, and scores ranging from 0 to 100 are calculated for each component, as well as a total score. Higher scores indicate greater impairment in HRQL.
SF-36. The SF-36 is a generic health status instrument that contains 36 items tapping eight domains that can be separated into two psychometrically-derived summary components—mental and physical. Domain and summary component scores range from 0 to 100; lower scores correspond to worse health status. For the summary components, we used scoring algorithms to generate linear T-score transformations that place scores on scales with means of 50 and standard deviations of 10.
patient’s breathlessness in each of these domains on a scale from 0 (severe) to 4 (no impairment), so total scores range from 0-12. Although we did not use it here, a companion scale, the
Transitional Dyspnea Index (TDI), asks respondents to rate how dyspnoea has changed over time for each BDI domain.
Forced vital capacity (FVC) and diffusing capacity of the lung for carbon monoxide (DLCO),
were measured as per American Thoracic Society (ATS) guidelines13,14 and expressed as
percentages of the gender, age, and height-adjusted predicted values (i.e., FVC%, DLCO%). The 6MWT was performed according to ATS guidelines,15 and total distance walked (6MWD) and dyspnea (assessed by using the simple Borg Dyspnea index) were recorded. The average length of time between physiological testing and completion of the self-report questionnaires was one day.
Study Phases and Statistical Analyses
Descriptive statistics were generated for baseline data.
observed score and the score expected by the model for a particular item and persons. Item residuals between ±2.5 indicate adequate fit to the model. The Chi-square (X2) compares the
difference between the observed values with values expected by the model across different levels of health for each item. These groups are defined by ordering all patients responses and then splitting them into groups of approximately equivalent size across the sample (this is done automatically within RUMM2020). A non-significant item Chi-square (p>0.05) indicates good fit to the model. Item fit is also assessed graphically using the item characteristic curve (ICC). Items with the worst model fit were removed whilst ensuring that the balance of items and content validity for each component was retained. The overall fit of each component to the Rasch model was determined by examining the person item separation (PSI) which is analogous with Cronbach’s alpha, and item-trait interaction chi-square statistic (a non significant p value (>0.05) indicates fit to the model). Rasch analyses were run using RUMM2020 (www.rummlab.com)
Phase 2: Development of a new scoring scheme: Rasch analysis revealed that response options for some items needed to be collapsed. As published previously, for such items, weights from collapsed response categories were averaged to produce new weights.17 See online supplement for new weights. Linear regression was then used to create scoring algorithms to rescale
Phase 3: Cross-sectional and longitudinal validity: Correlations between scores from both the original and refined versions of the SGRQ (implementing the scoring as described in Phase 2) and other outcome measures were assessed using Pearson correlation coefficients. We
analyzed change in original or revised SGRQ component scores from baseline to six months by using a mixed-effects model (Proc Mixed procedure in SAS) for each component. Each model considered assessment number (baseline or six-month) as a categorical factor and used an unstructured variance-covariance matrix to model the covariance structure among the repeated measures by subject. All available data were included in the analyses. Besides the Rasch analyses, all statistics were run using SAS version 9.1.3 (SAS Institute, Inc., Cary, North Carolina)
Phase 4: SGRQ-I: The refined SGRQ is called the I. Because development of the SGRQ-I involved the removal of some items and collapsing response categories for other items, we also revised the wording and recall period of several items to make their content more practical.17 We examined internal consistency reliability (Cronbach’s alpha19) for each domain of the SGRQ-I, and for comparison purposes, for each domain of the original SGRQ.
Results
Baseline demographic and disease characteristics of the study sample are presented in Table 1.
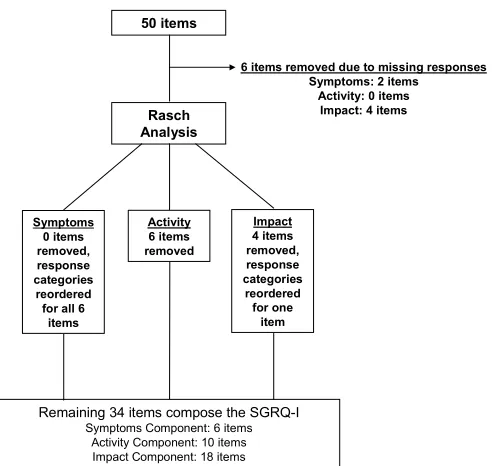
Phase 1 (See Figure 1)
response categories (details are provided in the online supplement). Following these changes the PSI was 0.63 (acceptable) and the item-trait interaction was x² = 10.4, p=0.58, indicating good fit to the Rasch model.
Activity Items: All 16 items were examined with Rasch analysis. The initial PSI was 0.88. Three items (1, 5, and 10) were removed due to a significant x², indicating lack of good-fit to the Rasch model. A further three items were removed because their location on the severity scale was high (item 1 = 6.14 logits, item 9 = 5.7 logits, and item 8 = 4.2 logits) (details in the online
supplement). After removal of these items the PSI 0.83, and the final set demonstrated good fit to the model (item-trait interaction x² = 26, p = 0.14).
Impact Items: Four items were initially deleted due to a high number of missing data: item 17 (45%), item 18 (44%), item 19 (44%), and item 20 (44%). The initial PSI for the remaining 22 items was 0.85. Items one and two displayed disordered thresholds. These were rectified by combining adjacent response options (details in online supplement). Three items (1, 13, and 22) demonstrated the worst fit (p<0.0001). These were removed. Item 22 demonstrated good fit to the model but it was removed to improve the overall targeting of this component (item logit = 4.6) (details in the online supplement). Following these adjustments, the component demonstrated good fit to the model (PSI = 0.83 and item-trait interaction x² = 50, p=0.06).
Phase 2
SGRQ-I Total score = 1.62 + (0.87 x SGRQ Total score), R2=0.97. The ICCCs showed excellent reliability: symptoms, 0.97; activities, 0.99; impacts, 0.98; and total, 0.99. Bland-Altman plots indicated excellent agreement between scores from the SGRQ and SGRQ-I for each component (Figure 2).
Phase 3
Table 2 shows correlations between SGRQ or SGRQ-I scores and measures of pulmonary physiology, dyspnoea, and health status. For any given outcome measure, correlations were similar between pairs that included SGRQ scores and the corresponding pair that included SGRQ-I scores. The weakest correlations were between SGRQ or SGRQ-I scores and measures of either pulmonary physiology or functional capacity, and among these, pairs that included Symptoms component scores (whether from the SGRQ or SGRQ-I) were weakest of all. Considering all outcomes in the study, the only two correlations that did not reach statistical significance were for SGRQ Symptoms and 6MWD and for SGRQ-I Symptoms and 6MWD. Correlations with dyspnoea and health status (assessed with the SF-36) were moderate-strong, and the strongest were between SGRQ or SGRQ-I Activity scores and SF-36 Physical
Functioning domain scores. Table 3 shows the similarity in change scores from components of the SGRQ or SGRQ-I from baseline to six months.
Phase 4
The SGRQ-I comprises 34 items, 6 in the Symptoms component, 10 in the Activity component, and 18 in the Impact component. Response categories for each item in the Symptoms
component on the SGRQ-I remains true/false. Response categories for one item in the Impact component were collapsed, such that this item on the SGRQ-I contains two response options compared with three for the original SGRQ. Internal consistency reliability for each component of the SGRQ vs. SGRQ-I were as follows: Symptoms 0.66 vs. 0.62; Activity 0.85 vs. 0.80; Impact 0.86 vs. 0.85.
Discussion
We conducted Rasch analyses on HRQL data from a recently completed, randomized, placebo-controlled trial to develop a new, IPF-specific version of the SGRQ called the SGRQ-I. We developed new item response categories for items with disordered response thresholds, new weights for the new response categories, and a scoring algorithm that places SGRQ-I scores on scale with the original SGRQ.
Rasch analysis has gained momentum as an advanced psychometric technique for the robust development of health related instruments20 and refinement of others17. An important feature of Rasch analysis is the ability to examine the hierarchical ordering of response options for polytomous items (i.e., items with Likert-type response options). We found that the response options for a number of items did not follow a logical order. This was resolved by combining response options and recalculating weights for such items. After incorporating these weights, a new scoring algorithm was developed to ensure that scores from the SGRQ-I are equivalent to scores from the original SGRQ. Our preliminary correlational analyses demonstrate that the new scoring system is accurate and reliable.
An advantage of Rasch analysis is the ability to gain information about how items are working, both individually and as a scale. Using Rasch methodology here enabled us to select items that generate the most precise measurement of HRQL (in domains tapped by the SGRQ) for patients with IPF. If data fit Rasch model expectations, then a fundamental assumption—that each item contributes reliably to the measurement of the single underlying construct—is met. There are no set rules as to whether mis-fitting items should be retained or removed, but like others,17 we based our decisions on a combination of item-fit statistics, including the PSI, and a requirement to maintain the internal consistency reliability and construct validity of the three components.
consistency reliability and the PSI, so we decided to retain those them. Second, it is likely that many subjects would have responded differently to certain items whose response category structures were modified for the SGRQ-I. Likert scales are often adopted for questionnaires without ever evaluating the ordering of responses. Disordered options violate the meaning implicit in the employed grading system (e.g., for the SGRQ, “Not at all” represents the least amount, “Most days a week” represents the most amount, and there are ordered levels of increasing amount between the two). Ignoring disordering yields invalid, unreliable HRQL response data. Thus, prospective studies will be needed to assess its responsiveness of the SGRQ-I and to determine the minimum change in scores over time that is clinically meaningful. Based on the rigorous statistics and thoughtful approach used here, we would expect the SGRQ-I to be better targeted to aspects of HRQL and even more responsive to underlying change than the original SGRQ in patients with IPF. Whether an instrument developed from the ground up specifically for patients with IPF will be even better targeted and more responsive to change is unknown.
In conclusion, we used a systematic, statistical-based method to revise the original SGRQ and develop an IPF-specific version called the SGRQ-I. Both reliability and validity of the SGRQ-I are acceptable and comparable to the original SGRQ. Prospective studies will determine whether the specificity of the SGRQ-I is more responsive to underlying change than the SGRQ in patients with IPF.
References
1. American Thoracic Society. Idiopathic pulmonary fibrosis: diagnosis and treatment. International consensus statement. American Thoracic Society (ATS), and the European Respiratory Society (ERS). Am J Respir Crit Care Med 2000; 161: 646-64.
2. Nishiyama O, Taniguchi H, Kondoh Y, et al. Health-related quality of life in patients with idiopathic pulmonary fibrosis. What is the main contributing factor? Respir Med 2005; 99: 408-414.
3. Swigris JJ, Kuschner WG, Jacobs SS, et al. Health-related quality of life in patients with idiopathic pulmonary fibrosis: a systematic review. Thorax 2005; 60: 588-94.
4. Nicholson AG, Colby TV, du Bois RM, et al. The prognostic significance of the histologic pattern of interstitial pneumonia in patients presenting with the clinical entity of cryptogenic fibrosing alveolitis. Am J Respir Crit Care Med 2000; 162: 2213-7.
5. Guyatt G, Feeny D, Patrick D. Measuring health-related quality of life. Ann Intern Med 1993; 118: 622-629.
6. King TE, Jr., Behr J, Brown KK, et al. BUILD-1: a randomized placebo-controlled trial of bosentan in idiopathic pulmonary fibrosis. Am J Respir Crit Care Med 2008; 177: 75-81. 7. Raghu G, Brown KK, Bradford WZ, et al. A placebo-controlled trial of interferon gamma-1b
in patients with idiopathic pulmonary fibrosis. N Engl J Med 2004; 350: 125-33.
8. Swigris JJ, Stewart AL, Gould MK, et al. Patients' perspectives on how idiopathic pulmonary fibrosis affects the quality of their lives. Health Qual Life Outcomes 2005; 3: 61.
9. Jones P, Quirk F, Baveystock C. The St. George's Respiratory Questionnaire. Respir Med 1991; 85: 25-31.
11. Swigris JJ, Brown KK, Behr J, et al. The SF-36 and SGRQ: validity and first look at minimum important differences in IPF. Respir Med; 104: 296-304.
12. Tzanakis N, Samiou M, Lambiri I, et al. Evaluation of health-related quality-of-life and dyspnea scales in patients with idiopathic pulmonary fibrosis. Correlation with pulmonary function tests. Eur J Intern Med 2005; 16: 105-112.
13. American Thoracic Society. Single-breath carbon monoxide diffusing capacity (transfer factor). Recommendations for a standard technique--1995 update. Am J Respir Crit Care Med 1995; 152: 2185-98.
14. Standardization of Spirometry, 1994 Update. American Thoracic Society. Am J Respir Crit Care Med 1995; 152: 1107-36.
15. ATS statement: Guidelines for the six-minute walk test. Am J Respir Crit Care Med 2002; 166: 111-117.
16. Rasch B. Probabilistic models for some intelligence and attainment tests. Copenhagen, Denmark. Danmarks Paedogogiske Institut 1960.
17. Meguro M, Barley EA, Spencer S, et al. Development and Validation of an Improved, COPD-Specific Version of the St. George Respiratory Questionnaire. Chest 2007; 132: 456-63.
18. Bland J, Altman D. Statistical methods for assessing agreement between two methods of clinical measurement. Lancet 1986; i: 307-310.
19. Cronbach L. Coefficient alpha and the internal structure of tests. Psychometrika 1951; 22: 293-296.
Table 1. Demographic and baseline disease characteristics of subjects in BUILD-1
Variable N=158
Age 65.12 (8.93)
BMI 29.18 (4.31)
Gender M/F 73/27
Smoking status (%)
Non/Current 98/2 Race (%)
Caucasian Black Asian Hispanic Other
92 2 1 4 1 Baseline FVC in Liters 2.64 (.73) Baseline FVC% 66.97 (12.17) Baseline DLCO% 40.98 (10.08) 6MWD in meters 373.3 (81.2)
BDI Total 6.8 (2.1)
Table 2. Correlations between either Original SGRQ or SGRQ-I scores and other outcome measures.
Symptoms Activity Impact Total
Original SGRQ-I Original SGRQ-I Original SGRQ-I Original SGRQ-I
FVC% -0.27* -0.25† -0.31† -0.30† -0.30† -0.31† -0.34† -0.33† DLCO% -0.23* -0.25† -0.34† -0.33† -0.38† -0.36† -0.38† -0.37† 6MWD -0.14 -0.12 -0.32† -0.30† -0.24* -0.26† -0.28* -0.28* Borg 0.35† 0.33† 0.45† 0.47†* 0.40† 0.40† 0.45† 0.46† BDI -0.39† -0.42† -0.72† -0.68† -0.61† -0.61† -0.68† -0.67† SF-36 PF RP BP GH VT SF RE MH PCS MCS -0.43† -0.40† -0.44† -0.47† -0.46† -0.37† -0.25† -0.27* -0.52† -0.25* -0.44† -0.38† -0.38† -0.44† -0.41† -0.38† -0.26† -0.24† -0.49† -0.24* -0.80† -0.58† -0.46† -0.60† -0.61† -0.58† -0.43† -0.32† -0.74† -0.38† -0.79† -0.59† -0.46† -0.59† -0.59† -0.56† -0.44† -0.33† -0.73† -0.38† -0.64† -0.58† -0.51† -0.64† -0.61† -0.62† -0.57† -0.45† -0.63† -0.55† -0.66† -0.55† -0.51† -0.62† -0.60† -0.62† -0.55† -0.46† -0.62† -0.55† -0.73† -0.62† -0.53† -0.67† -0.64† -0.62† -0.52† -0.42† -0.71† -0.49† -0.74† -0.60† -0.53† -0.65† -0.63† -0.63† -0.53† -0.43† -0.71† -0.50†
Table 3. Change scores over six months for original SGRQ and SGRQ-I
Original SGRQ P value SGRQ-I P value
Symptoms -4.75 (1.83) 0.01 -2.58 (1.36) 0.06
Activity 1.19 (1.27) 0.39 1.17 (1.34) 0.35
Impact -3.28 (1.38) 0.02 -2.56 (1.27) 0.04
Total -1.85 (1.17) 0.12 -1.64 (1.11) 0.14
Data reported as mean (standard error); SGRQ=Saint George’s Respiratory
50 items
Rasch Analysis
6 items removed due to missing responses
Symptoms: 2 items Activity: 0 items
Impact: 4 items
Symptoms 0 items removed, response categories reordered for all 6
items
Activity 6 items removed
Impact 4 items removed, response categories reordered for one
item
Remaining 34 items compose the SGRQ-I
[image:19.612.158.405.83.316.2]Symptoms Component: 6 items Activity Component: 10 items Impact Component: 18 items
SGRQ-I Sy mptoms minus Original SGRQ Sy mptoms Score -30 -25 -20 -15 -10 -5 0 5 10 15 20 25 30
0 5 10 15 20 25 30 35 40 45 50 55 60 65 70 75 80 85 90 95 100
Average: SGRQ and SGRQ-I Symptoms
D if fe re n c e : S G R Q m in u s S G R Q -I S y m p to m s
Average: SGRQ and SGRQ-I Activity
D if fe re n c e : S G R Q m in u s S G R Q -I A c ti v it y
SGRQ-I Activ ity minus Original SGRQ Activ ity Score
-30 -25 -20 -15 -10 -5 0 5 10 15 20 25 30
Average: SGRQ and SGRQ-I Impact D if fe re n c e : S G R Q m in u s S G R Q -I I m p a c t
SGRQ-I Impact minus Original SGRQ Impact Score
-30 -25 -20 -15 -10 -5 0 5 10 15 20 25 30
0 5 10 15 20 25 30 35 40 45 50 55 60 65 70 75 80 85 90 95 100
Average: SGRQ and SGRQ-I Total
D if fe re n c e : S G R Q m in u s S G R Q -I T o ta l
SGRQ-I Total minus Original SGRQ Total Score
-30 -25 -20 -15 -10 -5 0 5 10 15 20 25 30
[image:21.612.144.417.119.287.2]0 5 10 15 20 25 30 35 40 45 50 55 60 65 70 75 80 85 90 95 100