ci r c ul a ti n g a n d t u m o r-I nfilt r a ti n g
CD 4 + T C ell S u b s e t s in
C olo r e c t a l c a n c e r p a ti e n t s
Toor, S M , M u r s h e d , K, Al-D h a h e ri, M , Kh a w a r, M , Ab u N a d a , M
a n d El k o r d , E
h t t p :// dx. d oi.o r g / 1 0 . 3 3 8 9 /fi m m u . 2 0 1 9 . 0 2 9 3 6
T i t l e
I m m u n e c h e c k p oi n t s in ci r c u l a ti n g a n d t u m o r-I nfilt r a ti n g
CD 4 + T C ell S u b s e t s i n C olo r e c t al c a n c e r p a ti e n t s
A u t h o r s
Toor, S M , M u r s h e d , K, Al-D h a h e r i, M , Kh a w ar, M , Ab u
N a d a , M a n d El k o r d , E
Typ e
Ar ticl e
U RL
T hi s v e r si o n is a v ail a bl e a t :
h t t p :// u sir. s alfo r d . a c . u k /i d/ e p ri n t/ 5 6 0 9 8 /
P u b l i s h e d D a t e
2 0 1 9
U S IR is a d i gi t al c oll e c ti o n of t h e r e s e a r c h o u t p u t of t h e U n iv e r si ty of S alfo r d .
W h e r e c o p y ri g h t p e r m i t s , f ull t e x t m a t e r i al h el d i n t h e r e p o si t o r y is m a d e
f r e ely a v ail a bl e o nli n e a n d c a n b e r e a d , d o w nl o a d e d a n d c o pi e d fo r n o
n-c o m m e r n-ci al p r iv a t e s t u d y o r r e s e a r n-c h p u r p o s e s . Pl e a s e n-c h e n-c k t h e m a n u s n-c ri p t
fo r a n y f u r t h e r c o p y ri g h t r e s t r i c ti o n s .
Edited by:
Silvia Piconese, Sapienza University of Rome, Italy
Reviewed by:
Christopher E. Rudd, Université de Montréal, Canada Guillaume Darrasse-Jeze, Université Paris Descartes, France
*Correspondence:
Eyad Elkord eelkord@hbku.edu.qa; e.elkord@salford.ac.uk
Specialty section:
This article was submitted to T Cell Biology, a section of the journal Frontiers in Immunology
Received:20 July 2019
Accepted:29 November 2019
Published:17 December 2019
Citation:
Toor SM, Murshed K, Al-Dhaheri M, Khawar M, Abu Nada M and Elkord E (2019) Immune Checkpoints in Circulating and Tumor-Infiltrating CD4+T Cell Subsets in Colorectal
Cancer Patients. Front. Immunol. 10:2936. doi: 10.3389/fimmu.2019.02936
Immune Checkpoints in Circulating
and Tumor-Infiltrating CD4
+
T Cell
Subsets in Colorectal Cancer
Patients
Salman M. Toor1, Khaled Murshed2, Mahmood Al-Dhaheri3, Mahwish Khawar3,
Mohamed Abu Nada3and Eyad Elkord1,4*
1Cancer Research Center, Qatar Biomedical Research Institute (QBRI), Hamad Bin Khalifa University (HBKU), Qatar
Foundation (QF), Doha, Qatar,2Department of Pathology, Hamad Medical Corporation, Doha, Qatar,3Department of
Surgery, Hamad Medical Corporation, Doha, Qatar,4Biomedical Research Centre, School of Science, Engineering and
Environment, University of Salford, Salford, United Kingdom
Blockade of inhibitory immune checkpoints (ICs) is a promising therapeutic approach; however, it has shown limited success in some cancers including colorectal cancer (CRC). The tumor microenvironment (TME) is largely responsible for response to therapy, and its constituents may provide robust biomarkers for successful immunotherapeutic approaches. In this study, we performed phenotypical characterization and critical analyses of key inhibitory ICs and T regulatory cell (Treg)-related markers on CD4+ T
cell subsets in CRC patients, and compared with normal colon tissues and peripheral blood from the same patients. We also investigated correlations between the levels of different CD4+T cell subsets and the clinicopathologic features including disease stage
and tumor budding. We found a significant increase in the levels of CD4+FoxP3+Helios+
T cells, which represent potentially highly immunosuppressive Tregs, in the CRC TME. Additionally, tumor-infiltrating CD4+T cells upregulated programmed cell death protein-1
(PD-1), cytotoxic T-lymphocyte-associated protein-4 (CTLA-4), T cell immunoglobulin and mucin domain-3 (TIM-3) and lymphocyte-activation gene 3 (LAG-3). We also characterized the expression of PD-1, CTLA-4, TIM-3, and LAG-3 on different CD4+FoxP3−/+Helios−/+ T cell subsets. Interestingly, we found that CTLA-4, TIM-3,
and LAG-3 were mainly co-expressed on FoxP3+Helios+Tregs in the TME. Additionally,
FoxP3highTregs expressed higher levels of Helios, CTLA-4 and TIM-3 than FoxP3lowT cells. These results highlight the significance of Tregs in the CRC TME and suggest that Tregs may hamper response to IC blockade in CRC patients, but effects of different IC inhibition regimes on Treg levels or activity warrants further investigations. We also found that CD4+CTLA-4+T cells in circulation are increased in patients with advanced disease
stage. This study simultaneously provides important insights into the differential levels of CD4+T cell subpopulations and IC expression in CRC TME, compared to periphery and
associations with clinicopathologic features, which could be used as potential biomarkers for CRC progression and response to therapy.
INTRODUCTION
The tumor immune microenvironment (TIME) is largely accountable for response to immunotherapeutic modalities, and better analyses of its constituents can help develop robust biomarkers to identify patients who would respond to immunotherapy (1). In addition, DNA fragments or tumor cells budded off from the primary tumor sites may also be detected in “liquid biopsies” and used as potential biomarkers for initiation of effective anti-tumor therapies (2,3).
Colorectal cancer (CRC) is among the leading causes of cancer-related mortality and morbidity worldwide, affecting
∼1.4 million newly diagnosed patients and causing death in
0.7 million every year (4, 5). Current treatments for primary and metastatic CRC primarily include laparoscopic surgeries, radiotherapy, and neoadjuvant and palliative chemotherapies (6, 7). Immunotherapy regimes however have not had a big impact on treating CRC as in treating other malignancies. Nonetheless, pembrolizumab, an immune checkpoint (IC) inhibitor [anti-programmed cell death protein 1 (PD-1)], was recently granted Food and Drug Authority (FDA) approval for treating unresectable or metastatic solid tumors, including CRC, with microsatellite instability high (MSI-H) or DNA mismatch repair deficiency (dMMR) (8,9).
Inhibitory ICs attenuate T cell responses to mediate immune tolerance (10). These immune-inhibitory pathways are often employed by tumors to facilitate immune evasion. High Treg infiltration coupled with high IC expression in the tumor microenvironment (TME) should further promote tumor progression due to T cell exhaustion and impaired cytokine release. Several studies have reported accumulation of highly suppressive Treg populations and elevated IC expression in the colorectal TME (11–13). However, accumulation of Tregs in CRC patients can have opposing effects on prognosis also as it may be associated with favorable clinical outcomes (14,15).
In this study, we investigated the immune landscape of colorectal tumors, compared to normal colon tissues and peripheral blood from the same patients. We focused our investigations on CD4+ T cells and on the expression of key inhibitory ICs and regulatory T cell (Treg)-related markers. Tumor-specific T cells are a key component of the TME due to the presence of a multitude of suppressive mechanisms within the TME, which assist tumor immune evasion. Accumulation of Tregs within the TME leads to an immune-permissive microenvironment, favoring uncontrolled tumor growth (16,17). Potent anti-tumor immune responses require a shift in balance between levels of Tregs and T effector cells (Teff) in the TME (18). Therefore, T cell trafficking and localization into tumor sites and preferential proliferation and differentiation of tumor-reactive T cells can facilitate effective immunotherapies (19). Moreover, T cell inflamed tumors, characterized by existing anti-tumor T cell responses, are associated with improved clinical outcomes in CRC patients (11,20).
We found a significant increase in CD4+
T cells in the CRC TME, compared with adjacent normal tissue. Moreover, these CD4+ T cells comprised of potentially suppressive FoxP3high Treg populations, which co-expressed high levels
of Helios, previously reported as a marker for activated Tregs (21). Additionally, we found that intratumoral CD4+ T cells upregulate multiple inhibitory ICs including PD-1, cytotoxic T-lymphocyte-associated protein-4 (CTLA-4), T cell immunoglobulin and mucin domain-3 (TIM-3), and lymphocyte-activation gene 3 (LAG-3). We also compared the levels of different CD4+ T cell subsets between CRC patients presenting with early and advanced stage disease, and between patients who showed varying tumor budding status. We found that patients with advanced stage disease have increased CTLA-4 expression on CDCTLA-4+
T cells in circulation. Overall, this study increases our knowledge about the potential use of checkpoint blockade in CRC patients.
MATERIALS AND METHODS
Sample Collection and Storage
This study was performed under ethical approvals from Qatar Biomedical Research Institute, Doha, Qatar (Protocol no. 2018-018) and Hamad Medical Corporation, Doha, Qatar (Protocol no. MRC-02-18-012). All experiments were performed in accordance with relevant guidelines and regulations.
Peripheral blood samples were collected in EDTA tubes from 34 CRC patients, and tumor tissues (TT) and paired, adjacent non-cancerous normal colon tissues (NT) were obtained from 27 out of these 34 patients, who underwent surgery at Hamad Medical Corporation, Doha, Qatar. All patients included in the study were treatment-naïve prior to surgery and provided written informed consent prior to sample collection.Table 1shows the clinical and pathological characteristics of the study population.
[image:3.595.304.550.478.689.2]Peripheral blood mononuclear cells (PBMC) were isolated from fresh blood by density-gradient centrifugation using
TABLE 1 |Characteristic features of study populations.
CRC patients
Number 34 (27)†
Age (median) 62 (31-96)§
Gender (Male: Female) 24:10
TNM stage
I 6 (1)†
II 10 (10)†
III 15 (13)†
IV 3 (3)†
DNA mismatch repair deficiency (dMMR) 4 (3)†
Tumor budding
Low 13 (11)†
Intermediate 11 (7)†
High 10 (9)†
Histological grade
G2 Moderately differentiated All samples
CRC; Colorectal cancer.
§Median range.
†
Histopaque-1077 (Sigma-Aldrich, St. Louis, MO, USA). PBMC were frozen in freezing media (50% FBS, 40% RPMI 1640 media and 10% DMSO) at a density of 5 million cells per 1 ml in cryovials to be used in batches for subsequent analyses. Tissue specimens were also stored in freezing media for subsequent analyses.
Cell Isolation From Colorectal Tumors and
Normal Colon Tissues
Cells were isolated from NT and TT by mechanical disaggregation. Briefly, tissues frozen in freezing media were thawed and washed with phosphate-buffered saline (PBS) and then mechanically cut into small pieces (∼2–4 mm) using a surgical scalpel. Tissue disaggregation was performed on a gentleMACS dissociator (Miltenyi Biotech, Bergisch Gladbach, Germany) without using enzymes. The cell suspension was then passed through a 100µM cell strainer to remove aggregates and debris. The single cell suspension was washed with PBS and stained for flow cytometric analyses.
Multi-Parametric Flow Cytometry
PBMC and cells isolated from tissues were washed with PBS and re-suspended in 100 µl flow cytometry staining buffer (PBS with 1% FCS and 0.1% sodium azide). Fc receptors (FcR) were first blocked using FcR Blocker (Miltenyi Biotec). Fixable Viability Dye eFluor 780 (eBioscience, San Diego, USA) was added to gate live cells. Cells were then stained with cell surface antibodies including CD3-Alexa Fluor 700 (clone UCHT-1; BD Biosciences, Oxford, UK), CD4-phycoerythrin (clone RPA-T4; BD Biosciences), CD25-Brilliant Violet 650 (clone BC96; BioLegend, San Diego, USA), PD-1-PE/DazzleTM 594 (clone
EH12.2H7; BioLegend), LAG-3-Brilliant violet 421 (clone T47-530; BD Biosciences) and TIM-3-Brilliant Violet 711 (clone 7D3; BD Biosciences) and incubated at 4◦
C for 30 min. Cells were then washed twice with flow cytometry staining buffer. For intracellular staining, cells were incubated at 4◦
C for 45 min in fixation/permeabilization buffer (eBioscience). Cells were then washed twice with permeabilization wash buffer (eBioscience). Mouse serum (Sigma-Aldrich) and rat serum (Sigma-Aldrich) were added to block non-specific binding sites for 10 min at 4◦
C. Intracellular antibodies including CTLA-4-PerCP-eFluor 710 (clone 14D3; eBioscience), FoxP3-phycoerythrin cyanin 7 (PE/Cy7) (clone PCH101; eBioscience) and Helios-Fluorescein Isothiocyanate (FITC) (clone 22F6; BioLegend) were then added and cells incubated for another 30 min at 4◦
C. Cells were then washed twice with permeabilization wash buffer (eBioscience), and re-suspended in flow cytometry staining buffer.
All data were acquired on a BD LSRFortessa X-20 SORP flow cytometer using BD FACSDiva software (BD Biosciences) and analyzed on FlowJo V10 software (FlowJo, Ashland, USA).
Statistical Analyses
Statistical analyses were performed using GraphPad Prism 8 software (GraphPad Software, California, USA). One-way Anova test was performed to check for statistical significance in
grouped analyses. Pairedt-tests were performed within groups on samples that passed the Shapiro-Wilk normality test, while Wilcoxon matched-pairs signed rank tests were performed on samples that did not show normal distribution. Unpairedt-tests were performed for comparisons between groups on normally distributed data and Mann-Whitney tests for samples that did not show normal distribution. AP>0.05 was considered statistically non-significant. TheP-values are represented as follows;∗∗∗
P<
0.001,∗∗
P < 0.01,∗
P <0.05. Data are presented as mean ±
standard error of the mean (SEM).
RESULTS
Increased Levels of CD4
+T Cells in the
Tumor Microenvironment of Colorectal
Cancer Patients
Accumulation of tumor-infiltrating T cells in CRC patients has been previously reported, and shown to be associated with favored clinical outcomes (11). We investigated the levels of CD4+
T cells in circulation, normal colon tissues and in the TME of CRC patients. The overall levels of circulating CD4+ and CD4−
T cells in our cohort were similar (CD4+
; 31.4% vs. CD4−; 31.7%,Figure 1A). In agreement with previous reports, we found that CD4+ T cells accumulate in colorectal tumors, compared with normal tissues but were lower compared to their levels in circulation (PBMC; 31.4 ± 2.0 vs. NILs; 11.5
± 1.0 vs. TILs; 22.0 ± 2.1, Figure 1A). Levels of Teff cells within the TME can greatly affect cancer progression and response to therapy (18). Therefore, we focused our subsequent investigations to perform further phenotypical characterization of CD4+
T cell subsets to ascertain their role in colorectal tumor biology.
Tumor-Infiltrating CD4
+T Cells in CRC
Patients Comprise Mainly of Potentially
Suppressive T Regulatory Cells
Tregs constitute an important subset of CD4+
T cells, which are characterized by high expression of interleukin-2 receptor alpha chain (CD25) and forkhead box P3 (FoxP3) transcription factor (22). Moreover, Helios is a key transcription factor, which regulates FoxP3+
Treg functional stability and it is required for their inhibitory activity (23). Infiltration of FoxP3+
Tregs is often associated with poor prognosis and disease progression (24). We found that the levels of CD4+CD25+, CD4+FoxP3+ and CD4+
Helios+
T cells were significantly higher in the TME, compared with NT and circulation (CD25: PBMC; 5.0
± 0.6 vs. NILs; 2.6 ± 0.4 vs. TILs; 13.0 ± 1.8, FoxP3: 6.5
± 0.7 vs. 9.8 ± 0.8 vs. 26.8 ± 2.8 & Helios: 9.1 ± 0.8 vs. 11.8 ± 1.0 vs. 23.1 ± 2.5, Figures 1B–D). We also found that Tregs in CRC TME comprise mainly of FoxP3+Helios+ Tregs, which were significantly higher in the TME compared with normal tissue and periphery (5.7± 0.6 vs. 6.6± 0.5 vs. 20.5±2.3,Figure 1E).
FoxP3high Tregs have been previously identified as
FIGURE 1 |Levels of circulating and tumor-infiltrating CD4+T cells in colorectal cancer patients and expression levels of T regulatory cell-related markers. PBMC from 34 colorectal cancer (CRC) patients and immune cells isolated from colorectal tumor tissues (TILs) and paired, adjacent non-tumor normal colon tissues (NILs) from 27 patients were stained for CD4+T cell markers and Treg-related markers including CD25, FoxP3, and Helios. Representative flow cytometric plots and scatter plots show the levels of CD3+CD4+T cells in PBMC, NILs, and TILs from CRC patients(A). Representative flow cytometric and scatter plots show expression levels of CD25(B), FoxP3(C), and Helios(D)in CD4+T cells in PBMC, NILs, and TILs. Representative flow cytometric plots show FoxP3 and Helios co-expression and scatter plots show differences in levels of CD4+FoxP3−/+Helios−/+subsets in PBMC, NILs and TILs(E). ***P<0.001, **P<0.01, *P<0.05.
Helios expression within FoxP3high and FoxP3low populations
to ascertain the potential suppressive characteristics of the FoxP3+Helios+ subpopulation, accumulated in CRC tumors. We found that CD4+
FoxP3high Tregs express significantly higher levels of Helios than CD4+
FoxP3low cells in PBMC, NILs, and TILs (PBMC; 58.8 ± 2.6 vs. 88.1 ± 1.7, NILs; 41.4 ± 3.7 vs. 65.1 ± 3.9 & TILs; 58.0 ± 3.5 vs. 80.9 ± 2.3,
Figure 2). Next, we investigated differences in expression levels of different inhibitory ICs between FoxP3low and FoxP3high Tregs. Interestingly, we found that CTLA-4 and TIM-3 were also expressed at significantly higher levels on CD4+
FoxP3highTregs than CD4+
FoxP3lowT cells in PBMC, NILs, and TILs (CTLA-4:
PBMC; 15.1±2.7 vs. 36.7±3.6, NILs; 48.5±5.2 vs. 77.6±4.8,
TILs; 64.4±4.7 vs. 88.3±1.5 & TIM-3: PBMC; 0.6±0.1 vs. 1.0 ±0.3, NILs; 11.3±2.5 vs. 22.7±3.6, TILs; 21.6±3.7 vs. 38.2
± 4.7,Figure 2). However, PD-1 did not show any significant differences in expression levels between CD4+
FoxP3low/high
NILs and TILs, but it was significantly lower on CD4+
FoxP3high
T cells than CD4+FoxP3lowT cells in circulation (PBMC; 27.5±
2.5 vs. 19.1±2.4,Figure 2).
We also compared the mean fluorescence intensity (MFI) of the different markers between CD4+
FoxP3low
and CD4+
FoxP3high Tregs (Figure 2C). We found that the
differences in population frequencies were also reflected in differences in MFI. The MFI for Helios was significantly higher in CD4+
FoxP3highTregs than CD4+
FoxP3lowT cells in PBMC (1928±36.6 vs. 2253±52.1), NILs (2457±108.2 vs. 2656±
163.7) and TILs (2374±97.4 vs. 2759 ±156.9). CTLA-4 and TIM-3 also showed similar patterns (CTLA-4: PBMC; 2384±
64.5 vs. 2701±73.2, NILs; 2492±221.1 vs. 5197±365.8, TILs;
2922±188.5 vs. 5797±501.5 and TIM-3: PBMC; 621±19.5 vs.
771±44.5, NILs; 1546±84.9 vs. 1889±145.0, TILs; 1708±
69.6 vs. 2203±161.2), while PD-1 did not show any significant differences in MFI between CD4+
FoxP3lowand CD4+
FoxP3high
Tregs in PBMC, NILs and TILs (Figure 2C).
High Expression of Immune Checkpoints
on Intratumoral CD4
+T Cells
Immune checkpoints are expressed on activated or exhausted T cells (16). To find out the functional state of infiltrating T cells in the colorectal TME, we investigated IC expression on different CD4+
T cell subsets. We found that key inhibitory ICs, including PD-1, CTLA-4, TIM-3 and LAG-3 were highly expressed on CD4+
FIGURE 2 |Differences in Helios and immune checkpoint expression on CD4+FoxP3lowand CD4+FoxP3highPBMC, NILs, and TILs from CRC patients.
CD4+FoxP3lowand CD4+FoxP3highTregs were gated in PBMC, NILs, and TILs to investigate Helios, PD-1, CTLA-4, and TIM-3 expressions. Representative flow
cytometric plots show gating strategy for defining CD4+FoxP3low/highTregs and the expression levels of Helios, PD-1, CTLA-4, and TIM-3, in TILs isolated from CRC
patients(A). Scatter plots show differences in expression level(B)and Mean Fluorescence Intensity (MFI)(C)of Helios, PD-1, CTLA-4, and TIM-3 between CD4+FoxP3lowand CD4+FoxP3highPBMC, NILs, and TILs from CRC patients. ***P<0.001, **P<0.01.
ICs were expressed at significantly lower levels in periphery compared to normal colon tissue and showed elevated expression levels in the TME (PD-1: PBMC; 14.9 ± 1.1 vs. NILs; 48.1 ± 4.8 vs. TILs; 57.8 ± 5.7, CTLA-4: 4.8 ± 0.8 vs. 22.7 ± 2.4 vs. 45.9 ± 5.7, TIM-3: 0.5 ± 0.1 vs. 7.5 ± 1.0 vs. 23.2 ± 3.2 & LAG-3: 0.4 ± 0.1 vs. 1.8 ± 0.4 vs. 2.7 ±
0.5, Figure 3). Moreover, it is noteworthy that the overall expression levels of PD-1 were highest in tissues and in periphery, followed by CTLA-4 and TIM-3, while LAG-3 showed lowest overall expression on CD4+
T cells compared to other ICs (Figure 3).
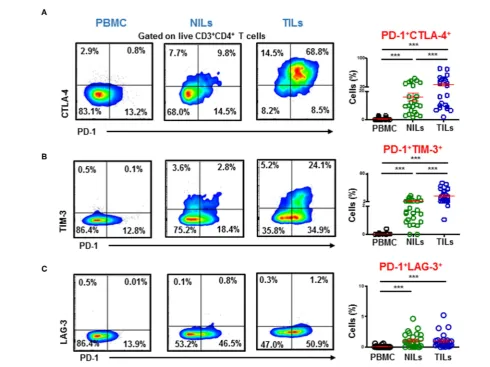
We also investigated co-expression of PD-1 with other ICs in PBMC, NILs, and TILs. We found that PD-1 was mainly co-expressed with CTLA-4 and TIM-3 in CD4+ TILs
(Figures 4A,B). In contrast, although CD4+ PD-1+
LAG-3+ T cells were significantly higher in NILs and in TILs compared to PBMC, the majority of CD4+PD-1+ T cells do not co-express LAG-3 (Figure 4C).
CTLA-4, TIM-3, and LAG-3 Are Mainly
Expressed on FoxP3
+Helios
+Tregs in the
Tumor Microenvironment
FIGURE 3 |Immune checkpoint expression on CD4+T cells in PBMC, NILs, and TILs from CRC patients. PBMC, NILs, and TILs were stained for CD3, CD4, and key immune checkpoints. Representative flow cytometric plots and scatter plots show differences in expression levels of PD-1(A), CTLA-4(B), TIM-3(C), and LAG-3(D) on CD4+T cells in PBMC, NILs, and TILs. ***P<0.001.
identify which Treg subpopulations upregulate inhibitory ICs in the colorectal TME based on FoxP3 and Helios expression. We found that key inhibitory ICs are differentially upregulated on various intratumoral Treg subsets, compared to CD4+
FoxP3− Helios−
non-Tregs (Figures 5A–D). In TILs, PD-1 was mainly expressed on CD4+FoxP3−Helios+ (60.3±
4.5) and CD4+FoxP3+Helios−Tregs (59.7±5.5), compared to
CD4+ FoxP3+
Helios+
(49.5± 6.1) and CD4+ FoxP3−
Helios− (50.6 ± 5.5) (Figure 5A). CTLA-4 and LAG-3 were mainly expressed on both CD4+
FoxP3+ Helios+
(CTLA-4; 78.5 ±
3.8 & LAG-3; 6.8 ± 0.9) and CD4+ FoxP3+
Helios− Tregs (CTLA-4; 72.8 ± 4.1 & LAG-3; 6.2 ± 0.8), compared to
CD4+ FoxP3−
Helios+
TILs (CTLA-4; 48.7±5.6 & LAG-3; 4.4 ±0.9) and CD4+
FoxP3− Helios−
TILs (CTLA-4; 21.8±3.5 & LAG-3; 0.5 ± 0.1) (Figures 5B,D). While, TIM-3 was mainly expressed on CD4+
FoxP3+ Helios+
TILs (44.5±4.6), compared to CD4+FoxP3−Helios+ (22.8 ± 3.4), CD4+FoxP3+Helios−
TILs (25.9± 3.4) and CD4+ FoxP3−
Helios−
TILs (5.9 ±1.8)
(Figure 5C).
Notably, inhibitory ICs showed different expression patterns on CD4+
FoxP3−/+
Helios−/+
in periphery. PD-1 was mainly expressed on CD4+
FoxP3+ Helios−
Tregs in circulation (19.5
± 2.0), followed by CD4+FoxP3−Helios+ T cells (14.0 ±
1.1) and CD4+FoxP3−Helios− T cells (11.3 ± 1.0), while
CD4+ FoxP3+
Helios+
Tregs showed lowest PD-1 expression (7.4 ± 0.8) (Figure 5E). CTLA-4 was mainly expressed on CD4+
FoxP3+ Helios−
(33.8 ± 3.5) and CD4+ FoxP3+
Helios+ Tregs (30.0 ± 2.7), compared to CD4+
FoxP3− Helios+ (10.7 ± 1.6) and CD4+FoxP3−Helios− T cells (1.9 ± 0.3).
TIM-3 was mainly expressed on FoxP3 and/or Helios-expressing T cells, compared to CD4+
FoxP3− Helios−
T cells (0.2 ± 0.1) in circulation (Figure 5E). In addition, no significant differences were detected in TIM-3 expression on CD4+
FoxP3− Helios+
(1.1 ± 0.2), CD4+ FoxP3+
Helios+ (1.4 ± 0.4) and CD4+FoxP3+Helios− (1.6 ± 0.4) T cells
in circulation (Figure 5E). In normal colon tissues, PD-1 expression did not show any significant differences in CD4+
FoxP3− Helios+
(36.4 ± 5.0), CD4+ FoxP3+
Helios+ (30.2 ± 5.0), CD4+
FoxP3+ Helios−
(33.8 ± 6.4) and CD4+FoxP3−Helios− (33.3± 3.8) NILs (Figure 5F). CTLA-4 was also mainly expressed on CD4+
FoxP3+ Helios−
(43.9 ±
7.0) and CD4+ FoxP3+
Helios+
NILs (37.9±6.1), compared to CD4+
FoxP3− Helios+
(20.5 ± 4.8) and CD4+ FoxP3−
Helios− NILs (11.1 ± 1.9). In contrast, TIM-3 was mainly expressed on CD4+
FoxP3+ Helios+
FIGURE 4 |Immune checkpoints co-expression on CD4+T cells. PBMC, NILs, and TILs isolated from CRC patients were stained for CD3, CD4, and immune checkpoints. Representative flow cytometric and scatter plots show differences in co-expression levels of PD-1−/+CTLA-4−/+(A), PD-1−/+TIM-3−/+(B), and PD-1−/+LAG-3−/+(C)on CD4+T cells in PBMC, NILs, and TILs. ***P<0.001.
(2.1 ± 0.7) NILs, while CD4+ FoxP3−
Helios−
NILs showed minimal TIM-3 expression (1.0 ± 0.2) (Figure 5F). Of note, there were no conclusive results to identify the CD4+
FoxP3+/−
Helios+/−
subset with highest LAG-3 expression due to weak overall LAG-3 expression in periphery (data not shown).
Visualization of overall CD4+
T cell infiltrates in CRC tumors and periphery is depicted in Figure 6. We generated t-Distributed Stochastic Neighbor Embedding (tSNE) plots from various Treg-related markers and inhibitory ICs in PBMC, NILs, and TILs from CRC patients. We confirmed that FoxP3, Helios, PD-1, TIM-3, and CTLA-4 expression levels are increased in CD4+
TILs, while CD4+
T cells showed lower Treg-related markers and IC expression in PBMC and NILs (Figure 6A). In addition, CD4+
TILs co-expressed multiple ICs compared to PBMC and NILs (Figure 6B). Helios, PD-1 and TIM-3 were also expressed on CD4−T cells and showed elevated expression on CD4−
TILs (Figure 6B).
Patients With Advanced Stage Disease
Have Higher Levels of CD4
+CTLA-4
+T
Cells in Circulation
We compared the levels of CD4+
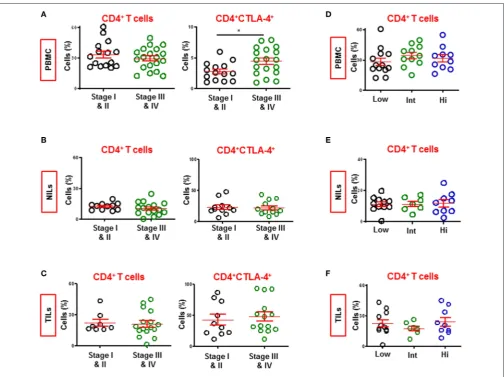
T cell subsets in circulation, NILs and TILs between CRC patients presenting with early and advanced pathologic stages (Figures 7A–C). We combined patients with stages I and II (PBMC; n = 15, NILs/TILs; n = 11) and compared with those with stages III and IV
advanced stage (PBMC; n = 19, NILs/TILs; n = 16). We
found that the levels of circulating CD4+ T cells were similar between patients with early or advanced stages. Intestinally, there was a significant increase in levels of CD4+
CTL-4+ T cells only in circulation of patients with advanced stage (4.0
± 1.3 vs. 5.4 ± 1.1, Figure 7A). The constitutive expression of CTLA-4 on CD4+ Tregs suggests correlation of elevated levels of CTLA-4+ Tregs with CRC disease progression. However, other T cell subsets, including CD4+
FIGURE 5 |Immune checkpoint expression on FoxP3 and Helios subsets in CD4+TILs, PBMC, and NILs. TILs isolated from CRC patients were stained for CD3, CD4, immune checkpoints and FoxP3 and Helios. Representative flow cytometric plots and scatter plots show differences in expression levels of PD-1(A), CTLA-4 (B), TIM-3(C), and LAG-3(D)in CD4+FoxP3−/+Helios−/+TILs subsets. Scatter plots show differences in expression levels of PD-1, CTLA-4, and TIM-3 in CD4+FoxP3−/+Helios−/+PBMC(E)and NILs(F)from CRC patients. ***P<0.001, **P<0.01, *P<0.05.
did not show any correlation with disease progression (data not shown).
Levels of CD4
+T Cells Are Similar in
Patients Exhibiting Varying Tumor Budding
Status
Tumor budding in CRC has been associated with poor disease outcomes in various studies (28). We divided our cohort into three groups based on tumor budding data; low (PBMC;n=13, NILs/TILs;n=11), intermediate (PBMC;n=11, NILs/TILs;
n = 7) and high (PBMC; n = 10, NILs/TILs; n = 9), and
compared levels of various T cell subsets in circulation, NILs and TILs between them. We did not find any significant differences between CD4+
T cell subsets in circulation, NILs or TILs (Figures 7D–F). Moreover, there were no significant differences in the levels of other CD4+
T cell subsets, including TIM-3-expressing CD4+T cells, between patients with different tumor budding status (data not shown).
DISCUSSION
Studies have reported correlations between increased T cell infiltration of various tumors and improved responses to therapies and favorable disease outcomes (29). Interferon-γ-secreting cytotoxic T cells, T-helper 1 (Th1) cells, natural killer cells and macrophages polarized to an M1 phenotype and DC1 dendritic cells are largely associated with favorable anti-tumor immune responses (30–32). While, Th2 cells, M2 macrophages, DC2 dendritic cells, myeloid derived suppressor cells (MDSC) and IL-10 and TGFβreleasing FoxP3+
Tregs are associated with immunosuppression (33,34).
In CRC patients, high infiltration of CD3+
T cells, Th1 cells and cytotoxic T cells in the tumor center and invasive margins correlated with improved overall survivals and disease-free survivals, while lower T cell density was associated with poor prognosis (35, 36). In addition, high CD8+
FIGURE 6 |Visualizing expression of Treg-related markers and immune checkpoint expression in PBMC, NILs, and TILs from CRC patients. Flow cytometric data from PBMC, NILs, and TILs were merged to create single t-Distributed Stochastic Neighbor Embedding (tSNE) maps. Cells (dots) are plotted according to expression of CD4, CD25, FoxP3, Helios, PD-1, TIM-3, CTLA-4, and LAG-3 in PBMC, NILs, and TILs from CRC patients(A). tSNE maps show combined co-expression of the different Treg-related markers and immune checkpoints on CD4+and CD4−T cells in PBMC, NILs and TILs from CRC patients(B).
and CD8+ T cells in colorectal TME were shown to correlate with improved response to chemo-radiotherapy (38). Moreover, the presence of effector memory T cells within CRC tumors, defined by the presence of CD3, CD8, CD45RO, CCR7, CD28, and CD27 expression, was associated with absence of signs of early metastatic invasion (39). Therefore, evidence of an active immune response in the CRC TME was shown to be associated with prolonged survival (39).
We found that CD4+
T cells were significantly higher in colorectal tumors, compared with normal colon tissues. CD4+ T cells in circulation comprise mainly of naïve T cells, while in tissues comprise mainly of memory T cells. Galon et al. proposed that the immune landscape of CRC tumors can be considered as a robust predictor of patient survival and it may be used for histopahlogical classification of CRC tumors; they found that patients with high immune cell densities within the tumor and at invasive margins did not show recurrence (40). Importantly, transcriptomic profiling of immune subsets found in CRC tumors confirmed that immune cell infiltrates can affect disease outcomes as patients with prolonged disease-free survivals had distinct expression of genes related to cytotoxic T cells, T helper molecules and chemokine-related genes
than patients with adverse disease outcomes (35). Therefore, comprehensive investigations are required to ascertain the role of immune cells in the TME and their effects on clinical outcomes of CRC patients. We reported high levels of different ICs and Treg-related markers in CRC TME, which would suggest their potential roles in carcinogenesis. Mechanisms of expansion/proliferation or trafficking of these CD4+ T cell subsets into tumor sites warrants further investigations.
Pre-existing Tregs in the TME expand upon antigen-specific activation in the presence of TGF-β and IL-10, which are found at high levels within the TME (41,42). We found that CD4+CD25+FoxP3+ Tregs accumulate in colorectal tumors at significantly higher levels, compared to periphery and adjacent colon normal tissues. Moreover, these Tregs expressed high levels of Helios, indicative of highly suppressive and stable Treg function (43). Studies have shown that FoxP3+
Helios+ Tregs have enhanced immunosuppressive characteristics, compared with FoxP3+Helios−Tregs (44–46).
FIGURE 7 |Levels of CD4+and CD4+CTLA-4+T cells in CRC patients with different staging and tumor budding. Patients were divided into two groups based on pathologic staging; early stage (Stage I and II) and advanced stage (Stage III and IV). Scatter plots show differences in levels of CD4+and CD4+CTLA-4+T cells in PBMC(A), NILs(B), and TILs(C)between CRC patients with early and advanced stages. Patients were also divided into three groups based on degree of tumor budding; low, intermediate and high. Scatter plots show differences in levels of CD4+T cells in PBMC(D), NILs(E), and TILs(F)between CRC patients. *P<0.05.
could be attributed to different subsets of tumor-infiltrating FoxP3+
Tregs, which include FoxP3high and FoxP3low Tregs; the former representing stable FoxP3 expression, while FoxP3low non-suppressive Tregs secrete inflammatory cytokines and henceforth may be associated with improved clinical outcomes in CRC (14). In addition, it has been shown that tumor-infiltrating FoxP3highCD45RA− effector Tregs, which express PD-1, are highly activated, express high levels of CTLA-4 and are associated with hyper progressive disease in patients with advanced gastric cancer (52). Based on these findings, we investigated differences in Helios and other IC expression between FoxP3low and
FoxP3highPBMC, NILs, and TILs. We found that FoxP3highTregs express Helios at significantly higher levels than FoxP3lowT cells in the TME and in periphery of CRC patients, strengthening that Helios is a vital marker for suppressive Tregs in CRC. Additionally, FoxP3highTregs also showed significantly higher IC
expression in the TME, indicating their highly activated states.
CTLA-4 is constitutively expressed on Tregs and modulates their functionality (57). Additionally, Tregs in the TME upregulate other multiple ICs including PD-1, LAG-3, TIM-3, and TIGIT (58); FoxP3+
Tregs expressing TIM-3/LAG-3 and PD-1 were shown to be highly suppressive (25, 59). TIM-3 expression on Tregs has been previously reported to show higher ability to suppress Th17 cells than TIM-3− Tregs, while both can effectively suppress Th1 proliferation (60). We found that in the CRC TME, TIM-3 is mainly expressed on FoxP3+
Helios+ Tregs, hence more potent suppressors of Th17 responses. In addition, we showed that PD-1, TIM-3, CTLA-4, and LAG-3 were mainly expressed on CD4+FoxP3+ Tregs in the TME, further reinforcing the suppressive role of these cells in the TME. tSNE representation, which enables visualization of high-dimensional data on a single bivariate plot, also confirmed the accumulation of Tregs and elevated IC expression on CD4+
T cells in the TME. Moreover, high IC expression corresponded with Treg populations in TILs.
Tumor budding is associated with vascular invasion and prognosis in colorectal cancer (61, 62). This study cohort consisted of CRC displaying different tumor budding characteristics, ranging from low to high. However, we did not find any differences in the levels of CD4+ T cells in periphery or TME across all patients with varying tumor budding status; thereby suggesting CD4+
T cells are not associated with tumor budding in CRC.
Following the accomplishments of PD-1 and CTLA-4 blockade, TIM-3 and LAG-3 are currently being explored in various pre-clinical and clinical trials to promote effective anti-tumor immunity for clinical benefits (63). This study provides comprehensive and simultaneous comparisons of expression levels of different ICs on CD4+
T cells, including Tregs, in the TME and periphery of CRC patients. IC inhibitors significantly improved survival in patients with MSI-H metastatic CRC. However, a significant proportion of patients show minimal response and do not benefit from ICIs (64). Additionally, the percentage of CRC patients who exhibit MSI-H/dMMR is generally low, around 12–15% of all cases (65), like in this study cohort (Table 1). Equating immune profiles of these patients with those who do not show microsatellite instability to find differences would therefore require a much larger patient pool. Moreover, the long-term prognosis of patients with advanced stage CRC remains poor despite efforts to develop novel chemotherapeutic and targeted therapy regimens. Predictive biomarkers for successful
IC inhibition with clinical benefits are a necessity in such instances. Expression of ICs and their ligands in the TME have been proposed as such predictive biomarkers (66), and better understanding of the immune components can therefore assist in identifying robust biomarkers for response to therapy and also assist in targeted-therapies, tailor made on individual patient basis.
DATA AVAILABILITY STATEMENT
The raw data supporting the conclusions of this manuscript will be made available by the authors, without undue reservation, to any qualified researcher.
ETHICS STATEMENT
The studies involving human participants were reviewed and approved by Qatar Biomedical Research Institute, Doha, Qatar (Protocol no. 2018-018) and Hamad Medical Corporation, Doha, Qatar (Protocol no. MRC-02-18-012). The patients/participants provided their written informed consent to participate in this study.
AUTHOR CONTRIBUTIONS
ST performed experimental work, data analysis, and wrote the manuscript. KM assisted with data acquisition and analysis. KM, MA-D, and MK contributed to sample collection, acquisition of patients’ clinical data, and revising the manuscript. MA assisted in designing the study, contributed to sample collection, and revised the manuscript. EE conceived the idea, designed the study, obtained fund, analyzed and interpreted data, and wrote and revised the manuscript. All authors were involved in the final approval of the manuscript.
FUNDING
This work was supported by a start-up grant [VR04] for EE from Qatar Biomedical Research Institute, Qatar Foundation.
ACKNOWLEDGMENTS
We are grateful to Ms. Eleonor Dela Cruz Belita from Hamad Medical Corporation for assisting in collecting patient samples, and all patients for donating their samples.
REFERENCES
1. Binnewies M, Roberts EW, Kersten K, Chan V, Fearon DF, Merad M, et al. Understanding the tumor immune microenvironment (TIME) for effective therapy. Nat Med.(2018) 24:541–50. doi: 10.1038/s41591-018-0014-x 2. Augestad KM, Merok MA, Ignatovic D. Tailored treatment of colorectal
cancer: surgical, molecular, and genetic considerations. Clin Med Insights Oncol.(2017) 11:1179554917690766. doi: 10.1177/1179554917690766 3. Marrugo-Ramirez J, Mir M, Samitier J. Blood-based cancer biomarkers in
liquid biopsy: a promising non-invasive alternative to tissue biopsy. Int J Mol Sci.(2018) 19:2877. doi: 10.3390/ijms19102877
4. Ferlay J, Soerjomataram I, Dikshit R, Eser S, Mathers C, Rebelo M, et al. Cancer incidence and mortality worldwide: sources, methods and major patterns in GLOBOCAN 2012. Int J Cancer. (2015) 136:E359– 86. doi: 10.1002/ijc.29210
5. Favoriti P, Carbone G, Greco M, Pirozzi F, Pirozzi RE, Corcione F. Worldwide burden of colorectal cancer: a review. Updates Surg.(2016) 68:7– 11. doi: 10.1007/s13304-016-0359-y
7. Kuipers EJ, Grady WM, Lieberman D, Seufferlein T, Sung JJ, Boelens PG, et al. Colorectal cancer. Nat Rev Dis Primers. (2015) 1:15065. doi: 10.1038/nrdp.2015.65
8. Kalyan A, Kircher S, Shah H, Mulcahy M, Benson A. Updates on immunotherapy for colorectal cancer. J Gastrointest Oncol.(2018) 9:160– 9. doi: 10.21037/jgo.2018.01.17
9. Le DT, Kavan P, Kim TW, Burge ME, Van Cutsem E, Hara H, et al. KEYNOTE-164: pembrolizumab for patients with advanced microsatellite instability high (MSI-H) colorectal cancer. J Clin Oncol.(2018) 36(Suppl. 15):3514. doi: 10.1200/JCO.2018.36.15_suppl.3514
10. Pardoll DM. The blockade of immune checkpoints in cancer immunotherapy. Nat Rev Cancer.(2012) 12:252–64. doi: 10.1038/nrc3239
11. Nosho K, Baba Y, Tanaka N, Shima K, Hayashi M, Meyerhardt JA, et al. Tumour-infiltrating T-cell subsets, molecular changes in colorectal cancer, and prognosis: cohort study and literature review. J Pathol.(2010) 222:350– 66. doi: 10.1002/path.2774
12. Syed Khaja AS, Toor SM, El Salhat H, Ali BR, Elkord E. Intratumoral FoxP3(+)Helios(+) regulatory T cells upregulating immunosuppressive molecules are expanded in human colorectal cancer. Front Immunol.(2017) 8:619. doi: 10.3389/fimmu.2017.00619
13. Zhang X, Kelaria S, Kerstetter J, Wang J. The functional and prognostic implications of regulatory T cells in colorectal carcinoma. J Gastrointest Oncol.
(2015) 6:307–13. doi: 10.3978/j.issn.2078-6891.2015.017
14. Saito T, Nishikawa H, Wada H, Nagano Y, Sugiyama D, Atarashi K, et al. Two FOXP3(+)CD4(+) T cell subpopulations distinctly control the prognosis of colorectal cancers. Nat Med.(2016) 22:679–84. doi: 10.1038/nm.4086 15. Hu G, Li Z, Wang S. Tumor-infiltrating FoxP3(+) Tregs predict favorable
outcome in colorectal cancer patients: a meta-analysis. Oncotarget.(2017) 8:75361–71. doi: 10.18632/oncotarget.17722
16. Chaudhary B, Elkord E. Regulatory T cells in the tumor microenvironment and cancer progression: role and therapeutic targeting. Vaccines. (2016) 4:E28. doi: 10.3390/vaccines4030028
17. Nishikawa H, Sakaguchi S. Regulatory T cells in tumor immunity. Int J Cancer.
(2010) 127:759–67. doi: 10.1002/ijc.25429
18. Sasidharan Nair V, Elkord E. Immune checkpoint inhibitors in cancer therapy: a focus on T-regulatory cells. Immunol Cell Biol. (2018) 96:21– 33. doi: 10.1111/imcb.1003
19. Nolz JC. Molecular mechanisms of CD8(+) T cell trafficking and localization.
Cell Mol Life Sci.(2015) 72:2461–73. doi: 10.1007/s00018-015-1835-0 20. Trujillo JA, Sweis RF, Bao R, Luke JJ. T Cell-inflamed versus non-T
cell-inflamed tumors: a conceptual framework for cancer immunotherapy drug development and combination therapy selection. Cancer Immunol Res.(2018) 6:990–1000. doi: 10.1158/2326-6066.CIR-18-0277
21. Elkord E, Abd Al Samid M, Chaudhary B. Helios, and not FoxP3, is the marker of activated Tregs expressing GARP/LAP. Oncotarget.(2015) 6:20026– 36. doi: 10.18632/oncotarget.4771
22. Plitas G, Rudensky AY. Regulatory T cells: differentiation and function. Cancer Immunol Res.(2016) 4:721–5. doi: 10.1158/2326-6066.CIR-16-0193 23. Elkord E. Helios should not be cited as a marker of human thymus-derived
tregs. commentary: Helios(+) and Helios(-) cells coexist within the natural FOXP3(+) T regulatory cell subset in humans. Front Immunol. (2016) 7:276. doi: 10.3389/fimmu.2016.00276
24. Tanaka A, Sakaguchi S. Regulatory T cells in cancer immunotherapy. Cell Res.
(2017) 27:109–18. doi: 10.1038/cr.2016.151
25. Camisaschi C, Casati C, Rini F, Perego M, De Filippo A, Triebel F, et al. LAG-3 expression defines a subset of CD4(+)CD25(high)Foxp3(+) regulatory T cells that are expanded at tumor sites. J Immunol. (2010) 184:6545– 51. doi: 10.4049/jimmunol.0903879
26. Jie HB, Gildener-Leapman N, Li J, Srivastava RM, Gibson SP, Whiteside TL, et al. Intratumoral regulatory T cells upregulate immunosuppressive molecules in head and neck cancer patients. Br J Cancer.(2013) 109:2629– 35. doi: 10.1038/bjc.2013.645
27. Rowshanravan B, Halliday N, Sansom DM. CTLA-4: a moving target in immunotherapy. Blood. (2018) 131:58– 67. doi: 10.1182/blood-2017-06-741033
28. Graham RP, Vierkant RA, Tillmans LS, Wang AH, Laird PW, Weisenberger DJ, et al. Tumor budding in colorectal carcinoma: confirmation of prognostic
significance and histologic cutoff in a population-based cohort. Am J Surg Pathol.(2015) 39:1340–6. doi: 10.1097/PAS.0000000000000504
29. Gooden MJ, de Bock GH, Leffers N, Daemen T, Nijman HW. The prognostic influence of tumour-infiltrating lymphocytes in cancer: a systematic review with meta-analysis. Br J Cancer.(2011) 105:93–103. doi: 10.1038/bjc.2011.189 30. Bhat P, Leggatt G, Waterhouse N, Frazer IH. Interferon-gamma derived from cytotoxic lymphocytes directly enhances their motility and cytotoxicity. Cell Death Dis.(2017) 8:e2836. doi: 10.1038/cddis.2017.67
31. Collin M, Bigley V. Human dendritic cell subsets: an update. Immunology.
(2018) 154:3–20. doi: 10.1111/imm.12888
32. Martinez FO, Gordon S. The M1 and M2 paradigm of macrophage activation: time for reassessment. F1000Prime Rep.(2014) 6:13. doi: 10.12703/P6-13 33. Bianchi G, Borgonovo G, Pistoia V, Raffaghello L. Immunosuppressive
cells and tumour microenvironment: focus on mesenchymal stem cells and myeloid derived suppressor cells. Histol Histopathol. (2011) 26:941– 51. doi: 10.14670/HH-26.941
34. Campoli M, Ferrone S, Zea AH, Rodriguez PC, Ochoa AC. Mechanisms of tumor evasion. Cancer Treat Res. (2005) 123:61– 88. doi: 10.1007/0-387-27545-2_3
35. Bindea G, Mlecnik B, Tosolini M, Kirilovsky A, Waldner M, Obenauf AC, et al. Spatiotemporal dynamics of intratumoral immune cells reveal the immune landscape in human cancer. Immunity. (2013) 39:782– 95. doi: 10.1016/j.immuni.2013.10.003
36. Mei Z, Liu Y, Liu C, Cui A, Liang Z, Wang G, et al. Tumour-infiltrating inflammation and prognosis in colorectal cancer: systematic review and meta-analysis. Br J Cancer.(2014) 110:1595–605. doi: 10.1038/bjc.2014.46 37. Berntsson J, Svensson MC, Leandersson K, Nodin B, Micke P, Larsson AH,
et al. The clinical impact of tumour-infiltrating lymphocytes in colorectal cancer differs by anatomical subsite: a cohort study. Int J Cancer.(2017) 141:1654–66. doi: 10.1002/ijc.30869
38. Yasuda K, Nirei T, Sunami E, Nagawa H, Kitayama J. Density of CD4(+) and CD8(+) T lymphocytes in biopsy samples can be a predictor of pathological response to chemoradiotherapy (CRT) for rectal cancer. Radiat Oncol.(2011) 6:49. doi: 10.1186/1748-717X-6-49
39. Pages F, Berger A, Camus M, Sanchez-Cabo F, Costes A, Molidor R, et al. Effector memory T cells, early metastasis, and survival in colorectal cancer. N Engl J Med.(2005) 353:2654–66. doi: 10.1056/NEJMoa051424
40. Galon J, Costes A, Sanchez-Cabo F, Kirilovsky A, Mlecnik B, Lagorce-Pages C, et al. Type, density, and location of immune cells within human colorectal tumors predict clinical outcome. Science.(2006) 313:1960– 4. doi: 10.1126/science.1129139
41. Ghiringhelli F, Puig PE, Roux S, Parcellier A, Schmitt E, Solary E, et al. Tumor cells convert immature myeloid dendritic cells into TGF-beta-secreting cells inducing CD4+CD25+regulatory T cell proliferation. J Exp Med.(2005) 202:919–29. doi: 10.1084/jem.20050463
42. Yamagiwa S, Gray JD, Hashimoto S, Horwitz DA. A role for TGF-beta in the generation and expansion of CD4+CD25+ regulatory T cells from human peripheral blood. J Immunol. (2001) 166:7282–9. doi: 10.4049/jimmunol.166.12.7282
43. Kim HJ, Barnitz RA, Kreslavsky T, Brown FD, Moffett H, Lemieux ME, et al. Stable inhibitory activity of regulatory T cells requires the transcription factor Helios. Science.(2015) 350:334–9. doi: 10.1126/science.aad0616
44. Akimova T, Beier UH, Wang L, Levine MH, Hancock WW. Helios expression is a marker of T cell activation and proliferation. PLoS ONE. (2011) 6:e24226. doi: 10.1371/journal.pone.0024226
45. Sebastian M, Lopez-Ocasio M, Metidji A, Rieder SA, Shevach EM, Thornton AM. Helios controls a limited subset of regulatory T cell functions. J Immunol.
(2016) 196:144–55. doi: 10.4049/jimmunol.1501704
46. Zabransky DJ, Nirschl CJ, Durham NM, Park BV, Ceccato CM, Bruno TC, et al. Phenotypic and functional properties of Helios+regulatory T cells. PLoS ONE.(2012) 7:e34547. doi: 10.1371/journal.pone.0034547
47. Yaqub S, Henjum K, Mahic M, Jahnsen FL, Aandahl EM, Bjornbeth BA, et al. Regulatory T cells in colorectal cancer patients suppress anti-tumor immune activity in a COX-2 dependent manner. Cancer Immunol Immunother.(2008) 57:813–21. doi: 10.1007/s00262-007-0417-x
colon cancer were associated with worse survival. Mol Cancer. (2014) 13:153. doi: 10.1186/1476-4598-13-153
49. Correale P, Rotundo MS, Del Vecchio MT, Remondo C, Migali C, Ginanneschi C, et al. Regulatory (FoxP3+) T-cell tumor infiltration is a favorable prognostic factor in advanced colon cancer patients undergoing chemo or chemoimmunotherapy. J Immunother.(2010) 33:435– 41. doi: 10.1097/CJI.0b013e3181d32f01
50. Salama P, Phillips M, Grieu F, Morris M, Zeps N, Joseph D, et al. Tumor-infiltrating FOXP3+ T regulatory cells show strong prognostic significance in colorectal cancer. J Clin Oncol. (2009) 27:186–92. doi: 10.1200/JCO.2008.18.7229
51. Fridman WH, Pages F, Sautes-Fridman C, Galon J. The immune contexture in human tumours: impact on clinical outcome. Nat Rev Cancer.(2012) 12:298–306. doi: 10.1038/nrc3245
52. Kamada T, Togashi Y, Tay C, Ha D, Sasaki A, Nakamura Y, et al. PD-1(+) regulatory T cells amplified by PD-1 blockade promote hyperprogression of cancer. Proc Natl Acad Sci USA. (2019) 116:9999–10008. doi: 10.1073/pnas.1822001116
53. Jiang Y, Li Y, Zhu B. T-cell exhaustion in the tumor microenvironment. Cell Death Dis.(2015) 6:e1792. doi: 10.1038/cddis.2015.162
54. Anderson AC, Joller N, Kuchroo VK. Lag-3, Tim-3, and TIGIT: co-inhibitory receptors with specialized functions in immune regulation. Immunity.(2016) 44:989–1004. doi: 10.1016/j.immuni.2016.05.001
55. Wherry EJ, Kurachi M. Molecular and cellular insights into T cell exhaustion. Nat Rev Immunol.(2015) 15:486–99. doi: 10.1038/nri3862
56. Khan O, Giles JR, McDonald S, Manne S, Ngiow SF, Patel KP, et al. TOX transcriptionally and epigenetically programs CD8(+) T cell exhaustion.
Nature.(2019) 571:211–8. doi: 10.1038/s41586-019-1325-x
57. Wing K, Onishi Y, Prieto-Martin P, Yamaguchi T, Miyara M, Fehervari Z, et al. CTLA-4 control over Foxp3+regulatory T cell function. Science.(2008) 322:271–5. doi: 10.1126/science.1160062
58. Whiteside TL. FOXP3+ Treg as a therapeutic target for promoting anti-tumor immunity. Expert Opin Ther Targets. (2018) 22:353–63. doi: 10.1080/14728222.2018.1451514
59. Sakuishi K, Ngiow SF, Sullivan JM, Teng MW, Kuchroo VK, Smyth MJ, et al. TIM3(+)FOXP3(+)regulatory T cells are tissue-specific
promoters of T-cell dysfunction in cancer. Oncoimmunology. (2013) 2:e23849. doi: 10.4161/onci.23849
60. Gautron AS, Dominguez-Villar M, de Marcken M, Hafler DA. Enhanced suppressor function of TIM-3+FoxP3+regulatory T cells. Eur J Immunol.
(2014) 44:2703–11. doi: 10.1002/eji.201344392
61. Hase K, Shatney C, Johnson D, Trollope M, Vierra M. Prognostic value of tumor “budding” in patients with colorectal cancer. Dis Colon Rectum.(1993) 36:627–35. doi: 10.1007/BF02238588
62. Kanazawa H, Mitomi H, Nishiyama Y, Kishimoto I, Fukui N, Nakamura T, et al. Tumour budding at invasive margins and outcome in colorectal cancer. Colorectal Dis. (2008) 10:41–7. doi: 10.1111/j.1463-1318.2007. 01240.x
63. Toor SM, Sasidharan Nair V, Decock J, Elkord E. Immune checkpoints in the tumor microenvironment. Semin Cancer Biol.
(2019). doi: 10.1016/j.semcancer.2019.06.021. [Epub ahead of print]. 64. Darvin P, Toor SM, Sasidharan Nair V, Elkord E. Immune checkpoint
inhibitors: recent progress and potential biomarkers. Exp Mol Med.(2018) 50:165. doi: 10.1038/s12276-018-0191-1
65. Kawakami H, Zaanan A, Sinicrope FA. Microsatellite instability testing and its role in the management of colorectal cancer. Curr Treat Options Oncol.(2015) 16:30. doi: 10.1007/s11864-015-0348-2
66. Toor SM, Elkord E. Therapeutic prospects of targeting myeloid-derived suppressor cells and immune checkpoints in cancer. Immunol Cell Biol.(2018) 96:888–97. doi: 10.1111/imcb.12054
Conflict of Interest:The authors declare that the research was conducted in the absence of any commercial or financial relationships that could be construed as a potential conflict of interest.