Modeling stormwater management at the
city district level in response to changes in
land use and low impact development
Kong, F, Ban, Y, James, P and Dronova, I
http://dx.doi.org/10.1016/j.envsoft.2017.06.021
Title Modeling stormwater management at the city district level in response to changes in land use and low impact development
Authors Kong, F, Ban, Y, James, P and Dronova, I
Type Article
URL This version is available at: http://usir.salford.ac.uk/42645/
Published Date 2017
USIR is a digital collection of the research output of the University of Salford. Where copyright permits, full text material held in the repository is made freely available online and can be read, downloaded and copied for noncommercial private study or research purposes. Please check the manuscript for any further copyright restrictions.
Modeling stormwater management at the city district level in response to changes in 1
land use and Low Impact Development 2
3
Fanhua Kong*1
, Yulong Ban2, Haiwei Yin2, Philip James3, Iryna Dronova4
4
1 International Institute for Earth System Science (ESSI), Nanjing University, Xianlin
5
Ave. 163, 210023, Nanjing, China;
6
2Department of Urban Planning and Design, Nanjing University, No. 22, Hankou Road,
7
210093, Nanjing, China;
8
3School of Environment and Life Sciences, University of Salford, Salford, M5 4WT, UK
9
4Department of Landscape Architecture and Environmental Planning, University of
10
California at Berkeley, Berkeley, CA-94720, United States.
Abstract 12
Mitigating the impact of increasing impervious surfaces on stormwater runoff by low
13
impact development (LID) is currently being widely promoted at site and local scales. In
14
turn, the series of distributed LID implementations may produce cumulative effects and
15
benefit stormwater management at larger, regional scales. However, the potential of
16
multiple LID implementations to mitigate the broad-scale impacts of urban stormwater is
17
not yet fully understood, particularly among different design strategies to reduce directly
18
connected impervious areas (DCIA). In this study, the hydrological responses of
19
stormwater runoff characteristics to four different land use conversion scenarios at the city
20
scale were explored using GIS-based Stormwater Management Model (SWMM). Model
21
simulation results confirmed the effectiveness of LID controls; however, they also
22
indicated that even with the most beneficial scenarios hydrological performance of
23
developed areas was still not yet up to the pre-development level, especially, pronounced
24
changes from pervious to impervious land.
25
Keywords: Stormwater management; LID; DCIA; Hydrological responses;SWMM; GIS 26
1. Introduction 28
The increase in the impervious surface areas as a result of urbanization has produced
29
significant hydrological effects globally (Dietz, 2007; Choi & Deal, 2008; Ahiablame,
30
2012; Bell et al., 2016). It has been widely reported that such changes disrupt the natural
31
water cycle, intensify the urban rain-island effect and the surface runoff, reduce water
32
quality and diminish the groundwater supply (Pomeroy, 2007; Sheng & Wilson, 2009).
33
Of these impacts, the most direct are significant increases in surface water runoff, flood
34
peak frequency and volume, which intensify the risk, frequency, and extent of urban
35
flood disasters (Pauleit et al., 2005) and threaten the safety and livelihoods of urban
36
residents (Baxter et al., 2002; Dougherty et al., 2007). Recent increases in the intensity of
37
precipitation events due to global climate change in various geographic locations further
38
aggravate the impact of urbanization on the natural water system (Rosenberg et al., 2010;
39
Hanak & Lund, 2012).
40
Traditional urban stormwater controls are mostly based on the grey infrastructure and
41
involve measures such as increasing the drainage network and rainfall drainage pipe
42
diameters to facilitate the rapid discharge of accumulated rainfall (USEPA, 2000;
43
Cembrano et al., 2004). However, these measures directly affect generation of local water
44
flow and associated conditions, increase the amount of stormwater, and complicate the
45
task of urban flood prevention (Pomeroy, 2007), while also resulting in a substantial loss
46
of urban water resources (Ahiablame et al., 2012). Therefore, it is important to develop
47
new alternative urban stormwater management approaches globally.
48
Increasing infiltration has always been an important way to reduce stormwater runoff
49
as well as to minimize its impacts (Huber & Cannon, 2004; Yao et al., 2016).
50
Accordingly, a number of urban stormwater management strategies have been proposed
51
and implemented in recent years, especially those controlling total impervious area (TIA)
52
(Carter & Jackson, 2007; Roy & Shuster, 2009). Examples of these measures include
53
water-sensitive urban design (WSUD) in Australia (Coffman, 2002; Zimmer et al., 2007),
54
sustainable drainage systems (SuDS) in the UK (Scholz & Grabowiecki, 2007), and best
55
management practices (BMPs) and Low Impact Development (LID) in the USA (USEPA,
56
2000; Ahiablame et al., 2012; Liu et al., 2016). Of these measures, LID is mentioned as
57
an especially promising novel stormwater management strategy. It is mainly achieved by
using green infrastructure, multilayer development and decentralized micro-scale control
59
to create post-development hydrological conditions that mimic the pre-development
60
natural hydrologic functions. LID has been widely applied for stormwater management in
61
the USA, Australia, and several European countries (USEPA, 2000; Coffman, 2002;
62
Adams, et al., 2010; Pyke et al., 2011; Ahiablame et al., 2012;Yazdi & Neyshabouri,
63
2014). Numerous research studies and practical applications have demonstrated that
64
natural drainage systems that are based on an LID concept and incorporate urban green
65
space can effectively reduce surface runoff, decrease peak flow volumes, reduce soil
66
erosion, and promote water quality (Hunt et al. 2006; Dietz 2007; Gregoire & Clausen,
67
2011). In particular, the idea of LID-referenced “sponge” cities was developed in China,
68
and a series of demonstration projections have been conducted in recent years (General
69
Office of the State Council, 2015). However, most quantitative studies of LID scenarios
70
to date have been limited to the lot or block scale. Currently, there are almost no
71
comprehensive quantitative assessments of the hydrological effects of LID measures that
72
go beyond this relatively small spatial scale. This limits the promotion and application of
73
LID at the city or regional level (Dietz, 2007; Ahiablame et al., 2012).
74
Modeling LID impact at a larger scale of decision-making is necessary to generalize
75
and provide guidance for stormwater management and LID practices (Lee et al., 2012).
76
Hydrological models can be used to simulate the effects of LID application at various
77
temporal-spatial scales in urban areas, thus enabling the potential multi-scale application
78
of LID (Elliot et al., 2009; Ahiablame, 2012). Currently, various distributed hydrological
79
models, including the SCS (Soil Conservation Service), SWAT (Soil-Water Assessment
80
Tool), MOUSE (Model for Urban Sewers, Danish Hydraulic Institute, 1995), Hydro
81
CAD, and the stormwater management model (SWMM) are available to manage urban
82
runoff (Gironás et al., 2010; Mancipe-Munoz et al., 2014; Cunha et al., 2016). Bosely
83
(2008) conducted a sensitivity analysis for the 19 most commonly used hydrological
84
models or software programs by applying them to a representative area and found that
85
SWMM was the most suitable hydrological model in the urban setting for various
86
land-use scenarios and the application of LID simulation analysis.
87
SWMM developed in 1971 by the United States Environmental Protection Agency
88
(USEPA, 2000) is a rainfall-runoff simulation model based on either a single rain event or
a long-term rain series. This model can effectively simulate hydrology, hydraulics, and
90
water quality using a series of sub-catchments that can accept rainfall as a source of
91
runoff or as a pollutant (Hsu et al., 2000; Rossman, 2010; Cunhua et al., 2016). Currently,
92
SWMM is widely used in simulation, analysis, and design in areas such as urban storm
93
runoff, drainage piping systems, catchment planning and, specially, runoff mitigation
94
with LIDs (Peterson & Wicks, 2006; Elliott & Trowsdale, 2007; Lee et al., 2013).
95
However, compared to other hydrological models, the insufficiently large scale of
96
application for SWMM remains a challenge. To address this issue, a number of
97
researchers have used GIS or the catchment discretization method to apply SWMM to
98
large urban catchments (Barco et al., 2008; Rosa et al., 2015; Dietrich, 2015).
99
Total impervious area (TIA) has often been used to represent the land surface
100
modified by urbanization (Shuster et al., 2005; Mejía & Moglen, 2010.); however, recent
101
studies have suggested that TIA is not sufficient to explain the impact of urbanization on
102
the local hydrology, for it does not reflect the impervious land connectivity pattern (Roy
103
and Shuster, 2009;Beck et al., 2016). Alternatively, the metric of directly connected
104
impervious area (DCIA), or the effective impervious area (EIA), has been proposed,
105
representing the subset of impervious surfaces that route stormwater runoff directly to
106
streams via stormwater pipes (Roy and Shuster, 2009; Jarden et al., 2016). DCIA not only
107
provides an indicator of the watershed ecological condition (Urrutiaguer et al., 2012), but
108
also has been found to strongly affect the surface runoff changes (Yao et al., 2016;
109
Ebrahimian et al., 2016; Sohn et al., 2017) and hydrological responses at the catchment
110
outlet (Mejía and Moglen, 2010). DCIA can be calculated based on the empirical
111
relationships with TIA (Jacobson, 2011; Shuster and Rhea, 2013; Ebrahimian et al., 2016).
112
However, such efforts usually lack an explicit consideration of the spatial pattern of land
113
use and specific methods of stormwater flow management (Lee and Heaney, 2003; Sohn
114
et al., 2017). The use of LID controls, and especially the spatial pattern of their
115
implementation, can play a significant role in reducing DCIA. However, until now, little
116
research has been conducted to optimize the spatial pattern of LID controls in order to
117
reduce the DCIA (Roy and Shuster, 2009; Jacobson, 2011; Ebrahimian et al., 2016).
118
In the present research, a framework was developed to simulate stormwater runoff at
119
the city scale under different development scenarios, using the GIS-based SWMM5.0
model to bring together urban planning data, geospatial and hydrological information.
121
Focusing on a case study area in a new developing region west of Bazhong, Sichuan
122
Province, China, the stormwater runoff characteristics of the four urban land use
123
conversion scenarios were simulated under the same heavy rainfall condition. The aim of
124
this study was to investigate: (1) how the hydrological responses to changes in land use in
125
the near future vary among different scenarios with rapid urbanization; (2) how a growing
126
city can integrate the LID-based design into urban planning to decrease the DCIA and
127
more effectively manage stormwater; and (3) what potential hydrological effects result
128
from LID implementation, and whether such effects can be evaluated by the GIS-based
129
SWMM at a large urban region scale. The study presents new LID-based urban
130
stormwater management models in a rapidly urbanizing region, and the results will
131
provide an important decision-making basis for the future urban and land-use planning of
132
the study area.
133
134
2. Study area 135
Bazhong is a city located in the Qinba mountains, northeastern Sichuan Province,
136
China (106°20'–107°49'E, 31°15'–32°45'N) (Fig. 1). The city has a subtropical monsoon
137
climate with four distinct seasons. The average annual rainfall is 1,108.3 mm,
138
approximately 80% of which falls from June to October. Excessive rainfall and
139
rainstorms result in frequent flooding (Zhang, 2010). Bazhong is approximately 90%
140
mountainous (Fig. 1b). Geological disasters, such as landslides and ground collapses, are
141
common after the rainstorms.
142
144
Fig. 1 Map of thestudy area: (a) location of Bazhong City in Sichuan Province; (b) the
145
DEM (Digital Elevation Model) of Bazhong City; (c) aerial photograph and (d) land use
146
map.
147
Our study area is located west of downtown Bazhong with a total area of about 838 ha
148
(Fig. 1b). At the time of this research, this area was still a predominantly rural landscape
149
covered by farmland (49.2%) and forest (42.0%) with the remaining 3% of land occupied
150
by housing, roads, and water bodies. The TIA is about 5.8% of the total study area.
151
During the rainy season, management of stormwater is mainly achieved by relying on the
152
river networks in the study area (Fig. 1 b, c and d).
153
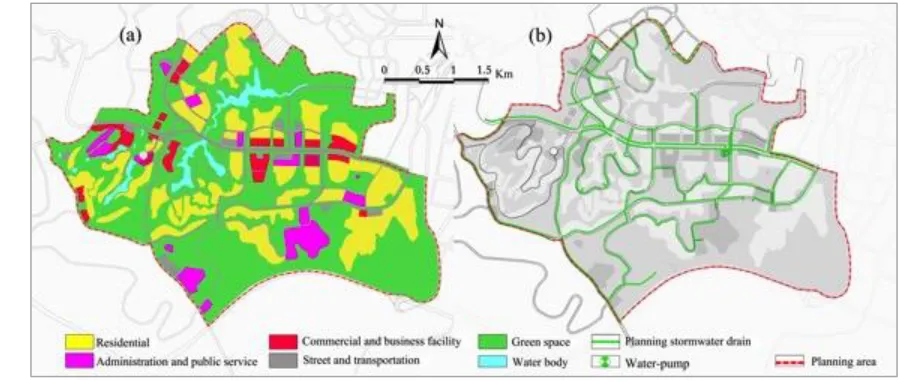
However, the 2013–2030 urban development plan for this study area indicates that the
154
land use pattern will change significantly, and the region will likely become more
155
intensively developed by 2030. Specifically, the impervious land is expected to increase
156
greatly from the development of 331.85 ha (39.63%) as new residential, commercial,
157
public service areas, and roadways (Fig. 2a). This plan also considers current natural
158
drainage system by preserving the original ecological spillway channels and rivers.
159
However, the land use change and the construction of the urban sewerage system will
160
considerably alter this natural hydrological environment and runoff regulation (Fig. 2b),
161
which creates the need to evaluate the opportunities for the green stormwater
162
infrastructure as part of the current plan for the study area.
164
Fig. 2 Planned land use and drainage system of the study area: (a) the regulatory land use
165
plan (2013–2030); (b) the planned stormwater drainage networks.
166
167
3. Data and methods 168
3.1 Data and data preprocessing 169
The following data were used for scenario modeling: a 2011 CAD topographic data; 2012
170
aerial photograph data (0.1m x 0.1m); the 2013–2030 regulatory planning data (CAD
171
format) including a land-use layout map, a road planning map, and a rainwater conduit
172
network map (supplied by Bazhong Landscape Bureau); and the daily rainfall and hourly
173
rainfall distribution data for June 23–24, 2015, approximately corresponding to a 10-year
174
return-period rainfall event in Bazhong City (obtained from Bazhong meteorological
175
Bureau).
176
The CAD topographic data was first converted to a GIS shapefile dataset, and the
177
projected coordinate system was set to a Universal Transverse Mercator (UTM)-projected
178
Xi’an 80 geographical coordinate system. Then, the aerial photograph data were rectified
179
and georeferenced to the UTM coordinate system using the reference topographic map
180
(total root mean square (RMS) < 1 image pixel) in ArcGIS software (Version 10.2, ESRI,
181
Redlands, CA 92373-8100, USA). A land use map was created through these aerial
182
photograph data by manual delineation and interpretation of landscape polygons using
183
eCognition (Trimble Inc.) software (version 8.7) (see Fig. 1d). Finally, the regulatory
184
planning data were all converted to GIS shapefile datasets and then used to create the
185
land use, road and rainwater pipe network maps for the planning scenario analysis.
186
3.2 Designs of urban development scenarios 187
Four land development scenarios were simulated in this research. The scenarios were:
[image:9.612.76.526.72.263.2]S1, the pre-development scenario (current situation); S2, a traditional urban development
189
scenario; S3, an urban development with hypothetical LID implementation; and S4, an
190
urban development plan in which hypothetical LID controls were combined with the
191
specific goal of reducing DCIA. These scenarios were designed according to the urban
192
zoning and planning (regulatory planning), the current land use pattern and the planned
193
stormwater management strategies.
194
1) Pre-development scenario (S1) 195
S1 represents the current, pre-development state. The hydrological environment in S1
196
was considered as the natural state in this research. The land cover in S1 consists of
197
primarily forestland and farmland, and the TIA is about 5.8%.
198
2) Traditional urban development scenario (S2) 199
The traditional urban development scenario (S2) does not include the LID stormwater
200
management. However, with rapid urbanization, the built-up land will significantly
201
increase, replacing the farmland and forestlands. The TIAwill rise to 40%.
202
3) Urban development with LID controls (S3) 203
This scenario includes a suite of potential LID implementations (Green-roof, Porous
204
pavement, Vegetative swale and Rain garden) applied to the impervious areas that are not
205
directly routing stormwater runoff to streams via stormwater pipes, that is, the
206
non-directly connected impervious areas (NDCIA). After implementation of the LID
207
controls, the percentage of pervious surface of S3 will be approximately 75.6%.
208
4) LID controls by considering overland flow routing and DCIA (S4) 209
This scenario has the same total area of LID and the drainage systems as S3, but two
210
types of LID (Porous pavement and Green-roof) were specifically allocated within the
211
DCIA regions, and a specific type of overall flow was designated for each sub-catchment.
212
There are three routes for overland flow in the SWMM model: pervious, impervious, and
213
outfall (Huber, 2001). This S4 scenario used the pervious route mode which implies that
214
the stormwater runoff would be first routed to the LID sites, and accordingly the DCIA
215
would be reduced.
216
3.3 SWMM model setup 218
3.3.1 Generation of sub-catchments, conduits, junctions, and outlets 219
The EPA (U.S. Environmental Protection Agency) Stormwater Management Model
220
(SWMM, Version 5.0, EPA, Cincinnati, Ohio) was used to simulate the hydrological
221
response to the land use changes and LID controls in the study area. In the SWMM
222
model, a given watershed can be developed as a set of physical components, including
223
sub-catchments, conduits, junctions, and outlets.
224
The sub-catchment is the fundamental unit of the hydrological model. To represent
225
pre-development conditions, sub-catchments were first constructed based on the digital
226
elevation model (DEM) (5m x 5 m resolution), using the ArcHydro extension in ArcMap
227
(9.3 ESRI, Redlands, California) by creating a depressionless DEM (filling analysis),
228
defining the flow direction, calculating the flow accumulation, and then creating the
229
outlet of the river networks (Martz & Garbrecht 1992; Barco et al., 2008) (Fig. 3a and b).
230
As urbanization is expected to substantially alter the surface hydrological
231
characteristics, the sub-catchments had to be further subdivided based on the surface
232
types and land use types (Krebs et al., 2013). Incorporating the planned road network
233
(e.g. the road width, slope, and cross-sectional shape) was especially important, as it
234
affects the stormwater surface flow routing, and in the study area most of the planned
235
stormwater drainage system will also be developed along the roads (Fig. 3c). Thus, the
236
sub-catchments obtained using DEM were further discretized by overlaying the
237
centerlines of the roads with the drainage pipes within their areas. The sub-catchment
238
boundaries were further adjusted using DEM and in-situ observations to ensure their
239
consistency in the surface runoff characteristics after the planned development (Ji and
240
Qiuwen, 2015). These operations produced a set of 80 sub-catchments in the
241
pre-development state (Fig. 3a), and 118 sub-catchments in the urban development
242
scheme (Fig. 3d). Geometric properties of each sub-catchment, such as area, spatial
243
coordinates, flow length and width, percentage of impervious surface cover, and slope
244
were subsequently quantified and added to the attribute table of the spatial dataset.
245
247
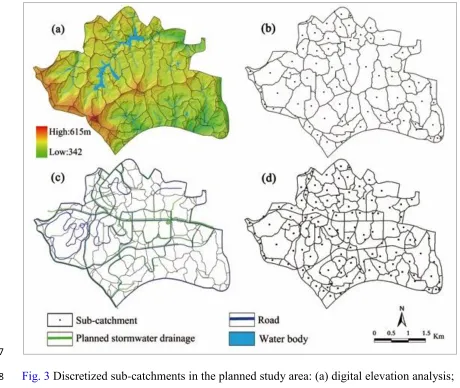
Fig. 3 Discretized sub-catchments in the planned study area: (a) digital elevation analysis;
248
(b) current sub-catchment layout; (c) planned road and drainage networks; (d) discretized
249
sub-catchments under the future planned land use
250
Next, the planned drainage network (Fig. 2b) together with flow directions within
251
and between the sub-catchments and in-situ observations were used to generate detailed
252
information on the rainwater conduit characteristics (i.e., spatial location, conduit
253
diameter, conduit segment length, cross-sectional shape, and conduit slope), the conduit
254
junctions (i.e., spatial location and depth), and the stormwater outlets (i.e., spatial location
255
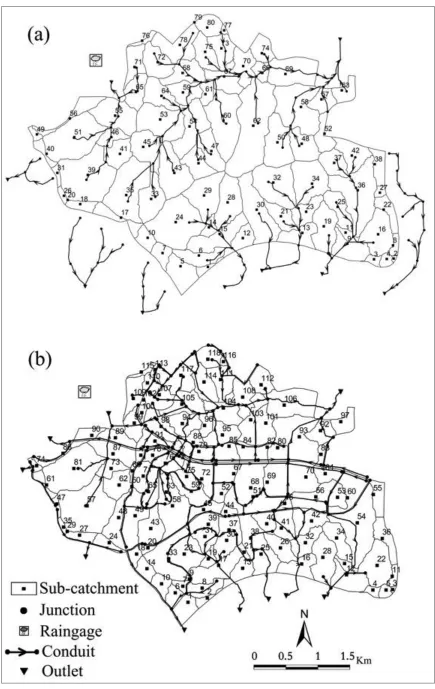
and depth). As a result, scenario S1 had 95 junctions, 95 conduit segments, 9 rainwater
256
outlets in the study area (Fig. 4a), while scenarios S2 S3, S4 had 151 junctions, 150
257
conduit segments, and 10 rainwater outlets (Fig. 4b).
258
[image:12.612.68.528.71.459.2]260
Fig. 4 The conceptualized stormwater drainage system: (a) the sub-catchments of study
261
area (S1); (b) stormwater drainage system in the SWMM model (S2, S3 and S4)
262
263
3.3.2 Data conversion between GIS and SWMM 264
To enable the SWMM-based modeling at the city scale, all the relevant
265
format of the SWMM. First, the sub-catchment polygon GIS vector shapefiles datawere
267
converted to point datasets, where all the vertices of the original polygons were
268
preserved. Then, each relevant data layer required for the model was exported as a .txt file
269
to satisfy the SWMM input data requirements (Rossman, 2010). Finally, the file
270
extension of the TXT file (.txt) was changed to .inp, and the relevant SWMM inputs
271
could now be used in the model. Thus, these steps coupled the SWMM with a
272
Geographic Information System (GIS) to provide a database for the required model data.
273
Such a GIS-based SWMM model can be used on a large scale, while the runoff and the
274
flow routing modules in the SWMM can be used to simulate stormwater flow from the
275
ground surface over the whole-city system (Krebs et al., 2013).
276
277
3.3.3 SWMM model parameters 278
Runoff simulations for pre- and post-development (or different land use scenarios)
279
in SWMM required a substantial number of input parameters. The majority of the
280
parameters used to define the ground surface and the stormwater drainage network
281
characteristics were derived from the available GIS data and then coupled with the
282
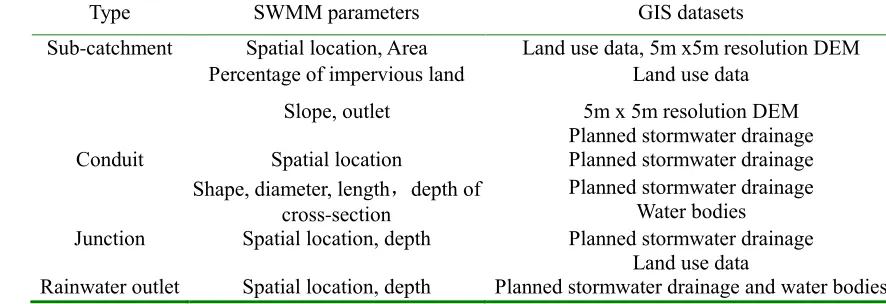
SWMM directly (Table 1).
283
[image:14.612.74.517.598.750.2]284
Table 1. The SWMM parameters extracted from GIS datasets
285
Type SWMM parameters GIS datasets
Sub-catchment Spatial location, Area Land use data, 5m x5m resolution DEM
Percentage of impervious land Land use data
Slope, outlet 5m x 5m resolution DEM
Planned stormwater drainage
Conduit Spatial location Planned stormwater drainage
Shape, diameter, length,depth of
cross-section
Planned stormwater drainage Water bodies
Junction Spatial location, depth Planned stormwater drainage
Land use data
Rainwater outlet Spatial location, depth Planned stormwater drainage and water bodies
286
The remaining parameters were determined by the land use type and the
287
sub-catchment properties, which included: the depression storage for pervious (Per-DS)
288
and impervious surfaces (Imp-DS); Manning’s n value for overland flow for pervious
289
(Per-n) and impervious (Imp-n) surfaces, and conduits (Conduit-n); the hydraulic
290
conductivity of the impervious surface and the soil infiltration parameters (Rossman,
291
2010). The parameters values assigned to SWMM model based on the SWMM 5.0
manual (Rossman, 2010) and adjusted according to the characteristics of each
293
sub-catchment were listed in Table 2. The soil infiltration in pervious areas was
294
determined using the Horton method (Horton, 1933).
295
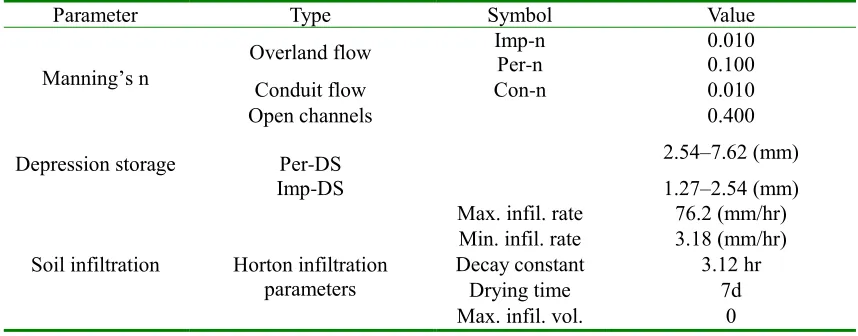
[image:15.612.88.517.203.371.2]296
Table 2: Input Parameters for the SWMM model
Parameter Type Symbol Value
Manning’s n
Overland flow Imp-n Per-n 0.010 0.100
Conduit flow Con-n 0.010
Open channels 0.400
Depression storage Per-DS 2.54–7.62 (mm)
Imp-DS 1.27–2.54 (mm)
Soil infiltration Horton infiltration
parameters
Max. infil. rate 76.2 (mm/hr)
Min. infil. rate 3.18 (mm/hr)
Decay constant 3.12 hr
Drying time 7d
Max. infil. vol. 0
297
3.3.4 LID settings and estimation of DCIA 298
The number, types, and locations of LID elements are the most widely considered
299
criteria in LID design (Martin-Mikle et al., 2015). In this study, the hypothetical LID
300
control types were based mainly on the various land use characteristics of each
301
sub-catchment, and LID design criteria were established according to the “Technical
302
Guide for Sponge Cities-Construction of Low Impact Development” in China (MoHURD,
303
2014). In residential and commercial areas, LID controls were designed predominantly as
304
green roofs; in the paved squares of residential and commercial districts, they were set
305
mainly as the porous pavement; along the roads, LID were designed as grassed swales;
306
and in the parks, the LIDs were designed as rain gardens (MoHURD, 2014). The numbers
307
of LIDs were allocated based on the area of different land types in each sub-catchment,
308
for example, the number (and area) of green roofs were determined by the residential area,
309
building density (i.e., the area of the building ground floor footprints divided by the total
310
site area, which can indicate the amount of open space left on the site; Ministry of
311
construction, P.R. China, 1998; Yu et al., 2010) and potential greening rate of the roofs.
312
The summary of how the LID controls were designed is shown in Table 3. The allocation
313
of LID designs followed the rule that the runoff passes through a pervious area before
314
entering the sewage system (inlet), which could reduce DCIA and facilitate stormwater
315
management (Gironás et al., 2010). Accordingly, in the SWMM model, the pervious
Note: building densities of different land use types were taken as their upper limit according to 318
building density requirement in the detailed planning regulations of China and Bazhong (Bazhong 319
Planning Bureau, 2014); the green roof rate, porous pavement rate and potential rain gardens were 320
set according to the Sponge city design technologies and practice manual 6 (MoHURD, 2016). 321
322
The type and numbers of the hypothetical LID controls were specified on a
323
per-unit-area basis according to the land use type and the impervious surface coverage in
324
each sub-catchment. Other parameters listed in Table 4 were set using recommended
325
parameter thresholds in the SWMM manual and the relevant literature for the model
326
(Rossman, 2010;Gomez-Ullate, 2011).
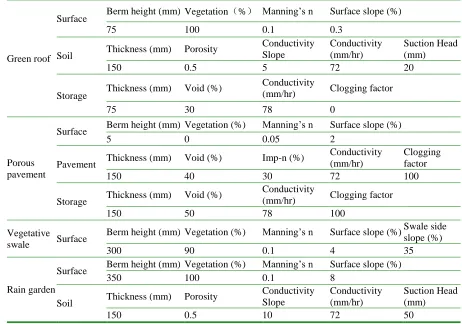
[image:16.612.83.545.547.871.2]327
Table 4 Parameters used for LID controls in the SWMM model
328
Green roof
Surface Berm height (mm) Vegetation(%) Manning’s n Surface slope (%)
75 100 0.1 0.3
Soil Thickness (mm) Porosity
Conductivity Slope Conductivity (mm/hr) Suction Head (mm)
150 0.5 5 72 20
Storage Thickness (mm) Void (%)
Conductivity
(mm/hr) Clogging factor
75 30 78 0
Porous pavement
Surface Berm height (mm) Vegetation (%) Manning’s n Surface slope (%)
5 0 0.05 2
Pavement Thickness (mm) Void (%) Imp-n (%)
Conductivity (mm/hr)
Clogging factor
150 40 30 72 100
Storage Thickness (mm) Void (%)
Conductivity
(mm/hr) Clogging factor
150 50 78 100
Vegetative
swale Surface
Berm height (mm) Vegetation (%) Manning’s n Surface slope (%)Swale side slope (%)
300 90 0.1 4 35
Rain garden
Surface Berm height (mm) Vegetation (%) Manning’s n Surface slope (%)
350 100 0.1 8
Soil Thickness (mm) Porosity
Conductivity Slope Conductivity (mm/hr) Suction Head (mm)
150 0.5 10 72 50
329
Finally, to understand the impacts of reducing DCIA on hydrological processes by
330
Table 3 LID control settings
Land type controls LID Set-up method
Residential land Green roof Area × Building density (35%)× Potential green roof rate (0.5) Administrative land Green roof Area × Building density (50%)× Potential green roof rate (0.6) Administrative land Porous pavement Area×[1-Greening rate (25%)-Building density (50%)] ×Potential porous pavement rate (0.3) Commercial land Green roof Area × Building density (60%) × Potential green roof rate (0.8) Commercial land Porous pavement Area×[1-Greening rate (25%)-Building density (60%)]× Potential porous pavement rate (0.5) Transportation
al., 2017). Generally, accurate and direct measurement of DCIA is complicated and
332
usually requires high resolution land use data, but using GIS tools together with detailed
333
CAD data and field verification could improve the accuracy of DCIA assessments (Lee
334
and Heaney, 2003; Roy and Shuster, 2009). In the ArcGIS environment, all the merged
335
impervious land areas (residential land, commercial land, administrative land and roads)
336
were first overlaid with the sub-catchment data layer, and their attributes were assigned
337
based on the attributes of each sub-catchment area. This step allowed the impervious land
338
area to be intersected with the sub-catchment boundaries while preserving the attributes
339
of the corresponding sub-catchments. Then, using the Location Selection tool in ArcGIS,
340
all of the impervious land area was intersected with the drainage network system with
341
different pipe widths (500 mm, 600 mm, 700 mm and 800 mm, 1000 mm and 1200 mm)
342
(Roy and Shuster, 2009). Consequently, the resulting impervious area selected by the
343
drainage networks represented DCIA with the attributes of each sub-catchment (Lee and
344
Heaney, 2003). Finally, a general summary statistics for DCIA and other landscape
345
characteristics were estimated for the four designed scenarios (Table 5).
346
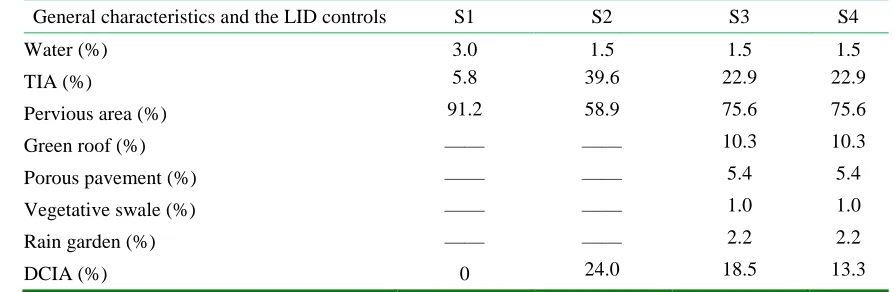
[image:17.612.78.525.515.661.2]347
Table 5 General characteristics and the LID controls of the four designed scenarios
348
General characteristics and the LID controls S1 S2 S3 S4
Water (%) 3.0 1.5 1.5 1.5
TIA (%) 5.8 39.6 22.9 22.9
Pervious area (%) 91.2 58.9 75.6 75.6
Green roof (%) —— —— 10.3 10.3
Porous pavement (%) —— —— 5.4 5.4
Vegetative swale (%) —— —— 1.0 1.0
Rain garden (%) —— —— 2.2 2.2
DCIA (%) 0 24.0 18.5 13.3
349
3.3.5 Storm event 350
To evaluate the stormwater drainage systems, larger, less frequent storm events are
351
often used to check whether such systems can meet flood control requirements (Rosa et al.,
352
2015). In this research, a 10-year return period storm event in Bazhong city was used to
353
examine the hydrological responses to the LID controls and different urban development
354
scenarios.
355
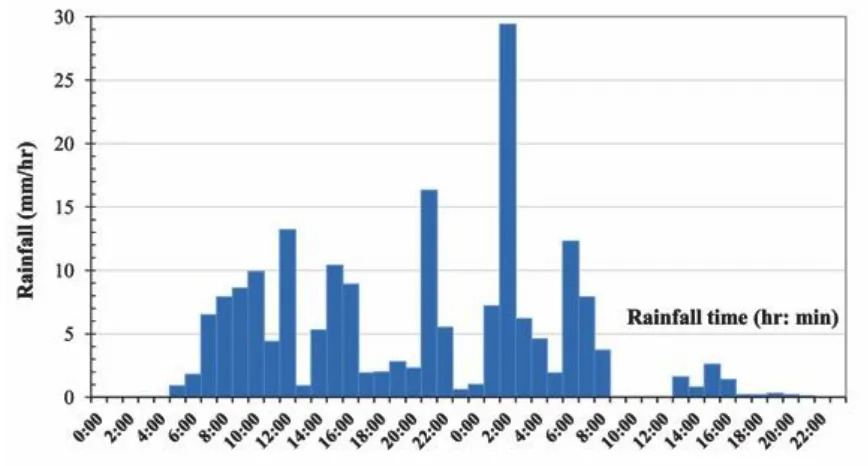
According to the rain record of Bazhong Meteorological Bureau, the storm event
356
occurred from 23–24 June, 2015 and produced a maximum precipitation of 191.7mm.
357
The rainfall intensities were over 5 mm h-1 for the duration of the entire storm, with peak
rain rates measured at over 29.4 mm h-1 (Fig. 5). Days of heavy rain caused mudslides
359
and flooding. According to the historical statistics, 64.69 million people were affected by
360
this storm, and the direct economic losses were 406 million Yuan (RMB).
361
362
[image:18.612.87.521.178.411.2]363
Fig. 5 Hyetograph from 00:00 on the 23th to 23:00 on the 24th, June, 2015
364
365
4. Results and discussion 366
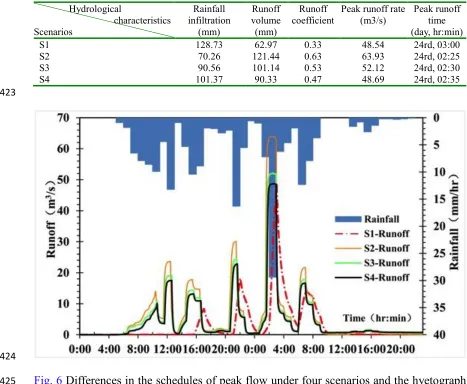
4.1 Comparison of the surface hydrological characteristics under four scenarios 367
The SWMM-simulated results of the overland hydrological characteristics during the
368
same storm event showed important differences among the four examined scenarios (Table 369
6). The traditional development scenario, S2 had the largest runoff volumes, runoff
370
coefficients, peak flow and the lowest percentage of infiltration. This result implies that if
371
the study area is developed in a traditional way, i.e. S2, then TIA would change from
372
5.8% in the pre-development scenario (S1) to 39.6% (Table 5). If there were no other
373
changes in stormwater management, then the hydrological performance would be
374
dramatically changed and the natural hydrological processes in S1 would be disrupted.
375
Under scenario S1, the average runoff volume and runoff coefficient were 62.97 mm and
376
0.33 respectively, and the majority of the rainfall (67.2%) directly infiltrated to the ground.
377
However, the runoff volumes and runoff coefficients of S2 were 121.44 mm and 0.63
378
respectively. The results showed that a 33.3% reduction in pervious area yielded up to
379
92.9% and 90.9% increase in runoff and runoff coefficients. At the same time, such
380
reduction in pervious land of S2 will also result in a 31.7% increase in the peak flow and
development would cause an increase in TIA and a sharp decline in surface permeability
383
and water storage capacity, thereby dramatically increasing the surface runoff, the runoff
384
coefficient and the peak flow rate (Fig. 6). 385
Compared with scenario S2, S3 improved the surface hydrological characteristics.
386
Specifically, the runoff volumes and runoff coefficients of S3 decreased by 16.69% and
387
15.87%, respectively, while the peak runoff also decreased (Fig. 6). These changes in
388
hydrological behavior can be attributed to the implementation of LID controls, which
389
produce a 16.7% increase (Table 5) in pervious land in the study area in this scenario.
390
Even though S3 and S4 both implemented the LID controls and over the same total
391
land area, S4 was obviously more effective in stormwater regulation by considering the
392
overland flow routing and reducing impervious connectivity. Compared with S3, the
393
runoff volumes and the runoff coefficients in scenario S4 decreased by 10.68% and
394
11.32%, respectively (Table 6). This indicates that measures such as designing the
395
overland flow routing and blocking the impervious connectivity with an optimized LID
396
spatial pattern may further decrease the risk of urban flooding. A spatially improved LID
397
will disrupt the direct connectivity among urban impervious surfaces, which may reduce
398
the DCIA and prevent the surface runoff from flowing directly into the conduits. With a
399
decrease in DCIA from 18.5% to 13.3% (Table 5), the retention time and infiltration of
400
the surface runoff will increase, the runoff volume and runoff coefficient will be
401
accordingly reduced, and the peak runoff will also decrease (Table 6 and Fig. 6).
402
The lag time between rainfall and runoff generation in S1 was 10h 40 min
403
(5:00-15:40 23rd June), which is clearly longer than in the other three scenarios. The
404
rainfall peak time lasted around one hour from (02:00-02:55, 24th June). However, the
405
surface peak runoff of S1 was at 03:00. This indicates that the undeveloped land surface
406
obviously contributed to the rainfall infiltration and delay in the peak runoff generation.
407
The surface peak runoff of S2 showed the smallest delay (2h00min vs 2h25min)
408
compared to the rainfall peak (Table 6, Fig. 6). Such relatively small difference between
409
the peaks of rainfall and runoff illustrates the short travel time for surface runoff after the
410
area is urbanized as planned. Compared to S1, the surface peak runoffs of S3 and S4
411
showed around half-hour delay relative to the rain peak (02:30 and 02:35 vs 02:00); yet,
412
the respective peak runoff times were S1 03:00, S3, 02:30 and S4 02:35 (Table 6, Fig. 6).
This evidence demonstrates that implementation of LID practices would impact the
414
timing of runoff, but these effects are strongly dependent on land cover, and the increase
415
in impervious area would still trigger an earlier runoff peak time. In general, compared
416
with S2, the LID controls in S3 and S4 can greatly change and improve the overland
417
hydrological characteristics under the traditional development model, even though LID
418
controls cannot completely recreate hydrological functions equivalent to those of the
419
pre-development state.
420
421
Table 6. Variation in surface hydrological characteristics under four scenarios
422
Hydrological
characteristics Scenarios
Rainfall infiltration
(mm)
Runoff volume (mm)
Runoff
coefficient Peak runoff rate (m3/s) Peak runoff time (day, hr:min)
S1 128.73 62.97 0.33 48.54 24rd, 03:00
S2 70.26 121.44 0.63 63.93 24rd, 02:25
S3 90.56 101.14 0.53 52.12 24rd, 02:30
S4 101.37 90.33 0.47 48.69 24rd, 02:35
423
424
Fig. 6 Differences in the schedules of peak flow under four scenarios and the hyetograph
425
for the selected rain event.
426
427
4.2 Comparison of the flow rate and flood peak time in conduits under four 428
scenarios 429
The primary drainage conduits in scenario S1 are all natural rivers and canals without
430
the urban drainage pipe networks, while scenarios S2, S3, and S4 have the same urban
431
drainage pipe networks. Simulation results show that in scenario S1, the average peak flow
432
in the rivers and canals was 1.24 m3/s, and the flow rate was 0.19m/sec, the peak flow time
[image:20.612.56.523.319.703.2]was at 03:06 on the 24th (Tables 6, 7). However, compared with S1, the velocity of flow in
434
the conduits in S2 was 1.06 m/sec, and the peak flow time occurred at 22:28 on the 23rd,
435
indicating the 4.57 times increase in the flow rate and more than 4-hour advancement of the
436
peak flow time. These results confirm that the loss of pervious land following urbanization
437
will likely impact flow characteristics in conduits, thus increasing the risk of stormwater
438
accumulation and urban flooding.
439
The effects of LID controls were clearly observed in the comparison of peak flows
440
and peak flow times of S2 with S3 and S4. When the LID controls were considered, the
441
peak flows in the conduits of scenarios S3 and S4 decreased substantially by 6.15% and
442
9.23% compared to S2, and the peak flow time was delayed by 1h 33 min, and 1h 37 min,
443
respectively (Table 7). However, between scenarios S3 and S4, the flood flow rate in S4
444
decreased by 1.94%, and the peak flood time was delayed by only 4 min. Thus,
445
simulation results indicate that LID controls will substantially improve hydrological
446
performance of the developed areas; however, the decrease in DCIA via spatially
447
improved LID controls may be less effective at reducing the flood rate and peak runoff
448
time in the conduits, especially during large rainfall events.
449
[image:21.612.79.528.571.652.2]450
Table 7. Variation in conduit peak flow, flow rate and peak runoff time for four scenarios 451
Scenario Peak flow(m3/s)
Flow rate (m/s)
Peak runoff time (day, hr:min)
Time-lag (compared with S2)
S1 1.24 0.19 24th, 03:06 4h38m
S2 0.65 1.06 23rd, 22:28
--S3 0.61 1.03 24th, 00:01 1h33m
S4 0.59 1.01 24th, 00:05 1h37m
452
4.3 Comparison of flow rate and peak flow time at junctions under four scenarios 453
In the current pre-development state, scenario S1, the total inflow volume of the
454
junctions was 2887.3 × 106 L, the average peak flow was 1.49 m3/s, and peak flow time
455
was at 03:08 on the 24th (Table 8). Compared with scenario S1, S2 had the total flow
456
volume of 4117.4×106 L, which represented an increase of 42.6%. The corresponding
457
peak flow time occurred 46 min earlier, and the average peak flow (0.99m3/s) decreased
458
by 33.6%. These outcomes occurred because S1 did not include any drainage pipe
459
networks besides the natural rivers and canals. These results confirm that if no measures
460
are taken to compensate for the loss of pervious land, urbanization in the study area will
substantially affect the junction flow characteristics and likely increase the risk of urban
462
flooding.
463
[image:22.612.69.524.182.277.2]464
Table 8. Variation in junction flow rate and peak flow time for four scenarios 465
Scenario Peak flow time (day, hr:min) Average peak flow (m3/s) Total flood volume (106L)
S1 24, 03:08 1.49 2887.3
S2 24, 02:22 0.99 4117.4
S3 24, 02:34 0.87 3671.2
S4 24, 02:40 0.83 3313.5
466
Compared to S2, the use of LID controls in S3 will decrease the average peak flow
467
decrease by 12.1%, decrease the total inflow volume by 10.8%, and delay the peak flood
468
time by 12 min, suggesting an improvement of the overall stormwater regulation following
469
the application of LID, which indicates that the application of LID controls can mitigate the
470
impacts that urbanization has on the stormwater conveying. Compared with S3, average
471
peak flow and the total flow volume for scenario S4 decreased by 4.6%, and 9.7%
472
respectively, and the peak flow time was delayed by 6 min. These results indicate that an
473
appropriate spatial pattern of LID controls is also important for improving hydrological
474
performance in the junctions (Table 8).
475
476
4.4 Comparison of outflows in the outlets under four scenarios 477
Differences in general outflow characteristics of the outlets could indicate the
478
cumulative effects of the hypothetical LID applications (Gironás et al., 2009). The
479
pre-development scenario S1 had the smallest total flow volume (464.7×10⁶L), however,
480
S2 had the largest total flow volume (733.8 ×10⁶L). The results indicate that, compared to
481
S1, the loss of pervious land (33.3%) will bring an increase of 57.9% flood volume.
482
Furthermore, the largest average peak flow (5.1 m3/s)and the earliest peak flow time (at
483
22:51 on the 23rd) of S2 show that urbanization will lead to a strong increase in peak
484
discharge and a very early peak flow at the outlets. Compared with S2, the total flow
485
volume for S3 and S4 decreased by 8.66%, 14.75% to 670.3 ×10⁶ and 625.5×10⁶L,
486
respectively, and the average peak flow decreased by 8.59% and 14.14% to 4.7m3/s and
487
4.4m3/s respectively. The corresponding peak flow times were both delayed by 87 min.
488
Thus, LID installations could reduce the average peak flow and total flow volume in S3
and S4. In comparison to S3, the average peak flow and the total flow volume of S4
490
decreased by 6.4% and 6.7%, respectively, despite the identical peak flow times of these
491
scenarios. This result implies that reducing DCIA by changing the locations of
492
hypothetical LID controls would contribute to reducing the outflow at the outlets. Thus it
493
can be concluded that improving the LID spatial pattern and at the same time considering
494
the overland flow routing by redirecting surface runoff to the LID units are both important
495
for management of stormwater (Table 9). 496
[image:23.612.80.521.322.384.2]497
Table 9. Comparison of the outflows in the outlets under the four scenarios 498
Scenario Average peak flow (m3/s) Peak flow time (day, hr: min) Total flow volume (106L)
S1 4.2 24rd, 03:47 464.7
S2 5.1 23rd, 22:51 733.8
S3 4.7 24rd, 00:18 670.3
S4 4.4 24rd, 00:18 625.5
499
5. Conclusion 500
Hydrological performances of the four urban development scenarios under the same
501
single storm event were simulated using the GIS-based SWMM5.0 in a new urbanized
502
area, west of Bazhong, China. Hydrological responses to the land use changes, as well as
503
the effects of hypothetical LID practices were evaluated by comparisons with a traditional
504
urban development scenario. This research integrated LID controls within urban planning
505
to manage stormwater and provided an operable technical framework that demonstrated
506
how SWMM, with the support of GIS, can be used at the city and district scale. The
507
results of this study illustrate that urban development as described in regulatory planning
508
(S2) would produce large increases in the impervious surface, and flood control will be a
509
critical planning issue; however, traditional stormwater management strategies cannot
510
cope with these problems well. Alternatively, urban development schemes integrating
511
LID controls (S3) and designs to decrease DCIA (S4) can contribute to mitigating the
512
impacts of urbanization by attenuating stormwater runoff, even though the study area
513
could not be completely restored to the pre-development hydrological environment.
514
Consistent with previous studies (Loperfid et al., 2014; Juan et al., 2016), results from
515
this analysis also imply that following a massive increase in impervious land (from
516
5.8%-39.6 as in this study), the TIA might still be the main factor controlling stormwater
517
hydrology behavior, especially under large rainfall events. Nevertheless, the results still
corroborate the effectiveness of LID controls and design in providing some flood
519
reduction benefits.
520
The research reported here presents a modeling study of the potential effects of the
521
large-scale implementation of LID practices as an important step in guiding large-scale
522
LID practices, planning and overall effort. Several limitations should be also
523
acknowledged that present important directions for the future work. First, there are
524
limitations to using the recommended model parameter values from the SWMM5.0 manual
525
or relevant literature. Complex topography and large number of sub-catchments in urban
526
areas ideally require that input parameters for the SWMM should be obtained through
527
direct field survey and observations. Second, a better understanding of LID controls and
528
their hydrological effects will require a finer level of sub-catchment discretization to
529
properly account for their localized placement. Because this study was conducted at a
530
district scale, the effects of factors such as the underground water level, evaporation and
531
current water retention on the simulation results were not considered in the model
532
simulation. In addition, a more informative comparison of development scenarios could
533
be achieved with a continuous long-term simulation to evaluate the land use change and
534
LID performance. Finally, in this research, the drainage pipe system of the three
535
post-development scenarios are the same, and only one heavy rainfall condition was used
536
to assess the impact of LID and DCIA decrease on stormwater runoff characteristics. The
537
optimizing possibility of the grey stormwater drainage systems and the effect of LID
538
controls and DCIA change on the sensitivity of stormwater runoff characteristics to
539
different rainfall events were both not considered, which also represents an important
540
future step to inform the improvement of urban planning and stormwater management
541
strategies in growing cities such as our study region. Further research is needed to look
542
into the integration of LID systems with grey stormwater drainage systems and fully
543
understand the effects of LID controls and the DCIA under different rainfall conditions.
544
Acknowledgments 546
This research was supported by the National Natural Science Foundations of China (Nos.
547
31670470, 41440006, 51478217). We also thank Professor Sally Thompson from UC
548
Berkeley Civil and Environmental Engineering for the useful comments.
549
550
References 551
Adams, L. M., Schulte, S., Rivarola, M., McDonald, C., Ruhl, J. K., (2010). Alternative
552
Futures: Economic and Water Resource Analysis of Traditional vs. Low Impact
553
Redevelopment. In: S Struck. K H. Lichten Low impact development: redefining
554
water in the city. San Francisco: ASCE Press: 853–863.
555
Ahiablame, L. M., Engel, B. A., & Chaubey, I. (2012). Effectiveness of low impact
556
development practices: literature review and suggestions for future research. Water,
557
Air, & Soil Pollution, 223(7), 4253-4273.
558
Barco, J., Wong, K. M., & Stenstrom, M. K. (2008). Automatic calibration of the US EPA
559
SWMM model for a large urban catchment. Journal of Hydraulic Engineering, 134(4),
560
466-474.
561
Baxter, P. J., Moller, I., Spencer, T., Spence, R. J., Tapsell, S., (2002). Flooding and climate
562
change. In P. Baxter, A. Haines, M. Hulme, R. S. Kovats, R. Maynard, D. J. Rogers
563
and P. Wilkinson (Eds.). Health Effects of Climate Change in the UK, Department of
564
Health, London, 152–192.
565
Bazhong Planning Bureau, 2014. Bazhong Technical Regulations on Urban Planning and
566
Management, Available at: http://www.bzgh.gov.cn/Notice/2014/12-30/1506.html (in
567
Chinese)
568
Beck, S. M., McHale, M. R., Hess, G. R. (2016). Beyond Impervious: Urban Land-Cover
569
Pattern Variation and Implications for Watershed Management. Environmental
570
management, 1-16.
571
Bell, C. D., McMillan, S. K., Clinton, S. M., & Jefferson, A. J. (2016). Hydrologic
572
response to stormwater control measures in urban watersheds. Journal of Hydrology,
573
Bosley, E. K., II. (2008). Hydrologic evaluation of low impact development using a
574
continuous, spatially-distributed model. MA thesis, Virginia Polytechnic Institute and
575
State Univ., Va.
Carter, T., Jackson, C. R. (2007). Vegetated roofs for stormwater management at multiple
577
spatial scales. Landscape and urban planning, 80(1), 84–94.
578
Cembrano, G., Quevedo, J., Salamero, M., Puig, V., Figueras, J., & Martı, J. (2004).
579
Optimal control of urban drainage systems. A case study. Control Engineering
580
Practice, 12(1), 1-9.
581
Choi, W., & Deal, B. M. (2008). Assessing hydrological impact of potential land use
582
change through hydrological and land use change modeling for the Kishwaukee River
583
basin (USA). Journal of Environmental Management, 88(4), 1119–1130.
584
Coffman, L. S., 2002. Low-impact development: an alternative stormwater management
585
technology. In R. L. France (Ed.), Handbook of water sensitive planning and design
586
(pp. 97–124). Washington, D.C.: Lewis.
587
Cunha, M. C., Zeferino, J. A., Simões, N. E., & Saldarriaga, J. G. (2016). Optimal location
588
and sizing of storage units in a drainage system. Environmental Modelling &
589
Software, 83, 155-166.
590
Dietrich, A. T. (2015). Estimation of stormwater runoff mitigation in Lucas County, Ohio
591
using SWMM modeling and GIS analysis (Doctoral dissertation, University of
592
Toledo).
593
Dietz, M. E. (2007). Low impact development practices: A review of current research and
594
recommendations for future directions. Water, air, and soil pollution, 186(1-4),
595
351-363.
596
Dougherty, M., Dymond, R. L., Grizzard Jr, T. J., Godrej, A. N., Zipper, C. E., &
597
Randolph, J. (2007). Quantifying long-term hydrologic response in an urbanizing
598
basin. Journal of Hydrologic Engineering, 12(1), 33-41.
599
Ebrahimian, A., Wilson, B. N., Gulliver, J. S. (2016). Improved methods to estimate the
600
effective impervious area in urban catchments using rainfall-runoff data. Journal of
601
Hydrology, 536, 109–118.
602
Elliott, A. H., & Trowsdale, S. A. (2007). A review of models for low impact urban
603
stormwater drainage. Environmental modelling & software, 22(3), 394-405.
604
Elliott, A. H., Trowsdale, S. A., & Wadhwa, S. (2009). Effect of aggregation of on-site
605
stormwater control devices in an urban catchment model. Journal of Hydrologic
606
Engineering, 14(9), 975-983.
General Office of the State Council. Guiding Opinions of the General Office of the State
608
Council on Advancing the Construction of Sponge Cities. 2015.
609
http://www.gov.cn/zhengce/content/2015-10/16/content_10228.htm.
610
Gironás, J., Roesner, L. A., Davis, J., Rossman, L. A., & Supply, W. (2009). Storm water
611
management model applications manual. Cincinnati, OH: National Risk Management
612
Research Laboratory, Office of Research and Development, US Environmental
613
Protection Agency.
614
Gironás, J., Roesner, L. A., Rossman, L. A., & Davis, J. (2010). A new applications
615
manual for the Storm Water Management Model (SWMM). Environmental Modelling
616
& Software, 25(6), 813–814.
617
Gomez-Ullate, E., Castillo-Lopez, E., Castro-Fresno, D., & Bayon, J. R. (2011). Analysis
618
and contrast of different pervious pavements for management of storm-water in a
619
parking area in Northern Spain. Water resources management, 25(6), 1525-1535.
620
Gregoire, B. G., & Clausen, J. C. (2011). Effect of a modular extensive green roof on
621
stormwater runoff and water quality. Ecological Engineering, 37(6), 963-969.
622
Hanak, E., & Lund, J. R. (2012). Adapting California’s water management to climate
623
change. Climatic Change, 111(1), 17-44.
624
Horton, R. E. (1933). The role of infiltration in the hydrologic cycle. Eos, Transactions
625
American Geophysical Union, 14(1), 446-460.
626
Hsu, M. H., Chen, S. H., & Chang, T. J. (2000). Inundation simulation for urban drainage
627
basin with storm sewer system. Journal of Hydrology, 234(1), 21-37.
628
Hunt, W. F., Jarrett, A. R., Smith, J. T., & Sharkey, L. J. (2006). Evaluating bioretention
629
hydrology and nutrient removal at three field sites in North Carolina. Journal of
630
Irrigation and Drainage Engineering, 132(6), 600-608.
631
Huber, W. C. (2001). New options for overland flow routing in SWMM. Urban drainage
632
modeling, 22-29.
633
Huber, W. C., & Cannon, L. (2002). Modeling non-directly connected impervious areas in
634
dense neighborhoods. In Proc. 9th Int. Conf. Urban Drainage-Global Solutions for
635
Urban Drainage.
Jacobson, C. R. (2011). Identification and quantification of the hydrological impacts of
637
imperviousness in urban catchments: A review. Journal of Environmental
638
Management, 92(6), 1438–1448.
639
Jarden, K. M., Jefferson, A. J., Grieser, J. M. (2016). Assessing the effects of catchment
640
scale urban green infrastructure retrofits on hydrograph characteristics. Hydrological
641
Processes, 30, 1536–1550.
642
Ji, S. and Qiuwen, Z. (2015). A GIS-based Subcatchment Division Approach for SWMM.
643
The Open Civil Engineering Journal, 9, 515–521.
644
Juan, A., Hughes, C., Fang, Z., & Bedient, P. (2016). Hydrologic Performance of
645
Watershed-Scale Low-Impact Development in a High-Intensity Rainfall Region.
646
Journal of Irrigation and Drainage Engineering, 04016083.
647
Krebs, G., Kokkonen, T., Valtanen, M., Koivusalo, H., Setälä, H. (2013). A high resolution
648
application of a stormwater management model (SWMM) using genetic parameter
649
optimization. Urban Water Journal, 10(6), 394-410.
650
Lee, J. G., & Heaney, J. P. (2003). Estimation of urban imperviousness and its impacts on
651
storm water systems. Journal of Water Resources Planning and Management, 129(5),
652
419-426.
653
Lee, J. G., Selvakumar, A., Alvi, K., Riverson, J., Zhen, J. X., Shoemaker, L., & Lai, F. H.
654
(2012). A watershed-scale design optimization model for stormwater best
655
management practices. Environmental Modelling & Software, 37, 6-18.
656
Lee, J. M., Hyun, K. H., & Choi, J. S. (2013). Analysis of the impact of low impact
657
development on runoff from a new district in Korea. Water Science and Technology,
658
68(6), 1315-1321.
659
Liu, Y., Cibin, R., Bralts, V. F., Chaubey, I., Bowling, L. C., & Engel, B. A. (2016).
660
Optimal selection and placement of BMPs and LID practices with a rainfall-runoff
661
model. Environmental Modelling & Software, 80, 281-296.
662
Loperfido, J. V., Noe, G. B., Jarnagin, S. T., & Hogan, D. M. (2014). Effects of distributed
663
and centralized stormwater best management practices and land cover on urban
664
stream hydrology at the catchment scale. Journal of Hydrology, 519, 2584-2595.
Mancipe-Munoz, N. A., Buchberger, S. G., Suidan, M. T., & Lu, T. (2014). Calibration of
666
rainfall-runoff model in urban watersheds for stormwater management assessment.
667
Journal of Water Resources Planning and Management, 140(6), 05014001.
668
Martin-Mikle, C. J., de Beurs, K. M., Julian, J. P., Mayer, P. M. (2015). Identifying priority
669
sites for low impact development (LID) in a mixed-use watershed. Landscape and
670
Urban Planning, 140, 29-41.
671
Martz L W, Garbrecht J. (1992). Numerical definition of drainage network and
672
subcatchment areas from digital elevation models. Computers & Geosciences, 18(6):
673
747-761.
674
Mejía, A. I., & Moglen, G. E. (2010). Impact of the spatial distribution of imperviousness
675
on the hydrologic response of an urbanizing basin. Hydrological Processes, 24(23),
676
3359-3373.
677
MoHURD, Ministry of Housing and Urban-Rural Development. Technical Guide for
678
Sponge Cities-Construction of Low Impact Development (For Trial Implementation);
679
2014.
680
http://www.mohurd.gov.cn/zcfg/jsbwj_0/jsbwjcsjs/201411/W020141102041225.pdf
681
Pauleit, S., Ennos, R., Yvonne Golding, Y., (2005). Modeling the environmental impacts
682
of urban land use and land cover change-a study in Merseyside, UK. Landscape and
683
Urban Planning, 71(2-4): 295–310.
684
Peterson, E. W., & Wicks, C. M. (2006). Assessing the importance of conduit geometry
685
and physical parameters in karst systems using the storm water management model
686
(SWMM). Journal of hydrology, 329(1), 294-305.
687
Pomeroy, C.A., (2007). Evaluating the impacts of urbanization and stormwater
688
management practices on stream response. PhD thesis. Fort Collins: Colorado State
689
University.
690
Pyke, C., Warren, M.P., Johnson, T., LaGro, J., Scharfenberg, J., Groth, P., Freed, R.,
691
Schroeer, W. and Main, E., (2011). Assessment of low impact development for
692
managing stormwater with changing precipitation due to climate change. Landscape
693
and Urban Planning, 103(2), 166-173.
Rosa, D. J., Clausen, J. C., & Dietz, M. E. (2015). Calibration and verification of SWMM
695
for low impact development. Journal of the American Water Resources Association,
696
51(3), 746-757.
697
Rosenberg, E. A., Keys, P. W., Booth, D. B., Hartley, D., Burkey, J., Steinemann, A. C., &
698
Lettenmaier, D. P. (2010). Precipitation extremes and the impacts of climate change
699
on stormwater infrastructure in Washington State. Climatic Change, 102(1-2),
700
319-349.
701
Rossman, L A. (2010). Storm water management model user's manual, version 5.0.
702
National Risk Management Research Laboratory, Office of Research and
703
Development, US Environmental Protection Agency.
704
Roy, A. H., Shuster, W. D. (2009). Assessing impervious surface connectivity and
705
applications for watershed management. Journal of the American Water Resources
706
Association, 45(1), 198-209.
707
Scholz, M., Grabowiecki, P. (2007). Review of permeable pavement systems. Building
708
and Environment, 42(11), 3830-3836.
709
Sheng, J., Wilson, P.J., 2009. Watershed urbanization and changing flood behavior across
710
the Los Angeles metropolitan region. Nature Hazards, 48: 41–57.
711
Shuster, W. D., Bonta, J., Thurston, H., Warnemuende, E., & Smith, D. R. (2005). Impacts
712
of impervious surface on watershed hydrology: a review. Urban Water Journal, 2(4),
713
263-275.
714
Shuster, W., Rhea, L. (2013). Catchment-scale hydrologic implications of parcel-level
715
stormwater management (Ohio USA). Journal of Hydrology, 485, 177–187.
716
Sohn, W., Kim, J. H., & Li, M. H. (2017). Low-impact development for impervious
717
surface connectivity mitigation: assessment of directly connected impervious areas
718
(DCIAs). Journal of Environmental Planning and Management, 1-19.
719
Urrutiaguer, M., Rossrakesh, S., Potter, M., Ladson, A., Walsh, C. J. (2012). Using directly
720
connected imperviousness mapping to inform stormwater management strategies. In
721
WSUD 2012: Water sensitive urban design; Building the water sensitive community;
722
7th international conference on water sensitive urban design (p. 314). Engineers
723
Australia.