International Journal of Emerging Technology and Advanced Engineering
Website: www.ijetae.com (ISSN 2250-2459, ISO 9001:2008 Certified Journal, Volume 4, Issue1, January 2014)
238
Object Detection with Saliency Space for Low Depth of Field
Images Using Graph Cut Method
H.P.Narkhede
1, Prof. P.M. Mahajan
21M.E.(2nd year student), 2Associate Professor, J.T.Mahajan College Of Engineering, Faizpur, India
Abstract— The graph cut based approach has become very popular for interactive segmentation of the object -of-interest from the background. Content-based multimedia application plays an important role on automatic segmentation of images with low depth of field (DOF).Graph cut method, separate the important objects (i.e. interest regions) of a given image from its defocused background using novel cluster ensemble algorithm and minimal graph cut is constructed using object and background seeds which is based on the max-flow method. The multi-scale reblurring model is used to detect the object-of-interest (OOI) in saliency space. A global energy item related with the saliency map adopted to find the global minimum and a local energy term regarding the low DOF images is used to improve the segmentation precision. Various experiments are performed which shows an average segmentation performance of 97.35% on the 117 test images to extract the ROF in an image.
Keywords— graph cut optimization, image segmentation, low depth-of-field, multi-scale reblurring model, unsupervised segmentation.
I. INTRODUCTION
In the recent years, more and more attention has been drawn on image segmentation[1-5] because of rapid development of image analysis application and machine vision. Image segmentation partition an image into a finite number of non-overlapping regions, pixels is in the same region having a certain degree and share coherent properties such as color, intensity, or texture[1-2]. In the past few years, research work[3-5] has focused on image segmentation with respect to simple features. Interest region based compression [6], focus tracking in video, image target searching and video target indexing [7], image indexing, are the applications of automatic segmentation of interest regions (i.e. attention objects) in low depth-of-field (DOF) images provides valuable information for a number of attention-driven multimedia. In this paper, low DOF images are considered and to extract the interest regions from low DOF images proposed by novel unsupervised approach. Many techniques proposed to segment a low DOF image [8-12].
D.M. Tsai et al[8]use moment preserving principle ,the
amount of blur/defocus in an object boundary is evaluated by developing an edge-based approach. The average intensity of image regions to detect the sharply focused
objects in a few low DOF images and J. Z. Wang et al[9]
proposed a fast multi resolution method based on high
frequency energy .Expectation-Maximization (EM)
algorithm is based on an iterative optimization of the centers and widths of the kernels[13-15]. To find the maximum likelihood parameters of a statistical model in cases where the equations cannot be solved directly is such cases the EM algorithm[13]-[15] is used. The aim is to optimize the likelihood that the given data points are generated by a mixture of Gaussians. The next numbers to the Gaussians[16] give the relative importance (amplitude) of each component. In case of a low DOF image[17]-[18], focused areas typically represent important objects in a foreground.
International Journal of Emerging Technology and Advanced Engineering
Website: www.ijetae.com (ISSN 2250-2459, ISO 9001:2008 Certified Journal, Volume 4, Issue1, January 2014)
239 Object detection plays a critical part in numerous applications such as image auto-annotation, image search and scene understanding however due to the complexity of object classes and images it is still an open problem. In Saliency space, each pixel in this map is assigned with a measure of ―relevance" or ―importance" so that it reflect the degree to which a region in the image is attractive to visual attention. There is vast literature in computer science and computer vision.In region of interest extraction [25], segmentation [26], tracking [27], object detection [28], thumbnailing [29] and image retrieval and classification [30] are the many areas in which the application research generated on the visual saliency. The visual saliency computation can be effected in a bottom-up manner[31]-[34]. A computational framework for visual saliency which decomposes visual input into component feature maps proposed by Itti et al. [32]. Alter and Basri used image edges to construct the saliency map. The work of Shaashua A et al is in line with the common approach to model contour or curve saliency[36], where length and smoothness of the edge points are often used [36]-[37]. Navalpakkam et al [38] proposed a method to maximise the signal-to-noise ratio between the mean salience of the target and that of the distractor. Berengolts et al[37] also proposed a method to recover the distribution of the edge lengths and curvature on the region corresponding to the target of interest making use of labelled objects. Saliency maps were computed as a linear combination of features whose weights were recovered through a linear regression model applied to manually labeled images shown in Lie et al[39]. Liu et al. formulated the saliency detection problem as a region of interest segmentation task where learning is performed via a conditional random field[39]. A region of interest (often abridged ROI), is a preferred subset of samples within a dataset identified for a particular purpose.
The segmentation details and object detection process based on the proposed approach in this paper are organizes as follows. In section II, the methodology is described. The proposed algorithm explained section III. The experimental result and discussions are provided in the section IV. Paper in concluded in section V.
II. METHODOLOGY
For the image segmentation of photo images three methods used which perform the functions as EM algorithm with Gaussian distribution function which removes the noise by Gaussian filter.
After removal of the noise that preprocessed image, graph cut method is applied to cut image and bipartition it. Object detection with multiscale reblurring model to get saliency map.
2.1 EM Algorithm
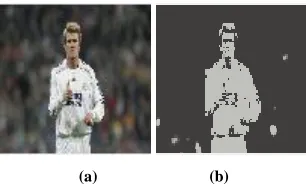
In low DOF image,focused areas represent important objects in a foreground. Generally, these areas include object of interest and possibly some focused regions in the background which are informative and mostly relevant to the object in the foreground. The proposed segmentation approach includes two main stages. In the first stage, local regions in an image are clustered into three groups which can be used to differentiate the object-of-interest, i.e., region of interest (ROI), from the background at the level of block size. This grouping is achieved by a two-level based cluster ensemble approach and provided by using the grayscale component of the original color image. In stage two, we construct a graph cuts model and then employ the optimization algorithm [40] to minimize the graph cuts problem which results a corresponding segmentation. The Expectation-Maximization algorithm by using Gaussian distribution function removes the noise of the color images which are used for image segmentation.
[image:2.612.367.520.413.505.2](a) (b)
Figure 1. An example of low DOF image segmentation. (a)original low DOF image out of 117 testimages. (b)image preprocessed image using
EM algorithm without noise.
The expectation-maximization (EM) algorithm [41] for Gaussian mixture modeling[42] is engaged to partition a set
of region descriptors into groups.
2.2 Graph Cut Based Segmentation
In the undirected ,weighted graph G=(V,E). Remove a subset of edges to partition the graph into two disjoint sets of vertices A,B (two subgraphs[42]).
Each cut corresponds to some cost(cuts) as some of the weights for the edges that have been removed.
International Journal of Emerging Technology and Advanced Engineering
Website: www.ijetae.com (ISSN 2250-2459, ISO 9001:2008 Certified Journal, Volume 4, Issue1, January 2014)
[image:3.612.107.222.143.256.2]240
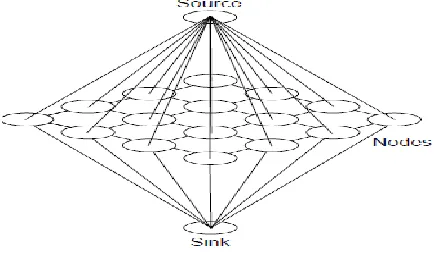
Figure 2. A Graph cut
Let the Source and the sink noted as s and t be two of the vertices in V respectively. Then, V=M U {s,g}. Each vertex in M is connected to all neighboring vertices in M by a bi- directional edge called an n-link(neighbor link).Each cut corresponds to some cost(cuts) as some of the weights for the edges that have been removed.
Each vertex in M is also connected to each of the terminals by uni-directional edges called t-links (terminal links). One set of terminal link goes from the source vertex to all vertices in M, and one set of t-links goes from all vertices in M to the sink. Each edge of the weighted graph has a non-negative weight, also called a capacity.
To segment an image, each pixel in the image has its own vertex. These vertices form the group of vertices M. Each vertex in M is associated to each adjacent vertex by an n-link. The neighborhood of a vertex is based on the neighborhood of that vertex's equivalent pixel. Each vertex in M can be linked to either four neighbors or eight neighbors, depending on the connectedness of the graph. Each vertex in M is then associated to together the source and sink vertices via t-links. An example of a two dimensional image graph of this type can be seen in Figure 3.
Figure 3. An example of a 4x4 graph.
[image:3.612.344.549.294.401.2]In theory of optimization, the max-flow min-cut[43-44] theorem states that in a flow system, the maximum quantity of flow passing from the source to sink is equal to the minimum capacity that when removed in a specific way from the network causes the situation that no flow can pass from the source to the sink. One of the oldest algorithms for dividing networks into parts is the minimum-cut method. In the minimum-cut method, the network is divided into a predetermined number of parts, usually of about the same size, chosen such that the number of edges between groups is minimized and variants such as ratio cut and normalized cut[5].Figure 4 shows case where minimum cut gives a bad partition.
Figure 4. A case where minimum cut gives a bad partition.
Weight of an edge can be calculated as the similarities between two nodes in a graph so, if there are no similarities in between two nodes then we can cut that edge this is called graph cut. Each of the graph having number of pixel nodes. Each of the pixel is normalized. Weight matrix w and diagonal matrix D of the size of (MN)-by-(MN). Weight Matrix W is the similarity matrix with element Wi,j as the similarity between ith pixel and jth pixel.
The matrix D is a diagonal matrix and each diagonal element d contains thesum of all the elements in the i th row in W. With these two matrices, finding theminimum normalized cut of image V into two parts A and B is equal to solve the equation as-
minNcut = miny
Where y is an (M by N) vector with each element indicating the attribute of each pixel into the two groups. In above equation, the value y has all the real values then above equation is simplified into a general eigenvector problem solved.
[image:3.612.54.271.543.672.2]International Journal of Emerging Technology and Advanced Engineering
Website: www.ijetae.com (ISSN 2250-2459, ISO 9001:2008 Certified Journal, Volume 4, Issue1, January 2014)
241 The eigenvector y with the second smallest eigenvalue is selected for the image segmentation. If the element values in y has all real numbers, On the basis of the eigenvector by taking the signs into consideration which divide the image into segmentation. Eigenvector is the second smallest eigenvalues because in the above equation. Eigen values and eigenvectors are used to find the weight matrix. Finding the weight matrices for all the edges in an image we need to represent all the weights of the image into a matrix. And that is called the weight matrix. After finding the weight matrix the diagonal matrix is calculated. For that add each row in the weight matrix and then by presenting them in a single column,here diagoan value can be find out. These values are presented in a diagonal form of matrix with remaining all elements as zeros. So that diagonal matrix obtained.
Di=
Then by using matrices D and W we can find the eigenvalues and eigenvectors. By using the following formula we can find out those eigenvalues and eigenvectors.
(D-W)y= λDy
Then, after discover out the eigenvectors we need to take the eigenvector of the second smallest eigenvalue to divide the region.
2.3 Object Detection With A Multi-Scale Reblurring Model
In computer vision and optical character recognition, the ROI defines the borders of an object under consideration.
Many image analysis and computer vision problems have been expressed as the minimization of global energy functions describing the interactions between the observed data and the image representations to be extracted in a given task. The energy function[43] is minimized over nested subspaces of the original space of probable solutions. These subspaces consist of solutions which are constrained at different scales. Suppose an image is represented by a set of uniform blocks. To extract the details of texture in a block,we exploit the dynamic range of gray levels, i.e. contrast, and the square root of the second order moment of wavelet coefficients, i.e. energy[54]as block descriptors.
Given low DOF images represents a position vector,the goal of unsupervised segmentation is to separate OOI apart from background without human help. For this separation we used space-invarient blurring function,which is usually assumed as the Gaussian function with a blur parameter σh.
An objection detection method based on a reblurring model is proposed to generate a focused saliency map(FSM).The method manages to distinguish focused OOI from defocusing background which is not enough blurry. However, a single small σg will limit the size of Gaussian kernels,resulting in the small values of FSM in these areas[18]. Therefore,some smooth regions in focused OOI will be difficult to be detected,which may leave holes or cavities in the segmentation results.
In order to solve this problem,we proposed a multi-scale method to reblur the original image. It is worth noticing that a small σg to enlarge the size of Gaussian kernel,which aims to expand the difference between reblurred and original images in the areas. So that,in [18], 2D Gabor transformation is adopted. In this paper for object detection process,multi-scale kernels are used to reblur input images. Large-scale kernel is assigned for smooth regions,while sharp areas will choose the small scale.
III. PROPOSES APPROACH ALGORITHM
1. Conversion of RGB image to grayscale.
By removing the color and saturation information while retaining the luminance in the RGB image to grayscale.
2. Compute matrices Weight & Diagonal (W & D)
Using eigenvalues and eigenvectors of normalized cut method, the cut of the graph determine out that means to find out week edges in the image which is grayscale.
3. Solve the equation for getting eigenvectors and smallest eigenvalues.
As per equation stated above,the eigenvalues and eigenvectors are find out.
4. Use the eigenvector with the second smallest eigenvalue to bipartition the graph.
Bipartition the image so that it can be use the eigenvector of the second smallest eigenvalue.
5. Recursively partition the segmented parts if it is necessary.
In Normalized cut method it cut the two parts of the image if it is required to cut.
6. Object detected using multi-scale reblurring model
International Journal of Emerging Technology and Advanced Engineering
Website: www.ijetae.com (ISSN 2250-2459, ISO 9001:2008 Certified Journal, Volume 4, Issue1, January 2014)
242 IV. EXPERIMENTAL RESULTS AND DISCUSSION
This process is implemented on the analysis performance of the proposed approach, several experiments have been carried out by using main database of 117 test images. 117 web images used to perform the experiment and their ground-truth segmentations provided by[58] for this experimental results. The approach has been tested on a 3.00GHz CPU with 2.00GB RAM using MATLAB version R2009a. The F-measure is calculated and defined as
F =
[image:5.612.332.552.280.631.2]Where, Precision= TP/(TP+FP), Recall= TP/(TP+FN). TP,FP and FN denote the number of true postive, false positive and the false negative pixels respectively. The average values of precision, recall and F-measure over 117 test images are computed for this evaluation. We used α = 0.3 in our experiment according to[17].Figure 5 shows the comaparision of average F-measure, precision, recall values for the different unsupervised segmentation methods. Figure 6 illustrate a number of segmentation results obtained by proposed approach. As evident from figure 5 ,the proposed method with 97.35% average F-measure value outperforms existing the ROI in low DOF images, which shows an improvement of 5.65%.
Figure 5 . Segmentation performance comparison between the proposed aprroach and the state-of-art approaches.
Average Computational time results for the 117 test images also calculated.In G.Rafiee et al[17], the averagae computational time for unsupervised learning tested on 117 test images which gives 3.4825 seconds. In this proposed approach, unsupervised learning having average computaional time is 4.056 which is little bit more as compared to the average time calculated by G.Rafiee et al.
Although th eaverage computtaional time required in the proposed approach is higher,but it gives higher experimental result as compared to the results calculated by Rafiee et al. On saliency space and graph cut method,expermiments are performed.In graph cut method,the object is partitioned. In saliency space, the object is to be detected from its background and bourdered as green line. After that final experminetal results obtained as on graph cut method and salieny space. Out of them graph cut method gives higher results as compared to saliency space.For this experiments the 117 test images are referred, and the result of these images are shown as
Figure 6. Original low DOF images and corresponding segmentation[ (a),(f),(k),(p),(u),(z),(ee),(jj),(oo)]is the original low DOF image, [(b),(g),(l),(q),(v),(aa),(ff),(kk),(pp)] image obtained in the processing
of image preprocessing,[(c),(h),(m),(r),(w),(bb),(gg),(ll),(qq)] and [(d),(i),(n),(s),(x),(cc),(hh),(mm),(rr)]partition of images using graph
[image:5.612.49.298.438.627.2]International Journal of Emerging Technology and Advanced Engineering
Website: www.ijetae.com (ISSN 2250-2459, ISO 9001:2008 Certified Journal, Volume 4, Issue1, January 2014)
243 V. CONCLUSIONS
The extraction of the ROI in a low DOF image has been proposed for fast unsupervised segmentation approach. The
first stage identifies object and background blocks by
using a two-level statistical ensemble clusteringtechnique.
As a result, the hard constraints for a graph cut model are
achieved. On the other hand, a graph cut model of image
pixels is firstly constructed. Then, the graph isoptimized to
extract the underlying region shape and theboundary of the
object. In the second method, saliency space is detected with the help of multi-scale reblurring model of focused OOIs.Gabor transformation smoothen the curve of the
object and the background and a weight variable helps the
curves evolve more quickly and accurately to the real boundary of OOI.
Experimental results demonstrate an average
segmentation performance of 97.35% on the 117 test images to extract the ROF in an image. Morever,the time required for the performance is little bit more than the existing unsupervised approach on a same platform but the average segmentation performance is higher as compared to the existing unsupervised approach on a same platform.
REFERENCES
[1 ] N. Houhou, J. Thiran, and X. Bresson, ―Fast texture segmentation model based on the shape operator and active contour,‖ in Proc. IEEE Conf.Comput. Vis. Pattern Recognit., Jun. 2008, pp. 1–8. [2 ] P. Puranik, P. Bajaj, A. Abraham, P. Palsodkar, and A. Deshmukh,
―Human perception-based color image segmentation using comprehensive learning particle swarm optimization,‖ in Proc.2nd Int. Conf. Emerging Trends Eng. Technol., 2009, pp. 630–635. [3 ] S. Belongie, C. Carson, H. Greenspan, and J. Malik, ―Color-and
texturebased image segmentation using EM and its application to content-based image retrieval,‖ in Proc. 6th Int. Conf. Comput. Vis., 1998, pp. 675–682.
[4 ] H. Cheng, X. Jiang, Y. Sun, and J. Wang, ―Color image segmentation: Advances and prospects,‖ Pattern Recognit., vol. 34, no. 12, pp. 2259–2281, 2001.
[5 ] J. Shi and J. Malik, ―Normalized cuts and image segmentation,‖ IEEE Trans. Pattern Anal. Mach. Intell., vol. 22, no. 8, pp. 888–905, Aug. 2000.
[6 ] C. A. Christopoulos, T. Ebrahimi, and A. N. Skodras, "JPEG2000: the new still picture compression standard," in Proceedings of the 2000 ACM workshops on Multimedia Los Angeles, California, United States: ACM, 2000.
[7 ] L. Kovacs and T. Sziranyi, "Image Indexing by Focus Map," in Proc. Seventh Int'l Conf. Advanced Concepts for Intelligent Vision Systems. vol. 3708, 2005, pp. 300-307.
[8 ] D.M. Tsai and H.-J. Wang, "Segmenting focused objects in complex visual images," Pattern Recognition Letters, vol. 19, pp. 929-940, 1998
[9 ] J. Z. Wang, L. Jia, R. M. Gray, and G. Wiederhold, "Unsupervised multiresolution segmentation for images with low depth of field," Pattern Analysis and Machine Intelligence, IEEE Transactions on, vol. 23, pp. 85-90, 2001.
[10 ]C. Kim, "Segmenting a low-depth-of-field image using morphological filters and region merging," Image Processing, IEEE Transactions on, vol. 14, pp. 1503-1511, 2005.
[11 ]H. Li and K. N. Ngan, "Unsupervized Video Segmentation With Low Depth of Field," Circuits and Systems for Video Technology, IEEE Transactions on, vol. 17, pp. 1742-1751, 2007.
[12 ]T. Chen and H. Li, "Segmenting focused objects based on the Amplitude Decomposition Model," Pattern Recognition Letters, vol. 33, pp. 1536-1542, 2012.
[13 ]Sundberg, Rolf (1974). "Maximum likelihood theory for incomplete data from an exponential family". Scandinavian Journal of Statistics 1 (2): 49–58. JSTOR 4615553. MR 381110.
[14 ]Rolf Sundberg. 1971. Maximum likelihood theory and applications for distributions generated when observing a function of an exponential family variable. Dissertation, Institute for Mathematical Statistics, Stockholm University.
[15 ]Sundberg, Rolf (1976). "An iterative method for solution of the likelihood equations for incomplete data from exponential families". Communications in Statistics – Simulation and Computation 5 (1): 55–64. doi:10.1080/03610917608812007. MR 443190.
[16 ]Hongwei Guo, "A simple algorithm for fitting a Gaussian function," IEEE Sign. Proc. Mag. 28(9): 134-137 (2011).
[17 ]G. Rafiee, S.S. Dlay, W.L. Woo, Automatic Segmentation of Interest Regions in Low Depth of Field Images Using Ensemble Clustering and Graph Cut Optimization Approaches,IEEE computer society,2010
[18 ]Jiangyuan Mei, Yulin Si, and Huijun Gao, A Curve Evolution Approach for Unsupervised Segmentation of Images With Low Depth of Field , IEEE TRANSACTIONS ON IMAGE PROCESSING, VOL. 22, NO. 10, OCTOBER 2013
[19 ]Y. Boykov and M.-P. Jolly. Interactive graph cuts for optimal boundary and region segmentation of objects in N-D images.In ICCV, 2001
[20 ]Greig, D.M., Porteous, B.T., & Seheult A.H. (1989).Exact maximum a posteriori estimation for binary images. Journal of the Royal Statistical Society Series B, 51, 271-279
[21 ]shi, J., & Malik, J. (2000) ―Normalized cuts and image segmentation.‖IEEE Transactions on Pattern Analysis and Machine Intelligence, 22 (8), 888-905.
[22 ]D. Mohammad Shajib Khadem,‖ MRI Brain image segmentation using graph cuts‖, Thesis for the degree of Master of Science, Department of Signals and Systems,Signal Processing Group,CHALMERS UNIVERSITY OF TECHNOLOGYGoteborg, Sweden, Oct., 2010
[23 ]P. Kohli and P. H. S. Torr. Efficiently solving dynamic Markov random fields using graph cuts. In ICCV, 2005.
[24 ]Felzenszwalb, P.F., & Huttenlocher, D.P. (1998). Image segmentation using local variation. IEEE Computer Society Conference on Computer Vision and Pattern Recognition, pp. 98-104.
[25 ]Liu, T., Sun, J., Zheng, N.N., Tang, X., Shum, H.Y.: Learning to detect a salient object. In: Proceedings of the IEEE Conference on Computer Vision and Pattern Recognition. (2007) 1-8
International Journal of Emerging Technology and Advanced Engineering
Website: www.ijetae.com (ISSN 2250-2459, ISO 9001:2008 Certified Journal, Volume 4, Issue1, January 2014)
244 [27 ]Li, H., Ngan, K.N.: Saliency model-based face segmentation and
tracking in headand-shoulder video sequences. Journal of Visual Communication and Image Representation 19 (2008) 320-333 [28 ]Papageorgiou, C., Poggio, T.: A trainable system for object
detection. International Journal of Computer Vision 38 (2004) 15-33 [29 ]Marchesotti, L., Cifarelli, C., Csurka, G.: A framework for visual
saliency detection with applications to image thumbnailing. In: Proceedings of the IEEE International Conference on Computer Vision. (2009)
[30 ]Kadir, T., Brady, M.: Saliency, scale and image description. International Journal of Computer Vision 45 (2001) 83-105 [31 ]Koch, C., Ullman, S.: Shifts in selective visual attention: Towards
the underlying neural circuitry. Human Neurobiology 4 (1985) 219-227
[32 ]Itti, L., Koch, C., Niebur, E.: A model of saliency-based visual attention for rapid scene analysis. IEEE Transactions on Pattern Analysis and Machine Intelligence 20 (1998) 1254-1259
[33 ]Harel, J., Koch, C., Perona, P.: Graph-based visual saliency. In: Proceedings of Neural Information Processing Systems. (2007) 545-552
[34 ]Rosin, P.L.: A simple method for detecting salient regions. Pattern Recognition 42 (2009) 2363-2371
[35 ]Alter, T., Basri, R.: Extracting salient curves from images: An analysis of the saliency network. International Journal of Computer Vision 27 (1998) 51-69
[36 ]Shaashua A., Ullman, S.: Structural saliency: The detection of globally salient structures using locally connected network. In: Proceedings of International Conference on Computer Vision. (1988) 321-327
[37 ]Berengolts, A., Lindenbaum, M.: On the distribution of saliency. IEEE Transactions on Pattern Analysis and Machine Intelligence 28 (2006) 1973-1990
[38 ]Navalpakkam, V., Itti, L.: Search goal tunes visual features optimally. Neuron 53 (2007) 605-617
[39 ]Vincent, B., Troscianko, T., Gilchrist, I.: Investigating a space-variant weighted salience account of visual selection. Vision Research 47 (2007) 1809-1820
[40 ]Y. Boykov and V. Kolmogorov, "An experimental comparison of min-cut/max- flow algorithms for energy minimization in vision," Pattern Analysis and Machine Intelligence, IEEE Transactions on, vol. 26, pp. 1124-1137, 2004.
[41 ]A. P. Dempster, N. M. Laird, and D. B. Rubin, "Maximum Likelihood from Incomplete Data via the EM Algorithm," Journal of the Royal Statistical Society, vol. 34B, pp. 1-38, 1977.
[42 ]David M. Blei, Mixture Models and Expectation-Maximization, March 9, 2012
[43 ]Eugene Lawler(2001). "4.5. Combinatorial Implications of Max-Flow Min-Cut Theorem, 4.6. Linear Programming Interpretation of Max-Flow Min-Cut Theorem". Combinatorial Optimization: Networks and Matroids. Dover. pp. 117–120.
![Figure 6. Original low DOF images and corresponding segmentation[ (a),(f),(k),(p),(u),(z),(ee),(jj),(oo)]is the original low DOF image, [(b),(g),(l),(q),(v),(aa),(ff),(kk),(pp)] image obtained in the processing of image preprocessing,[(c),(h),(m),(r),(w),(bb),(gg),(ll),(qq)] and [(d),(i),(n),(s),(x),(cc),(hh),(mm),(rr)]partition of images using graph cut method,[(e),(j),(o),(t),(y),(dd),(ii),(nn),(ss)] boundary saliency maps based on focused energy map](https://thumb-us.123doks.com/thumbv2/123dok_us/8720323.884010/5.612.332.552.280.631/original-corresponding-segmentation-original-obtained-processing-preprocessing-partition.webp)
