comm
en
t
re
v
ie
w
s
re
ports
de
p
o
si
te
d r
e
se
a
rch
refer
e
e
d
re
sear
ch
interacti
o
ns
inf
o
rmation
Consensus clustering and functional interpretation of
gene-expression data
Stephen Swift
*
, Allan Tucker
*
, Veronica Vinciotti
*
, Nigel Martin
†
,
Christine Orengo
‡
, Xiaohui Liu
*
and Paul Kellam
§
Addresses: *Department of Information Systems and Computing, Brunel University, Uxbridge UB8 3PH, UK. †School of Computer Science and
Information Systems, Birkbeck College, London WC1E 7HX, UK. ‡Department of Biochemistry and Molecular Biology, University College
London, London WC1E 6BT, UK. §Virus Genomics and Bioinformatics Group, Department of Infection, Windeyer Institute, 46 Cleveland
Street, University College London, London W1T 4JF, UK.
Correspondence: Paul Kellam. E-mail: [email protected]
© 2004 Swift et al.; licensee BioMed Central Ltd.
This is an Open Access article distributed under the terms of the Creative Commons Attribution License (http://creativecommons.org/licenses/by/2.0), which permits unrestricted use, distribution, and reproduction in any medium, provided the original work is properly cited.
Consensus clustering and functional interpretation of gene-expression data
<p>Consensus clustering, a new method for analyzing microarray data that takes a consensus set of clusters from various algorithms, is shown to perform better than individual methods alone.</p>
Abstract
Microarray analysis using clustering algorithms can suffer from lack of inter-method consistency in assigning related gene-expression profiles to clusters. Obtaining a consensus set of clusters from a number of clustering methods should improve confidence in gene-expression analysis. Here we introduce consensus clustering, which provides such an advantage. When coupled with a statistically based gene functional analysis, our method allowed the identification of novel genes regulated by NFκB and the unfolded protein response in certain B-cell lymphomas.
Background
There are many practical applications that involve the group-ing of a set of objects into a number of mutually exclusive sub-sets. Methods to achieve the partitioning of objects related by correlation or distance metrics are collectively known as clus-tering algorithms. Any algorithm that applies a global search for optimal clusters in a given dataset will run in exponential time to the size of problem space, and therefore heuristics are normally required to cope with most real-world clustering problems. This is especially true in microarray analysis, where gene-expression data can contain many thousands of variables. The ability to divide data into groups of genes shar-ing patterns of coexpression allows more detailed biological insights into global regulation of gene expression and cellular function.
Many different heuristic algorithms are available for cluster-ing. Representative statistical methods include k-means,
hierarchical clustering (HC) and partitioning around medoids (PAM) [1-3]. Most algorithms make use of a starting allocation of variables based, for example, on random points in the data space or on the most correlated variables, and which therefore contain an inherent bias in their search space. These methods are also prone to becoming stuck in local maxima during the search. Nevertheless, they have been used for partitioning gene-expression data with notable suc-cess [4,5]. Artificial Intelligence (AI) techniques such as genetic algorithms, neural networks and simulated annealing (SA) [6] have also been used to solve the grouping problem, resulting in more general partitioning methods that can be applied to clustering [7,8]. In addition, other clustering meth-ods developed within the bioinformatics community, such as the cluster affinity search technique (CAST), have been applied to gene-expression data analysis [9]. Importantly, all of these methods aim to overcome the biases and local Published: 1 November 2004
Genome Biology 2004, 5:R94
Received: 4 December 2003 Revised: 15 March 2004 Accepted: 13 September 2004 The electronic version of this article is the complete one and can be
maxima involved during a search but to do this requires fine-tuning of parameters.
Recently, a number of studies have attempted to compare and validate cluster method consistency. Cluster validation can be split into two main procedures: internal validation, involving the use of information contained within the given dataset to assess the validity of the clusters; or external validation, based on assessing cluster results relative to another data source, for example, gene function annotation. Internal vali-dation methods include comparing a number of clustering algorithms based upon a figure of merit (FOM) metric, which rates the predictive power of a clustering arrangement using a leave-one-out technique [10]. This and other metrics for assessing agreement between two data partitions [11,12] readily show the different levels of cluster method disagree-ment. In addition, when the FOM metric was used with an external cluster validity measure, similar inconsistencies are observed [13].
These method-based differences in cluster partitions have led to a number of studies that produce statistical measures of cluster reliability either for the gene dimension [14,15] or the sample dimension of a gene-expression matrix. For example, the confidence in hierarchical clusters can be calculated by perturbing the data with Gaussian noise and subsequent reclustering of the noisy data [16]. Resampling methods (bag-ging) have been used to improve the confidence of a single clustering method, namely PAM in [17]. A simple method for comparison between two data partitions, the weighted-kappa metric [18], can also be used to assess gene-expression cluster consistency. This metric rates agreement between the classification decisions made by two or more observers. In this case the two observers are the clustering methods. The
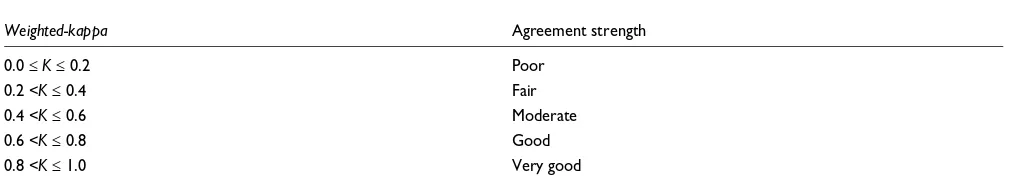
weighted-kappa compares clusters to generate the score
within the range -1 (no concordance) to +1 (complete
con-cordance) (Table 1). A high weighted-kappa indicates that
the two arrangements are similar, while a low value indicates that they are dissimilar. In essence, the weighted-kappa met-ric is analogous to the adjusted Rand index used by others to compare cluster similarity [16,19].
Despite the formal assessment of clustering methods, there remains a practical need to extract reliably clustered genes from a given gene-expression matrix. This could be achieved by capturing the relative merits of the different clustering algorithms and by providing a usable statistical framework for analyzing such clusters. Recently, methods for gene-func-tion predicgene-func-tion using similarities in gene-expression profiles between annotated and uncharacterized genes have been described [20]. To circumvent the problems of clustering algorithm discordance, Wu et al. used five different clustering algorithms and a variety of parameter settings on a single gene-expression matrix to construct a database of different gene-expression clusters. From these clusters, statistically significant functions were assigned using existing biological knowledge.
In this paper, we confirm previous work showing gene-expression clustering algorithm discordance using a direct
measurement of similarity: the weighted-kappa metric.
[image:2.612.55.563.116.211.2]Because of the observed variation between clustering meth-ods, we have developed techniques for combining the results of different clustering algorithms to produce more reliable clusters. A method for clustering gene-expression data using resampling techniques on a single clustering method has been proposed for microarray analysis [19]. In addition, Wu et al. showed that clusters that are statistically significant with respect to gene function could be identified within a database of clusters produced from different algorithms [20]. Here we describe a fusion of these two approaches using a 'consensus' strategy to produce both robust and consensus clustering (CC) of gene-expression data and assign statistical significance to these clusters from known gene functions. Our method is different from the approach of Monti et al., in that different clustering algorithms are used rather than perturb-ing the gene-expression data for a sperturb-ingle algorithm [19]. Our method is also distinct from the cluster database approach of Wu et al [20]. There, clusters from different algorithms were in effect fused if the consensus view of all algorithms indicated that the gene-expression profiles clustered inde-pendently of the method. In the absence of a defined rule base for selecting clustering algorithms, we have implemented Table 1
The weighted-kappa guideline
Weighted-kappa Agreement strength
0.0 ≤ K ≤ 0.2 Poor
0.2 <K ≤ 0.4 Fair
0.4 <K ≤ 0.6 Moderate
0.6 <K ≤ 0.8 Good
comm
en
t
re
v
ie
w
s
re
ports
refer
e
e
d
re
sear
ch
de
p
o
si
te
d r
e
se
a
rch
interacti
o
ns
inf
o
rmation
clustering methods from the statistical, AI and data-mining communities to prevent 'cluster-method type' biases. When consensus clustering was used with probabilistic measures of cluster membership derived from external validation with gene function annotations, it was possible to accurately and rapidly identify specific transcriptionally co-regulated genes from microarray data of distinct B-cell lymphoma types [21].
Results
Cluster method comparison
Initially we assessed cluster method consistency for HC, PAM, SA and CAST using the weighted-kappa metric and a synthetic dataset of 2,217 gene-expression profiles over 100 time points that partitioned into 40 known clusters. The weighted-kappa values derived from the metric indicate the strength of agreement between two observers (Table 1). To interpret two weighted-kappa scores, for example, from two cluster arrangements, the broad categories from Table 1 are used, together with an assessment of relative score differ-ences. If the two scores in question were 0.2 and 0.4, one could say that the former is poor (worse) and the latter is fair (better), but not that one is twice as good as the other. To allow defined clusters to be extracted from the tree structure of HC we used the R statistical package [22] implementation of HC. This implementation uses the CUTTREE method to convert the tree structure into a specified number of clusters.
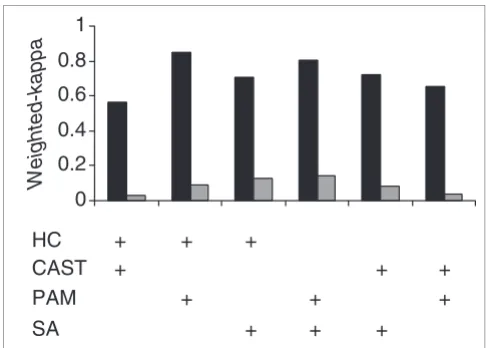
With the synthetic dataset, all clustering algorithms had a 'high' weighted-kappa agreement (data not shown) [18]. It is possible that the highly stylized nature of synthetic data resulted in higher than expected cluster-method agreement compared to experimentally derived data. This effect has been observed previously [10,12]. Therefore, we used a repeated microarray control element Amersham Score Card (ASC) dataset as a semi-synthetic validation standard. We also used an experimentally derived microarray dataset for cross-cluster-method comparison. To facilitate cross-method comparison, we used fixed parameters where appropriate (see Materials and methods). Consistent with other studies, we observed that clustering-method consistency varied between methods and datasets (Figure 1). As expected, the repeated gene/probe measurements present in the ASC data-set resulted in higher levels of cluster agreement between methods than the single gene probe B-cell data. With the ASC data there was in general a 'good' level of agreement between all different clustering algorithms, with only CAST compared to HC scoring as 'moderate'. This shows that most clustering methods are able to group highly correlated data accurately, and that repeated measurements of gene-expression values can aid cluster partitioning [12]. Nevertheless, even with such high gene-expression correlation not all cluster assignments were consistent. This effect is magnified with the single probe per gene B-cell lymphoma data, where the degree of agree-ment for cluster partitioning was less, with no comparison scoring above 'fair'. This observation emphasizes the need for
the current desired practice in microarray analysis of using many different clustering algorithms to explore gene-expres-sion data, thereby not over-interpreting clusters on the basis of a single method [23].
Algorithms
The partial agreement of the different clustering algorithms must reflect the clustering of highly similar gene-expression vectors regardless of the clustering methods used. Where algorithm-based inconsistency problems occur in other aspects of computational biology, such as protein secondary structure prediction, consensus algorithms are often used [24]. These can either report a full or a majority agreement. This consensus strategy has also been applied to explore the effect of perturbing the gene-expression data for a single clus-tering algorithm [19]. We have therefore designed a similar strategy to identify the consistently clustered gene-expression profiles in microarray datasets by producing a consensus over different clustering methods for a given parameter set (see Materials and methods). Extracting such consistently clus-tered robust data from a large gene-expression matrix is extremely useful, increasing overall analysis confidence.
Robust clustering
[image:3.612.312.555.85.259.2]We initially developed an algorithm called robust clustering (RC) for compiling the results of different clustering methods reporting only the co-clustered genes grouped together by all the different algorithms - that is, with maximum agreement across clustering methods. For two genes i and j, all clustering methods must have allocated them to the same cluster in order for them to be assigned to a robust cluster. This gives a Pairwise comparison of consistency between different cluster algorithm data partitions using the weighted-kappa metric (Table 1) to score similarity Figure 1
Pairwise comparison of consistency between different cluster algorithm data partitions using the weighted-kappa metric (Table 1) to score similarity. Each clustering algorithm was used to analyze the Amersham Score Card dataset (black bars) and the B-cell lymphoma dataset (gray bars), and the cluster-method agreement based on assigning the same genes to the same cluster was calculated and scored. HC, hierarchical clustering; CAST, cluster affinity search technique; PAM, partitioning around medoids; and SA, simulated annealing.
Weighted-kappa
HC
+
+
+
SA
+
+
+
PAM
+
+
+
CAST
+
+
+
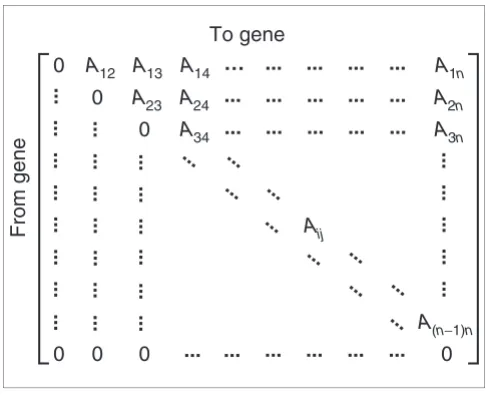
higher level of confidence to the correct assignment of genes appearing within the same cluster. Robust clustering works by first producing an upper triangular n × n agreement matrix with each matrix cell containing the number of agreements among methods for clustering together the two variables, rep-resented by the row and column indices (Figure 2). This matrix is then used to group variables on the basis of their cluster agreement (present in the matrix).
Robust clustering uses the agreement matrix to generate a list, List, which contains all the pairs where the appropriate cell in the agreement matrix contains a value equal to the number of clustering methods being combined (that is, full agreement). Starting with an empty set of robust clusters RC,
where RCi is the ith robust cluster, the first cluster is created
containing the elements of the first pair in List. Then the pairs in List are iterated through and checked to see if one of the members of the current pair is within any of the existing
clus-ters, RCi.
If one element of the current pair is found and the other ment of the pair is not in the same cluster, then the other ele-ment is added to that cluster. If neither eleele-ment of the pair is
found in an existing RCi in RC, then a new cluster is added to
RC containing each element of the pair. When the end of the list is reached, the set of robust clusters, RC, is the output. The robust clustering algorithm is as follows:
Input:Agreement Matrix (n × n), A
(1) Set List = all pairs (x, y) in the matrix, with agreement = the number of methods
(2) Set RC to be an empty list of clusters
(3) Create a cluster and insert the two ele ments (x, y) of the first pair in List into it
(4) For i = 2 to size of List-1
(5) For j = 1 to number of Clusters in RC
(6) If x or y of Listi is found within RCj
(7) If the other member of the pair Listi
is not found in RCj
(8) Add the other member to RCj
(9) End If
(10) Else If the other member of the pair
Listi is not found in RCj
(11) Add a new cluster to RC containing x
and y
(12) End If
(13) End For
(14) End For
Output:Set of Robust Clusters RC
Application of robust clustering
Robust clustering was applied to both the ASC and B-cell lym-phoma datasets and the partitioning of the gene-expression profiles observed. As expected, the robust clusters do not con-tain all variables because of the underlying lack of consistent clustering by all methods. As a result, the weighted-kappa cannot be calculated. This metric requires both clustering arrangements being compared to be drawn from the same set of items. This is not the case with robust clustering because many items will not be assigned to a cluster. However, approximately 80% of the total ASC data variables and 25% of the B-cell lymphoma variables are assigned to a robust clus-ter. Robust clustering further subdivides the datasets into smaller clusters, with 24 rather than 13 clusters being defined for ASC, and 154 rather than 40 being defined for the B-cell lymphoma data (Table 2). Robust clusters are therefore valu-able for allowing a rapid 'drilling down' in a gene-expression dataset to groups of genes whose coexpression pattern is identified in a manner independent of cluster method. A visual representation of the agreement matrix used as input to robust
[image:4.612.56.299.85.283.2]and consensus clustering Figure 2
A visual representation of the agreement matrix used as input to robust and consensus clustering. The n × n matrix is upper triangular. Each cell within the matrix, referenced by column i and row j, represents the number of clustering methods that have placed gene i and gene j into the same cluster. In other words, the number represents the agreement between clustering methods concerning gene i and gene j.
To gene
From gene
0
0
0
0
0
0
0
A
(n−1)nA
ijA
3nA
34A
2nA
24A
23A
1nA
14A
13A
12…
...
...
...
...
...
...
...
...
...
...
...
...
...
...
...
...
...
...
...
...
...
...
...
...
...
...
...
...
...
...
...
...
...
...
...
...
...
...
...
...
...
...
...
...
...
...
...
...
...
...
...
...
...
...
comm
en
t
re
v
ie
w
s
re
ports
refer
e
e
d
re
sear
ch
de
p
o
si
te
d r
e
se
a
rch
interacti
o
ns
inf
o
rmation
The robust clustering algorithm is, by definition, subject to discarding gene-expression vectors if only one clustering method performs badly in the co-clustering. This effect of sin-gle method under performance on a given dataset has been previously observed for single linkage hierarchical clustering [10,13]. Therefore, to generate clusters with high agreement across methods but not so restrictive as to discard majority consistent variables, we adapted the algorithm to generate consensus clusters, making use of the same agreement matrix.
Consensus clustering
Consensus clustering relaxes the full agreement requirement by taking a parameter, 'minimum agreement', which allows different agreement thresholds to be explored. Rather than grouping variables on the basis of full agreement only, con-sensus clustering maximizes a metric, which rewards varia-bles in the same cluster if they have high cluster method agreement and penalizes variables in the same cluster if they have low agreement. Consensus clustering maximizes
agree-ment using the function f(Gi) in Equation (1) to score each
cluster of size si
where A is the agreement matrix, Gij is the jth element of
clus-ter i (Gi) and β is a user-defined parameter (the agreement
threshold), which determines whether the score for the clus-ter is increased or decreased. The score for a clusclus-tering arrangement is the sum of the scores of each cluster, which consensus clustering attempts to maximize.
If β is equal to Min, the minimum value in A, then the
func-tion is maximized when all variables are placed into the same
cluster (that is, a single large cluster). Alternatively, when β is
equal to Max, the maximum value in A, the function is maxi-mized when each variable is placed into its own cluster. Essentially all clusters produced by Consensus Clustering are
scored by f(Gi), rewarding and preserving clusters with high
agreement between members, while penalizing and discard-ing clusters containdiscard-ing low agreement between members. A
value for βshould lie between the minimum and the
maxi-mum agreement so as not to skew the scoring function. A
suit-able value for β is (Max + Min)/2, where Max is the maximum
value in A and Min is the minimum. For a uniformly
distrib-uted agreement matrix, (Max + Min)/2 is the mean value;
therefore we penalize values below the mean agreement and reward above it. For both the ASC and B-cell lymphoma data
β was 2, as Max = 4 (four clustering algorithms giving
com-plete agreement) and Min = 0 (no agreement). In order to maximize the scoring function for consensus clustering, a search over possible cluster membership is needed. There are many methods for performing a search and it was decided that SA was best because it is an efficient search/optimization procedure that does not suffer from becoming stuck in local maxima. The consensus algorithm is as follows:
Input: Agreement Matrix (n × n), A; MaximuNumr
of Clusters sought, m; Number of Iterations,
Iter; Agreement Threshold, InitiaTemperature,
θ0; Cooling Rate, c
(1) Generate a random number of empty clusters (<m)
(2) Randomly distribute the variables (genes)
1..n between the clusters
(3) Score each cluster according to Equation (1)
(4) For i = 1 to Iter do
(5) Either Split a cluster, Merge two clus
ters or Move a variable (gene) from one ran docluster to another
(6) Set ∆f to difference in score according
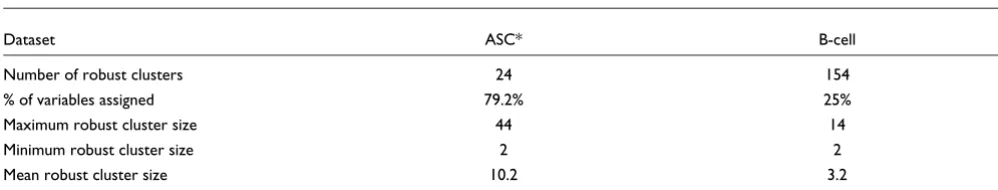
[image:5.612.53.552.112.207.2]to Equation (1) Table 2
Robust clusters
Dataset ASC* B-cell
Number of robust clusters 24 154
% of variables assigned 79.2% 25%
Maximum robust cluster size 44 14
Minimum robust cluster size 2 2
Mean robust cluster size 10.2 3.2
*Amersham Score Card dataset.
f Gi k j AG G s
s
j s
i ij ik
i i
( ) ( ) ,
,
( )
= − >
= = +
−
∑
∑
β1 1 1
1
0
1
(7) If ∆f < 0 Then
(8) Calculate probability, p, according to
Equation (2)
(9) If p > random(0,1) then undo operator
(10) End If
(11) θi = cθi-1
(12) End For
Output:Set of Consensus Clusters
Note that random(0,1) (line 9) returns a random uniformly distributed real number between 0 and 1.
The 'split', 'merge' and 'move' operators (line 5) are as follows and used with equal probability:
Split a cluster:
Input: Cluster g of size n
(1) Randomly shuffle the cluster
(2) Set i to be a random whole number between
1 and n-1
(3) Create two empty clusters g1 and g2
(4) Add elements 1..i of g to g1
(5) Add elements i+1..n of g to g2
Output:Two new clusters g1 and g2
Here the old cluster is deleted and the two new clusters are then added to the set of clusters.
Merge two clusters:
Input: Two Clusters g1 and g2
(1) A new cluster g is created by forming the
union of g1 and g2
Output: A new cluster g
Here the old clusters are deleted and new cluster is then added to the set of clusters.
Move a gene:
Input:A set of clusters G
(1) Two random clusters g1 and g2 are chosen
where the size of g1 is greater than one
(2) A random element of g1 is moved into g2
Output:The updated set of clusters G
The probability (p) (line 8) is calculated by:
In the following experiments we found θ0 = 100, c = 0.99994
and iter = 1,000,000 as the most efficient parameters for SA.
These parameter settings for SA are effectively determined by the iter setting. We denote the change in fitness during the SA
algorithm as ∆f and the starting temperature as θ0 which is
always positive. From equation 2 it can be clearly seen that if
∆f = θ0 then the (worse) solution will be accepted with
proba-bility 0.368 (e-1). As the temperature cools, this probability
will reduce. Here we set θ0 to be the average of ∆f over 1,000
trial evaluations, so that at the beginning of the algorithm, the
average worse solution (∆f = θ0) will be accepted with the
probability stated above.
It can be seen from the consensus algorithm that during the
ith stage of the SA algorithm θ0 = θ0ci. The SA algorithm
works by assuming that the temperature reduces to zero over an infinite number of iterations. As it is not practical to run the SA algorithm to infinity the method is usually terminated after a fixed number of iterations, (iter). At this time the
tem-perature will not be zero, but very small and positive, say ε.
Therefore,
Hence if some small positive value for εis chosen, and the
algorithm is to run for a defined number of iterations (iter), then the decay constant c is calculated as above.
Application of consensus clustering
As consensus clustering relaxes the 'complete agreement' cri-teria we would expect the majority but not necessarily all robust cluster members to be assigned to the same consensus clusters. This was indeed true for the B-cell data where con-sensus clustering of the datasets showed that 98.5% of the B-cell robust clusters were assigned correctly to their respective consensus clusters. With the more consistent ASC data 100% of the robust clusters were assigned to the correct consensus clusters.
p e f f f f
t
=Pr(accept new)= −∆ ,∆ = (old)− (new) ( )
θ 2
ε θ
ε θ =
=
0
0 1 c
c
iter
comm
en
t
re
v
ie
w
s
re
ports
refer
e
e
d
re
sear
ch
de
p
o
si
te
d r
e
se
a
rch
interacti
o
ns
inf
o
rmation
The advantage of consensus clustering over all single-cluster methods was evident when comparing consensus clustering to the mean weighted-kappa score for each pairwise combi-nation of individual clustering algorithms (derived from Fig-ure 1). Comparisons for the ASC dataset (FigFig-ure 3a) and B-cell lymphoma data (Figure 3b) show that consensus cluster-ing improves on all scluster-ingle methods regardless of dataset, except in the case of CAST compared to SA for the ASC data-set (Figure 3a). It is interesting to observe that consensus clustering has higher agreement with SA compared to SA agreement with all other methods in the B-cell data (Figure 3b). The reasons for this are unclear, but suggest that with datasets similar to the B-cell data, SA captures a reliably par-titioned subset of the data. To determine if consensus cluster-ing was consistently superior to the use of scluster-ingle clustercluster-ing methods, particularly the stochastic methods CAST and SA, we performed 10 independent runs of CAST, SA and consen-sus clustering. From the resulting clusters we determined the
mean weighted-kappa scores for 45 possible comparisons
(that is, the number of unique pairs formed from 10 objects = 10 × 9/2) (Table 3). Consensus clustering provided an extremely high degree of consistency over all 10 runs, with a mean weighted-kappa score of 0.96. Importantly, there was little variation between each of the 10 runs with a standard deviation of the mean weighted-kappa of 0.0015. SA had a similar low standard deviation, but produced lower inter-run consistency (mean weighted-kappa of 0.816). CAST was the
least consistent of the methods (mean weighted-kappa of
0.646). The differences in the consensus clustering mean compared to SA and CAST are significant at greater than the 99.9% confidence level, thereby showing consensus cluster-ing identifies a reliable data partition, which is significantly better than multiple runs of single clustering methods.
We wished to confirm that the benefit of consensus clustering was not simply due to the parameter settings chosen for the dataset used. This could be confirmed by extensively varying each algorithm's parameter settings and comparing cluster partitioning using the same dataset; however, the large number of combinations of possible parameter settings between all methods makes this unrealistic. An alternative approach is to compare all methods on additional datasets. We therefore tested consensus clustering on two different simulated datasets containing 60 defined clusters of genes.
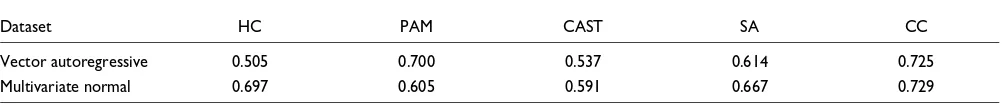
[image:7.612.52.555.120.184.2]The first synthetic dataset was generated from a vector autoregressive process (VAR) and the second using a multivariate normal distribution (MVN). The number of genes in each cluster varied from 1 to 60, with the number of conditions (arrays) set to 20. The datasets therefore con-tained 1,830 genes over 20 conditions. As the structure of Table 3
Multiple runs of the stochastic clustering methods
Method Mean* Min† Max† SD†
CAST 0.646 0.448 0.769 0.092
Simulated annealing (SA) 0.816 0.794 0.838 0.015
Consensus clustering (CC) 0.960 0.922 0.982 0.010
*Mean weighted-kappa scores; †Min (minimum) and Max (maximum) and SD (standard deviation) of the weighted-kappa scores.
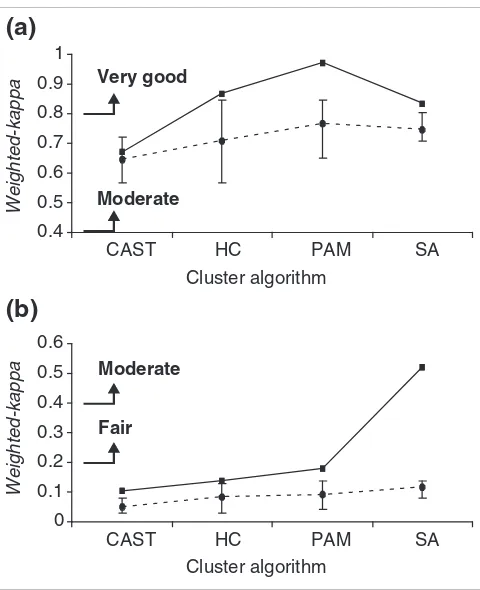
Comparison between consensus clustering and pairwise clustering Figure 3
Comparison between consensus clustering and pairwise clustering. The weighted-kappa score for consensus clustering (solid line) calculated by comparing consensus clusters to the corresponding individual clustering algorithm is shown relative to mean pairwise weighted-kappa score for each single method compared to all other single methods (broken line) for (a) the ASC dataset, (b) the B-cell lymphoma dataset. The maximum and minimum weighted-kappa scores for the collection of single methods are indicated by the error bars. The definitions of weighted-kappa scores are derived from Table 1. The parameter settings for the clustering algorithms are: HC and PAM, 13 clusters for the ASC dataset and 40 for the B-cell dataset; CAST, affinity level 0.5; and SA, θ0 = 100, c = 0.99994 and number
of iterations = 1,000,000.
0 0.1 0.2 0.3 0.4 0.5 0.6
CAST HC PAM SA
Weighted-kappa
Fair Moderate 0.4
0.5 0.6 0.7 0.8 0.9 1
CAST HC PAM SA
Weighted-kappa
Very good
Moderate
Cluster algorithm Cluster algorithm
(a)
[image:7.612.313.553.225.520.2]each dataset is known, the results of each clustering method can be evaluated for accuracy using the weighted-kappa met-ric. Cluster accuracy using the single methods ranged between a kappa of 0.505 to 0.7 (mean weighted-kappa of 0.614) (Table 4). It is interesting to note that the sin-gle clustering methods performed differently on the two syn-thetic datasets, with HC, SA and CAST performing better on the MVN synthetic data and PAM better on the VAR synthetic data. Consensus clustering was superior to all single
cluster-ing algorithms with weighted-kappa scores of 0.725 and
0.729 for VAR and MVN respectively, demonstrating that consensus clustering is accurate regardless of subtleties in the data structure (Table 4).
Interpretation of consensus clustering
Consensus clustering greatly improves the accuracy of identi-fying cluster group membership based solely on the gene-expression vector, but as with other clustering algorithms still produces essentially unannotated clusters which require fur-ther external validation by gene function analysis. To address this problem, we derived a probability score to test the signif-icance of observing multiple genes with known function in a given cluster against the null hypothesis of this happening by chance. This identifies clusters of high functional group sig-nificance, aiding assignment of functions to unclassified genes in the cluster using the 'guilt by association' hypothesis.
The probability score is based on the hypothesis that, if a
given cluster, i, of size si, contains x genes from a defined
functional group of size kj, then the chance of this occurring
randomly follows a binomial distribution and is defined by:
where n is the number of genes in the dataset. As kj and x may
potentially be very large, Pr from the above equation would be difficult to evaluate. Therefore the normal approximation to the binomial distribution can be used as defined by:
Large positive values of z mean that the probability of observ-ing x elements from functional group j in cluster i by chance is very small, (for example z > 2.326 corresponds to a proba-bility less than 1%). Note that we perform a one tailed test as we are only interested in the case where a significantly high number of co-clustered genes belong to the same functional group.
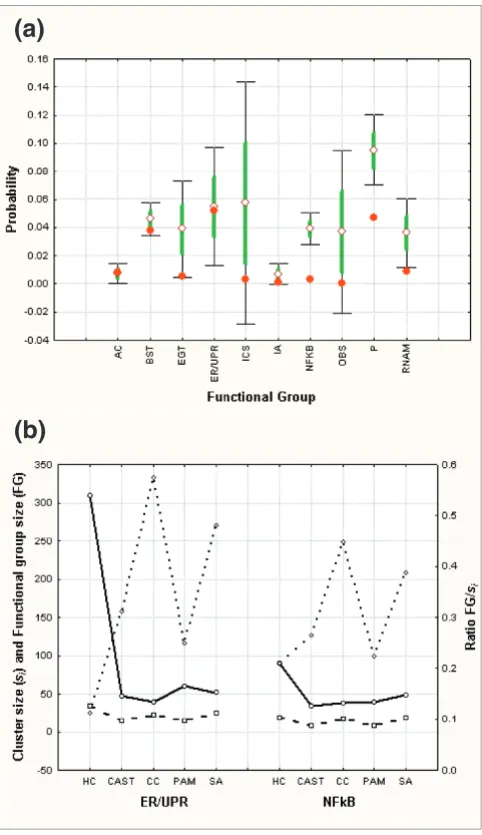
This cluster function probability score was used to identify statistically significant (at the 1% level) B-cell consensus clus-ters containing defined genes known to be associated with 10 functional groups [21]. To determine if consensus clustering was better able to identify important functional group clus-ters we determined the functional group probability scores produced by individual clustering algorithms analogous to the strategy of Wu et al. [20]. For each functional group, the mean lowest probability scores (using Equation (4)) were cal-culated for the signal clustering methods and compared to consensus clustering (Figure 4a). Consensus clustering always produced equivalent or lower probabilities for each functional group, indicating that it produced more informa-tive clusters.
One potential confounding factor in this analysis is that con-sensus clustering achieves a lower probability score by find-ing smaller clusters. This would decrease the ability to associated new genes with a given functional group. In the worst case the number of genes defining a functional group
(FG) would equal the cluster size (si) (FG/si = 1).
Alterna-tively, single clustering methods may produce lower probabil-ity scores by increasing the cluster size, thereby pulling many
genes into the cluster resulting in a FG/si ratio tending
[image:8.612.57.559.118.170.2]towards zero. This would also reduce the usefulness of the clusters. We determined the cluster size and functional group size for two representative functional groups where the con-sensus clustering probability was similar to the single method probability score, namely the endoplasmic reticulum (ER) stress response (also known as the unfolded protein response) (ER/UPR) functional group, or the markedly better Table 4
Cluster partition weighted-kappa scores of two synthetic datasets
Dataset HC PAM CAST SA CC
Vector autoregressive 0.505 0.700 0.537 0.614 0.725
Multivariate normal 0.697 0.605 0.591 0.667 0.729
HC, hierarchical clustering; PAM, partitioning around medoids; CAST, cluster affinity search technique; SA, simulated annealing; CC, consensus clustering.
Pr( )
,
Observing from groupx j k
x p q
p s
n q p
j x k x
i
j =
= = −
( )
−1
3
z x
k p
k pq j
j = −
= =
µ σ µ σ
comm
en
t
re
v
ie
w
s
re
ports
refer
e
e
d
re
sear
ch
de
p
o
si
te
d r
e
se
a
rch
interacti
o
ns
inf
o
rmation
nuclear factor-κB (NFκB) functional group (Figure 4b). Apart
from SA, all single clustering methods tended to produce
larger clusters, thereby decreasing the FG/si ratio. In the most
extreme case of the ER/UPR functional group, the HC cluster size was 310 compared to the consensus clustering size of 40. SA tended to produce similar cluster sizes as consensus
clus-tering but with higher overall probabilities. Therefore, con-sensus clustering identifies significant functional clusters while achieving a workable balance between large or small cluster sizes.
We further investigated the two groups NFκB and ER/UPR to
assess what additional insights consensus clustering allowed. These two functional groups represent important B-cell func-tions at different stages of the B-cell development pathway.
The consensus cluster associated with NFκB also contained
genes either not previously associated with or only tentatively
associated with NFκB activity in subsets of B-cell lymphomas.
The gene-expression profiles from this consensus cluster were visualized by average linkage HC using the programmes Cluster and Treeview [5] (Figure 5) and clustered gene func-tions were investigated further using the annotation resources DAVID [25] and GeneCards [26]. From GeneCards each gene was identified in the complete human genome sequence using Ensembl [27] and 1,000 base pairs (bp) upstream of the predicted transcriptional start site extracted for promoter analysis using the program TESS from the Bay-lor College sequence analysis software BCM [28] (Figure 6).
This consensus cluster is predominantly overexpressed in the cell lines Raji, Pel-B, EHEB, Bonna-12 and L-428. These cell
lines have in common the induction of the NFκB pathway,
either through expression of Epstein-Barr virus LMP-1 pro-tein (Raji, Pel-B, EHEB and Bonna-12) or the loss of function
of the inhibitor of NFκB, namely IκB (L-428). This implies
that many of these genes could be NFκB responsive.
Twenty-four putative promoter regions were analyzed and NFκ
B-binding sites were identified in 12 of these. As expected,
NFκB-binding sites were found in the CD40L receptor gene,
Bfl-1, BIRC3, EBV-induced gene 3 (EBI3), and the genes for
class I MHC-C and lymphotoxin α, as these have been
previ-ously characterized as NFκB responsive and were present in
the initial NFκB-defined gene set. Interestingly, NFκ
B-bind-ing sites were also found in six additional promoters for which accurate mapping of promoter transcription factor
binding is not available (Figure 6a). All but four NFκ
B-ing sites conform precisely to the canonical consensus bind-ing site (Figure 6b) [29,30] and of the variants with T at
position 1, two genes, lymphotoxin α and BIRC3 are known to
be NFκB responsive. Overall, this indicates that the six
addi-tional genes identified are likely to be NFκB responsive.
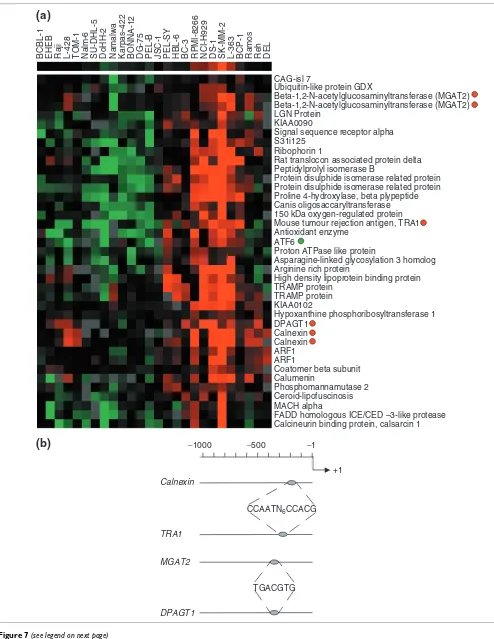
The consensus cluster associated with the ER/UPR functional group contained genes not previously associated with ER stress-induced upregulation. The gene-expression profiles
were visualized and annotated as described for the NFκB
[image:9.612.55.296.85.503.2]functional group (Figure 7a). Annotation showed that of the 32 genes within the ER/UPR consensus cluster (23 defining the original functional group), 16% (5) were involved in cal-cium-ion binding within the ER and 13% (4) were involved with N-glycan biosynthesis. This functional group was over-expressed in cell lines of plasmablast or plasma-cell tumors, Probability scores and cluster size
Figure 4
Probability scores and cluster size. (a) The lowest probability scores determined for clusters containing the following functional group signature genes were identified: AC, actin cytoskeleton; BST, B-cell signal
transduction; EGT, ER/Golgi trafficking; ERUPR, ER stress/unfolded protein response; ICS, immunoglobulin class switching; IA, inflammation and adhesion; NFκB, NFκB signaling; OBS, other B-cell signaling; P, proliferation; RNA, RNA maturation and splicing. The mean (open diamond), standard error (green line) and standard deviation (thin black line and bars) of the minimum probability scores for SA, CAST, HC and PAM are shown together with the minimum probability score for the corresponding consensus cluster (red circle). (b) The cluster size (si) (open circles) and number of defining functional group genes (FG) (open squares) for the NFκB signaling and ER/UPR functional groups are shown together with the FG/si ratio (open diamonds).
(a)
where physiological upregulation of the ER is required for cel-lular function. This process is controlled by two transcription
factors, ATF6 and XBP1 [31]. The ATF6 transcript was
present as a defining signature gene in the ER/UPR func-tional group. This suggests that ATF6 and XBP1 may be responsible for upregulation of the calcium-ion binding and N-glycan biosynthetic genes. Two responsive elements have been defined for ATF6 and XBP1 respectively, the ER stress-response element (ESRE), comprising the binding site
CCAATN9CCACG and the unfolded protein response element
(UPRE), comprising the binding site TGACGTG(G) [32].
[image:10.612.55.558.86.541.2]ATF6 and XBP1 can bind to the CCACG region of ESRE in conjunction with the general transcription factor NF-Y/CB. XBP1 can bind to the UPRE, but ATF6 can only bind to the UPRE when expressed to high (possibly non-physiological) levels [33]. ESRE sites were identified in two of the five cal-cium-ion binding proteins, namely, calnexin and the tumor rejection antigen (gp96) 1(TRA1) (Figure 7b). Interestingly, XBP1 (UPRE) binding sites were identified in two of the N-glycan biosynthetic genes but no ESRE sites were found. This suggests that these two groups of genes are regulated through Visualization of average linkage HC using the programs Cluster and Treeview [5] of the NFκB responsive gene cluster identified from consensus clustering and functional annotation
Figure 5
Visualization of average linkage HC using the programs Cluster and Treeview [5] of the NFκB responsive gene cluster identified from consensus clustering and functional annotation. The sample names correspond to different leukemia and lymphoma samples [21], with the NFκB-responsive gene cluster being predominantly expressed in the cell lines Raji, PEL-B, EHEB, BONNA-12 and L-428. Gene names with red circles represent those genes that contain one or more NFκB-binding sites in the region up to 1,000 bp upstream from the putative transcriptional start site.
Mitogen-activated protein KKK kinase 1 Dedicator of cyto-kinesis 2 (DOCK2) DAP-3
CD40L RECEPTOR PRECURSOR CD40L RECEPTOR PRECURSOR UV radiation resistance associated gene Centrosomal protein 2
Runt-related transcription factor 3 (RUNX3) Dual specificity phosphatase 2
TNFAIP3 interacting protein 1 (Naf1) BCL2-related protein A1 (Bfl-1) B-cell translocation gene 1 (BTG-1) Baculoviral IAP repeat-containing 3 NF kappa B (p105)
Rho G
Lymphotoxin alpha Class II MHC DR beta
Epstein-Barr virus induced gene Class II MHC DO beta
Class II MHC DP beta
Regulator of G-protein signalling (RGS-1) Class II MHC DO alpha
Class II MHC DP alpha Lysyl oxidase
Class I MHC C
Class II MHC DP alpha Class II MHC DR alpha Class II MHC DM alpha Actin (alpha 2)
DNA polymerase subunit delta 4
Mitogen-activated protein kinase 10 (MAPK10) TRAF associated NFKB activator (TANK) Chromosome 6 ORF 9
Cathepsin H
comm
en
t
re
v
ie
w
s
re
ports
refer
e
e
d
re
sear
ch
de
p
o
si
te
d r
e
se
a
rch
interacti
o
ns
inf
o
rmation
two distinct mechanisms by transcription factors ATF6 and XBP1 as a result of ER stress.
Discussion
Grouping data into sets based on a consistent property is a common occurrence in biological analysis. This has recently increased in importance with the production of large micro-array datasets. Implicit in the experimental rationale is the fact that patterns of coexpressed genes should be identifiable in a gene expression matrix and these can be linked to shared biological processes. However, different clustering algorithms are known to partition data into different groups [10-13]. We also observe a similar lack of cluster-method con-cordance using a weighted-kappa metric. This metric effec-tively scores how well different cluster method pairs assign the same genes to the same clusters. The weighted-kappa metric readily shows that, even for highly correlated gene-expression profiles present in the ACS dataset, no two cluster-ing algorithms have complete agreement, although the global search methods such as SA seem to produce the most consist-ent results. Overall this emphasizes that no single analysis
method will identify all patterns in the gene-expression data; therefore multiple analyses should be performed and com-pared [23].
We and others recently described the use of consensus clus-tering to improve confidence [34] or as a re-sampling method for microarray analysis [19]. It was suggested that a natural extension of Monti et al. was to use a meta-consensus across different clustering algorithms rather than to re-sample over the same algorithm. Our results represent this extension and confirm the validity of consensus clustering. We have devel-oped both robust and consensus clustering, with these meth-ods offering specific advantages over the use of individual clustering algorithms for microarray analysis. The robust clustering algorithm is useful for creating clusters of genes with high confidence and is extremely effective for reducing the dimensionality of large gene-expression datasets. How-ever, robust clustering can be restrictive in discarding genes that do not have full agreement. Consensus clustering over-comes this problem, requiring a minimum-agreement parameter to generate clusters based on the combined results of a number of existing clustering methods. This strategy Location and consensus sequence of NFκB-binding sites
Figure 6
Location and consensus sequence of NFκB-binding sites. (a) Position of the NFκB-binding sites identified in the upstream 1,000-bp regions of each gene. The gray ovals represent the position of each binding site shown in (b) where the nucleotide sequence for each respective NFκB-binding site is shown relative to the consensus NFκB-binding site GGGRNNNYCY (R is G or A (purine), Y is T or C (pyrimidine) and N is any nucleotide).
−1000 −500 −1
+1 CD40L receptor
DNA pol delta
RSG-1
PAC1 Bcl2 A1 (Bfl-1)
Class I MHC C
BIRC3
Lymphotoxin α
TNFAIP3 (Naf1) EBI3
TANK
RhoG
Consensus GGGRNNNYCY
C40L receptor (-487) GGGAATTTCC
(-379) GGGAACTTCC
(-81) GGGAAACTCC
DNA pol delta (-269) GGGGCATCCC
RSG-1 (-116) GGGAACTTCC
Bcl2 A1 (Bfl-1) (-833) GGGATTTACC
PAC1 (-963) GGGGATACCC
(-846) GCGGACTTCC
(-788) GGGGCTTTCC
Class 1 MHC C (-183) GGGATTCTCC
TANK (-30) TGGAAGTTCC
BIRC3 (-202) TGGAAATCCC
Lymphotoxin (-475) TGGAAAGTCC
(-86) GGGGCTTCCC
EBI3 (-297) GGGGTTTCCC
(-34) GGGCTTTCCC
TNFAIP3 (Naf1) (-355) TGGAATCCCC
(-51) GGGGAATTCC
RhoG (-647) GGGAAGCCCC
(-447) GGGGCCTTCC
(-386) GGGACTGCCC
Figure 7 (see legend on next page)
CAG-isl 7
Ubiquitin-like protein GDX
Beta-1,2-N-acetylglucosaminyltransferase (MGAT2) Beta-1,2-N-acetylglucosaminyltransferase (MGAT2) LGN Protein
KIAA0090
Signal sequence receptor alpha S31i125
Ribophorin 1
Rat translocon associated protein delta Peptidylprolyl isomerase B
Protein disulphide isomerase related protein Protein disulphide isomerase related protein Proline 4-hydroxylase, beta plypeptide Canis oligosaccaryltransferase 150 kDa oxygen-regulated protein Mouse tumour rejection antigen, TRA1 Antioxidant enzyme
ATF6
Proton ATPase like protein
Asparagine-linked glycosylation 3 homolog Arginine rich protein
High density lipoprotein binding protein TRAMP protein
TRAMP protein KIAA0102
Hypoxanthine phosphoribosyltransferase 1 DPAGT1
Calnexin Calnexin ARF1 ARF1
Coatomer beta subunit Calumenin
Phosphomannamutase 2 Ceroid-lipofuscinosis MACH alpha
FADD homologous ICE/CED –3-like protease Calcineurin binding protein, calsarcin 1
BCBL-1 EHEB Raji L-428 TOM-1 Nalm
-6
SU-DHL-5 DoHH-2 Namalwa Karpas-422 BONNA-12 DG-75 PEL-B JSC-1 PEL-SY HBL-6 BC-3 RPMI-8266 NCI-H929 DS-1 SK-MM-2 L-363 BCP-1 Ramos Reh DEL
−1000 −500 −1
+1
Calnexin
TRA1
MGAT2
DPAGT1
TGACGTG CCAATN6CCACG
(a)
[image:12.612.59.553.84.723.2]comm
en
t
re
v
ie
w
s
re
ports
refer
e
e
d
re
sear
ch
de
p
o
si
te
d r
e
se
a
rch
interacti
o
ns
inf
o
rmation
enables the effective identification of cluster groups that are of high reliability and cluster method independent.
The choice of clustering algorithms and parameter settings is a major stumbling block for all gene array cluster analysis. The effect of varying the parameters depends on the cluster method used. The performance of cluster methods has been extensively investigated [12]. The authors show that model-based methods and certain partitional methods, when used with optimal distance matrices, perform well on synthetic and real-world data. From our study, SA, an optimization method, also performs well as a clustering method. Therefore, the individual algorithms used as input to consensus clustering should ideally consist of representative algorithms from opti-mization (for example, SA), graph theoretical (for example, CAST), model-based (for example, MCLUST [12]) and partitional (for example, HC). Some methods (for example, CAST, SA and MCLUST) can determine the number of clus-ters directly from the input data. However, some other methods require the number of clusters to be specified as a parameter (for example, PAM and HC). In principle, methods such as CAST, SA and MCLUST can be used to determine this parameter for methods such as PAM and HC.
Consensus clusters are likely to contain gene subsets that are co-regulated by common transcriptional control networks or are coexpressed to participate in cellular processes that together manifest a global phenotype of the cell or tissue. In either case, these clusters are of high biological value. To facil-itate further analysis it is useful to know which clusters are involved in a given biological process. By supplying a list of genes from a given biological process or network, the use of the normal approximation to the binomial distribution of these genes over all consensus clusters, allows the identification of clusters of high functional significance. Sim-ilar statistical assignment of gene function based on cluster analysis was performed by Wu et al. using a database of clusters [20]. To assign significance Wu et al. used the hyper-geometric distribution. This distribution can be formally shown to asymptotically become the binomial distribution when the population size increases. Therefore, when used on large gene-expression datasets our methods are directly anal-ogous to Wu et al. However, consensus clustering has the advantage over a database of clusters by producing low-prob-ability clusters containing a significant percentage of known elements from functional groups.
Two functionally significant clusters, the NFκB-responsive
cluster and the ER/UPR cluster, were investigated further
here. Within the NFκB-responsive cluster 50% of the putative
promoters of genes investigated had canonical NFκB-binding
sites within 1,000 base pairs of the transcriptional start site,
suggesting that they are NFκB responsive [29,30]. The
majority of these genes had NFκB-binding sites within 500 bp
of the transcriptional start sites, consistent with the location
in other NFκB-responsive genes [35]. Of the remaining two
genes with NFκB-binding sites greater than 800 bp from the
transcription start site, one, Bfl-2, has been experimentally verified [36]. Analysis of the ER/UPR consensus cluster also provided information on gene regulatory elements, but more interestingly provides insights into the control and effect of the ERSR/UPR.
In cells, the presence of unfolded proteins in the ER is associ-ated with induction of the ER/UPR. However, during the maturation of B-cells to antibody-secreting plasma cells, expansion of the ER to accommodate increased secretion of immunoglobulins is thought to be coupled to the final stages of plasma-cell maturation. The induction of the ER/UPR occurs via the coordinated activation of the transcription fac-tors ATF6 and XBP1 [31,33]. ATF6 is normally maintained as an inactive, ER-resident, transmembrane protein that is cleaved, after translocating to the Golgi upon ER stress, by the site proteases S1P and S2P [37,38]. The cleaved transcription-ally active ATF6 is then free to translocate to the nucleus, where it can activate target genes such as XBP1 and the ER chaperon protein GRP78/BiP [39]. XBP1 mRNA is cleaved by the ER stress activated protein IRE1 to yield the transcrip-tionally active form of XBP1, inducing further genes of the UPR [32]. The activation of both the ATF6 and IRE1/XBP1 pathways results in enhanced transcription of ESRE-respon-sive genes; however, only XBP1 appears able to transactivate the UPRE. The identification of ESRE binding sites in the promoter regions of genes for calcium-ion binding protein and UPRE binding sites in the promoter regions of N-glycan biosynthesis genes suggests that these genes are differentially regulated by ATF6/XBP1 and XBP1 respectively.
The only known UPRE target gene is ER
degradation-enhanc-ing α-mannoside-like protein (EDEM), whose induction
depends solely on IRE1/XBP1 activity [33]. Induction of the two UPRE-containing genes, UDP-GlcNAc:dolichol
phos-phate N-acetylglucosamine-1 phosphate transferase
(DPAGT1) and UDP-GlcNAc:α-6-D-mannoside β
-1-2-N-acetylglucosaminyltransferase II (MGAT2), which catalyze essential steps in the biosynthetic pathway of complex N-linked glycans, supporting a clear link between the dolichol pathway and the UPR [40]. In addition, the ER/UPR func-tional group suggests that DPAGT1 and MGAT2 expression is regulated solely by the IRE1/XBP1 pathway. Altogether, these Genes involved in the ER/UPR
Figure 7 (see previous page)
results show that consensus clustering and gene functional group analysis provide a highly accurate way of mining gene-expression data for novel insights into different genes within the cluster.
Robust and consensus clustering provide a platform for more efficient microarray analysis pipelines. There is effectively no limit to the number of different clustering algorithms that can be used to feed into the consensus clusters, and each cluster-ing algorithm could be run under different parameter sets to fully explore a microarray dataset [19]. In addition, different distance matrices could be used as input into the range of clustering algorithms. In each case the consensus clustering algorithm effectively acts as the collation and interpretation point for the different individual analysis methods. This envi-ronment is ideal for use in parallel processing computer farms and the GRID [41]. In such an environment, each node of the farm could perform a range of analyses with a subset of clustering algorithms, with the master node compiling the consensus results. This would greatly increase computational speed and allow a thorough, single data entry point, access to an extensive range of clustering methods.
All areas of functional genomics that produce high-dimen-sional datasets with inherent patterns will require data parti-tioning to allow interpretation. Consensus clustering in the context of statistically defined functional groups could allow a consistent analysis platform for such diverse data types.
Materials and methods
Clustering methods
We implemented and compared a representative sample of methods from the statistical, AI and data-mining communi-ties. The methods used were average linkage HC, PAM, SA and CAST. As all the clustering techniques use correlation between variables, we used the Pearson's correlation coeffi-cient, r, to measure the linear relationship between two
vari-ables, x1 and x2, where the variable can be either discrete or
continuous [42]. HC and PAM methods were implemented using the statistical package R [22], while CAST and SA were implemented locally in C++.
HC is an agglomerative method that produces a hierarchical (binary) tree or dendrogram representing a nested set of data partitions. It has been applied successfully to many gene-expression datasets [43]. Sectioning a hierarchically clus-tered tree at a particular level leads to a partition with a number of disjointed groups, thereby yielding different clustering of the data. The tree was sectioned using the CUT-TREE method, to yield 13 clusters for the ASC dataset and 40 for the B-cell dataset. The method PAM works by first select-ing m out of n total objects that are the closest (accordselect-ing to a distance matrix) to the remaining (n - m) objects. The fitness of these medoids is calculated by placing the remaining (n -m) objects in a group according to the nearest medoid and
summing the distances of the group members from this
medoid. These m selected objects are the initial medoids. A
Swapping procedure is then applied to reassort the objects until there is no improvement in the fitness of the medoids [3]. As with HC, PAM is set to search for 13 and 40 clusters. The choice of 13 clusters for the ASC data was determined by the number of repeated genes, whereas 40 clusters for the B-cell data was based on previous exploratory data analysis [21].
SA [6] is an iterative improvement search technique that starts with a random solution to a given problem, and then tries to increase its worth by a series of small changes in clus-ter membership. If such a small change is betclus-ter than the pre-vious solution, then further changes are made from this new point. However, if the new solution is worse than the old one, it is not discarded, but accepted with a certain probability. The measured worth of the SA clustering arrangement is based here on the EVM metric [44]. SA has recently been applied to the clustering of gene-expression data [45]. The
performance related parameters for SA were set as follows: θ0
= 100, c = 0.99994 and number of iterations = 1,000,000.
CAST [9] is a heuristic algorithm that uses an affinity measure to determine whether variables are assigned to clusters. It requires a threshold parameter, which determines whether variables are assigned or moved to new clusters. Once CAST is complete, a clean-up operation is applied to ensure that the affinity of every variable to its cluster is greater than a user defined threshold. The only parameter CAST needed was the affinity level, which was set to 0.5 as recommended [9].
Methods such as CAST and SA require the
differences/rela-tionships between a pair of observations, x1 and x2, to be
expressed as binary (b). As Pearson's correlation coefficient is bounded, it provides a good basis for defining a binary rela-tionship between two variables as defined by:
where 0 <α≤ 0 is a constant and is a floor function that
returns the largest integer less than or equal to the real number y.
Datasets for evaluation
Two datasets were used for evaluating the cluster methods. The first is a set of multiply repeated control element spots relating to the Amersham Score Card (ASC) probe set on the Human Genome Mapping Project Human Gen1 clone set array [46]. The ASC probes are present as a single row of 32 elements in each of the 24 array sub-grids. Of these elements, 13 gene probes consistently give signals above background in both the Cy5 and Cy3 channels. Therefore, each array has
b x x r x x
r x x
( , ) , ( , )
,
( , )
1 2 1 2
1 2 1 0
1
= ≥
= − +
if
otherwise (5)
α
α
y
comm en t re v ie w s re ports refer e e d re sear ch de p o si te d r e se a rch interacti o ns inf o rmation
effectively 24 repeat measurements of 13 spots. After filtering for low signal-to-noise ratio (SNR) probes, a dataset of 30 arrays was examined by treating each positional repeat probe element across the 30 array set as an individual gene, which together with the remaining 23 same-gene probes per array, represents a highly correlated gene-expression profile. There-fore, we assume the repeated probes should cluster together; thus, this dataset becomes 308 genes/probe elements, which would cluster into 13 known groups, with each group having between 6 and 24 members after SNR filtering. In essence, the ASC data represent a semi-synthetic dataset for internal cluster method validation.
The second dataset consists of a series of 26 arrays (1,987 fil-tered genes) measuring gene-expression difference across a set of human B-cell lymphomas and leukemias [21]. The data-set is available via the URL indicated in Jenner et al. [21]. Each probe on the array detected a single gene transcript. This dataset contains a number of genes that correspond to known cellular functions, for example cell proliferation and
NFκB response. The four clustering techniques described
above were applied to both the datasets, with each method being set to find 13 clusters for the ASC and 40 clusters for the B-cell data.
Synthetic datasets
Two synthetic datasets were generated using a vector autore-gressive process (VAR) or a multivariate normal distribution (MVN). The two datasets contained 1,830 genes and 20 con-ditions (arrays). The VAR process of order p is a linear multi-variate time series defined by
where x(t) is the n-dimensional vector of observations at time
t, Ai is the n × n autoregressive coefficient matrix at time lag i,
and ε(t) is the zero mean n-dimensional noise vector at time t
(drawn from a normal distribution). Therefore x(t) is a linear combination of the previous observations plus some random noise. For the synthetic dataset, each cluster was generated by a vector autoregressive model of order p = 1 and size n equal to the number of genes in the cluster.
For the MVN dataset, a vector of random variables x has a MVN distribution if every linear combination of that vector is also normal. Under such conditions we use the notation x ~
N(µ, Σ) to denote that x follows the MVN distribution, where
µ is the mean vector and Σ is a positive definite matrix of
cov-ariance. The probability density function of x is given by
where |Σ| = det(Σ). For the synthetic dataset, each cluster was
drawn from an MVN distribution with varying mean µ and
covariance Σ.
Weighted-kappa metric
To compare the resultant clusters for each method, a statistic
known as weighted-kappa was used [18]. This metric rates
agreement between the classification decisions made by two or more observers. In this case the two observers are the clus-tering methods. The classification from each observer for each unique pairing of variables (within the clusters) is divided into a 2 × 2 contingency table. Rows and columns within this table are indexed according to whether the two variables are in the same group or in different groups. The total number of comparisons, N, is defined in the following
equation, where Countij is the number of elements in the
matrix cell indexed by (i,j),
and n is the number of variables (genes) in the clusters as this represents the number of unique variable pairings.
The weighted-kappa metric is calculated from the contigency table by:
where, wij is the weights for each category comparison; po(w)
and pe(w) represent the observed weighted proportional
agreement and the expected weighted proportional
agree-ment; Countij is the ith, jth element of the 2 × 2 contingency
table; N is the sum of the elements within this table; Row(i) and Col(i) are the row and column totals for this table
respec-tively and Kw is the weighted-kappa value. The interpretation
of weighted-kappa values indicates the strength of
agree-ment between two observers (Table 1) is used to compare cluster method agreement in both datasets.
Acknowledgements
This work is supported in part by the BBSRC, the EPSRC and the MRC in the UK. We would also like to thank Richard Jenner for the viral gene expression dataset and Antonia Kwan for preparing the ASC dataset. These methods are available on request as functions in the statistical package, R.
References
1. Ward JH: Hierarchical grouping to optimize an objective function.J Am Stat Assoc 1963, 58:236-244.
2. McQueen J: Some methods for classification and analysis of multivariate observations.5th Berkeley Symposium on Mathemati-cal Statistics and Probability Berkeley; 1967:281-297.
3. Kaufman L, Rousseeuw PJ: Clustering by means of medoids. Sta-tistical Analysis Based Upon the L1 Norm Edited by: Dodge Y. Amster-dam: North-Holland; 1987:405-416.
4. Goldstein D, Ghosh D, Conlon E: Statistical issues in the
x t A x t ii t
i p ( )= ( − +) ( ), =
∑
ε 1 φ π µ µ ( ) ( ) ( ) ( ) x e x x n T =−1
(
− − −)
2
1
2
Σ
Σ
N Countij n n
j i = = − = =
∑
∑
1 2 1 2 1 2 6 ( ) . ( )K p p
p p N w Count p
N
w o w e w
e w o w i j ij ij
e w = − − = = = =∑ ∑ ( ) ( ) ( ) ( ) ( ) 1 1 1 1 2 1 2
2 ww Row i Col jij w i j i j j i ij ( ) ( ) , ( ) = = ∑ ∑ = − − ≤ ≤ 1 2 1 2
1 1 2
![Figure 5and functional annotationVisualization of average linkage HC using the programs Cluster and Treeview [5] of the NF](https://thumb-us.123doks.com/thumbv2/123dok_us/8663134.870928/10.612.55.558.86.541/figure-functional-annotationvisualization-average-linkage-programs-cluster-treeview.webp)