International Journal of Emerging Technology and Advanced Engineering
Website: www.ijetae.com (ISSN 2250-2459, ISO 9001:2008 Certified Journal, Volume 6, Issue 8, August 2016)
111
Plant Layout Optimization using CRAFT Algorithm supported
by a Virtual Factory created as an Implementation of Digital
Manufacturing
Kiran Phadatare1, Dr. Rajesh Buktar2, Vishal Doshi3
1 M Tech Machine Design, SPCE, Mumbai, India
2 Professor, Dept of Mechanical Engineering, SPCE, Mumbai, India
3 Director - Business Development, Industrial Engineering Corporation, Mumbai, India
Abstract—Plant layout optimization involves setting up the machines and the Material Handling System of the industry in order to reduce the cost and time involved in the process of manufacturing a product. It can be done with the intent to fulfill one or multiple objectives.
A 3D Plant Model incorporates geometric models of different industrial components, as well as tools and other facility equipments so that the manufacturing processes can be defined, designed and implemented. It gives process planners, the flexibility to make corrections and suggest improvements in the real factory through the digital plant model.
Considering the global industrial scenario, the Original Equipment Manufacturers have started implementing the technology of Digital Manufacturing in the recent years. As such, it can also be adopted for increasing the profitability and efficiency of mechanical systems in the lower industrial hierarchy. In this paper, an approach that combines plant layout optimization using facility allocation technique and a 3D Plant Model created as an application of Digital Manufacturing, has been proposed. To explain the concept, the Shop Floor of a Fastener Manufacturing Company has been considered for layout optimization and its Digital Model has been developed.
Keywords— CRAFT, Plant layout, Layout Optimization, Digital Manufacturing, DELMIA, Digital Factory
I. INTRODUCTION
In general, the layout of a manufacturing plant is a methodical arrangement of departments that are important for manufacturing goods and the delivery of various services. In a facility layout the location of facilities like the machine tools, machine shop, warehouse, manufacturing cells and work centers largely affects the performance of the job that is being carried out. Generally manufacturing units face problems which are related to the location of departments on the shop floor of the plant. Hence it is very important that the layout of the plant be optimized in order to obtain better utilization of the plant facilities.
For many years, researchers and industrial experts have felt the need of a promising and reliable set of tools that could help in changing the industrial scenario with respect to production cost, production time, plant level customization, effective floor space utilization and other relevant parameters that govern the different stages of product development.
II. LITERATURE REVIEW
A. CRAFT Algorithm
Computerized Relative Allocation of Facilities Technique (CRAFT) was proposed in 1964 by Buffa et al. [1] It is an improvement type of algorithm used for layout optimization of existing facilities. [2] The basic goal of the algorithm is to minimize transportation cost (TC) function, which is specified mathematically as:
∑ ∑
Where,
Dij - distance from departments i to department j. Wij - interdepartmental traffic from departments i to department j
Cij - handling cost between departments i and department j
n - number of departments
1) CRAFT Procedure
1. Determine department centroids.
2. Calculate rectilinear distance between centroids. 3. Calculate transportation cost for the layout.
4. Consider department exchanges of either equal area departments or departments sharing a common border.
International Journal of Emerging Technology and Advanced Engineering
Website: www.ijetae.com (ISSN 2250-2459, ISO 9001:2008 Certified Journal, Volume 6, Issue 8, August 2016)
112
6. Select and implement the departmental exchangethat offers the greatest reduction in transportation cost.
7. Repeat the procedure for the new layout until no interchange is able to reduce the transportation cost.
2) Assumptions
Moving costs are not dependent on the equipment utilization.
Moving costs are linearly related to the length of the move.
Distance metric used is rectilinear distance between department centroids.
Input to CRAFT is From-To Chart.
B. Digital manufacturing
Digital manufacturing is a collection of integrated tools that work with product definition data to support tool design, design of manufacturing processes, visualization, simulation, and other analyses that help in optimization of manufacturing processes.[5,6]
The assimilation of Digital Manufacturing into manufacturing planning has presented the critical link between design and manufacturing engineering, and enabling the mutual environment that is crucial to successful implementation of concurrent engineering practices.
In the presented case, Digital Manufacturing Solution DELMIA has been used to create the virtual environment of an existing manufacturing system. DELMIA (Digital Enterprise Lean Manufacturing Interactive Application), a product of the Dassaults Systemes, is a Global Industrial Operations software solution that enables manufacturers in any industry to efficiently plan, manage, and optimize their industrial operations throughout the world.
DELMIA allows manufacturers to virtually experience their entire factory production from the impact of design to determining how to meet global demand, allowing manufacturers to address and shift processes to quickly respond to the competition and take advantage of market opportunities. In case of already existing plants, it proves to be very useful in planning the manufacturing activities and getting a clear visualization of the plant layout.
III. METHODOLOGY
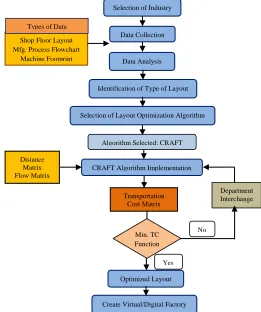
[image:2.612.315.576.138.450.2]The methodology of work can be explained using the following block diagram.
Fig. 1 - Methodology of Work
A. Layout Optimization 1) Selection of Industry
In order to carry out layout optimization, the industry shop floor needs to have adequate site size, number of departments and machine tools. In this case we have considered a single floor fastener manufacturing company, Industrial Engineering Corporation, Mumbai that majorly produces three engineering components, namely- Stud, Bolt and Nut. These products are used in building Automobiles, Railway wagons, Ships, Agricultural Pump sets, Electronic equipments, setting up Steel , Cement, Paper, Petroleum, Fertilizer plants and construction of Hydel, Thermal, Atomic power stations.
2) Collection of Data
Initially, relevant data such as the layout of the shop floor, Manufacturing process flowcharts for various components manufactured at the industry was obtained from the design section of the company.
Selection of Industry
Data Collection Shop Floor Layout
Mfg. Process Flowchart Machine Footprint
CRAFT Algorithm Implementation Distance Matrix Flow Matrix Cost Matrix Transportation Cost Matrix Optimized Layout
Create Virtual/Digital Factory Types of Data
Data Analysis
Yes
Department Interchange
No Selection of Layout Optimization Algorithm
Identification of Type of Layout
Algorithm Selected: CRAFT
Min. TC Function
International Journal of Emerging Technology and Advanced Engineering
Website: www.ijetae.com (ISSN 2250-2459, ISO 9001:2008 Certified Journal, Volume 6, Issue 8, August 2016)
113
Various departments were located on the shop floor and their areas were measured. The footprint of the machines in the departments were obtained and converted into a 2D Drawing using the software Autocad. The distances between departments were measured in order to formulate the Distance Matrix.3) CRAFT Implementation
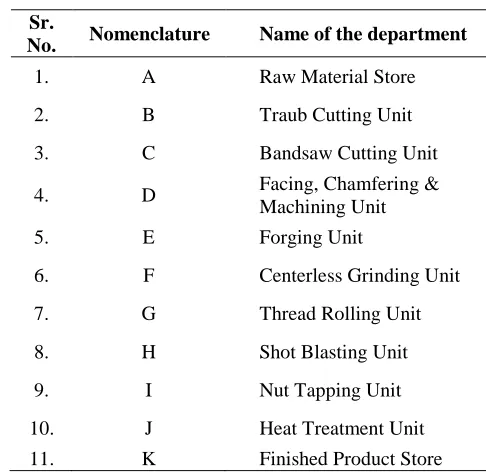
The shop floor, that is considered for optimization and digitization comprises of 11 departments. These departments can be listed as follows:[2]
Table 1 –
Departments and their Nomenclature
Sr.
No. Nomenclature Name of the department
1. A Raw Material Store
2. B Traub Cutting Unit
3. C Bandsaw Cutting Unit
4. D Facing, Chamfering & Machining Unit
5. E Forging Unit
6. F Centerless Grinding Unit
7. G Thread Rolling Unit
8. H Shot Blasting Unit
9. I Nut Tapping Unit
10. J Heat Treatment Unit
11. K Finished Product Store
[image:3.612.337.543.209.558.2]After performing a detailed study of the manufacturing process flows of the components produced at the industry, the following operation sequences of the machines were determined.
Table 2 –
Operation Sequences of Departments forvarious components
Part Path Operation Sequence of Machines
Bolt
Path 1: d < 29.6 mm A→B→D→E→H→D→F→G→J→K
Path 2: d ≥ 29.6 mm A→C→D→E→H→D→F→G→J→K
Stud Path 1: d < 29.6 mm A→B→D→F→G→J→K Path 2:d ≥ 29.6 mm A→C→D→F→G→J→K
Nut Path 1: d < 29.6 mm A→B→E→H→D→I→ J→K Path 2: d ≥ 29.6 mm A→C→E→H→D→I→J→K
a)Distance Matrix
[image:3.612.43.286.284.520.2]Various departments on the shop floor were identified and the centroids of the respective departments for the existing layout were located. The existing layout with all the departments can be understood from the following drawing.
Fig. 2 - Present Layout of the Company
International Journal of Emerging Technology and Advanced Engineering
Website: www.ijetae.com (ISSN 2250-2459, ISO 9001:2008 Certified Journal, Volume 6, Issue 8, August 2016)
[image:4.612.55.555.422.620.2]114
Table 3 – Distance Matrix
To
A B C D E F G H I J K
From
A 0 14.80 41.75 53.95 62.43 61.65 78.90 28.06 51.73 86.23 17.70 B 0 NR 47.15 55.63 54.85 72.10 32.56 44.93 79.43 22.20 C 0 25.20 33.68 32.90 50.15 59.51 22.98 57.48 49.15
D 0 21.48 20.70 37.95 71.71 18.48 45.28 61.35
E 0 15.48 27.73 80.19 26.96 35.06 69.83
F 0 31.95 79.41 26.18 39.28 69.05
G 0 96.66 43.43 31.33 86.30
H 71.71 0 69.49 103.99 18.36
I 0 50.76 59.13
J 0 93.63
K 0
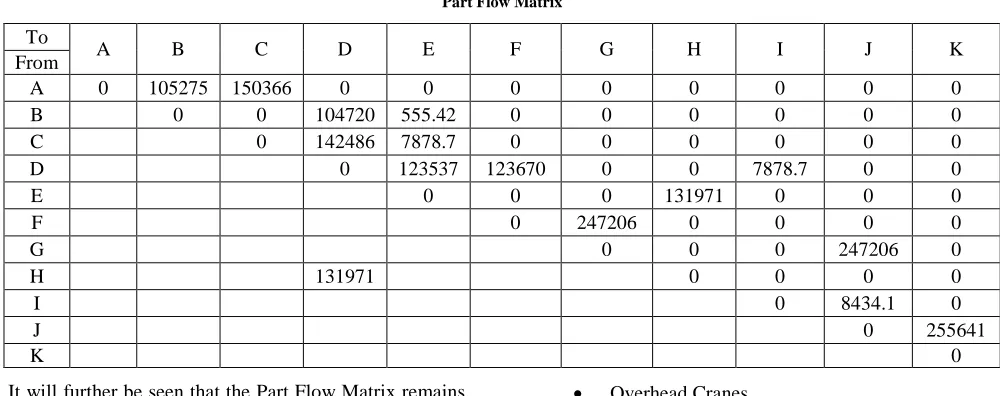
b) Part Flow Matrix
We have considered a batch production type company for this project. In order to understand the part flow among various departments, a time based study was conducted over a period of 3 Months.
The flow of material was analyzed in terms of the weight of material that was moved from department to department over a period of 3 months. The Part flow matrix was eventually obtained and was tabulated as follows:
Table 4 – Part Flow Matrix
To
A B C D E F G H I J K
From
A 0 105275 150366 0 0 0 0 0 0 0 0
B 0 0 104720 555.42 0 0 0 0 0 0
C 0 142486 7878.7 0 0 0 0 0 0
D 0 123537 123670 0 0 7878.7 0 0
E 0 0 0 131971 0 0 0
F 0 247206 0 0 0 0
G 0 0 0 247206 0
H 131971 0 0 0 0
I 0 8434.1 0
J 0 255641
K 0
It will further be seen that the Part Flow Matrix remains unchanged after interchanging departments as the manufacturing process flow remains the same.
c) Cost Matrix
The material handling in the industry is carried out by means of:
Manual Labor and Hand Pallet Truck Forklift
Overhead Cranes
International Journal of Emerging Technology and Advanced Engineering
Website: www.ijetae.com (ISSN 2250-2459, ISO 9001:2008 Certified Journal, Volume 6, Issue 8, August 2016)
[image:5.612.63.548.149.323.2]115
Table 5 – Cost Matrix
To
A B C D E F G H I J K
From
A 0 3 3 0 0 0 0 0 0 0 0
B 0 0 2 2 0 0 0 0 0 0
C 0 2 2 0 0 0 0 0 0
D 0 1 1 0 0 1 0 0
E 0 0 0 1 0 0 0
F 0 1 0 0 0 0
G 0 0 0 2 0
H 2 0 0 0 0
I 0 2 0
J 0 2
K 0
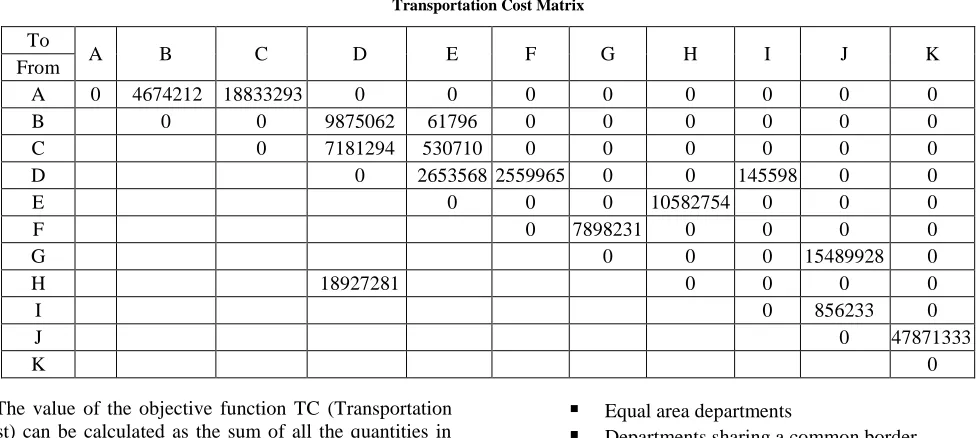
d) Transportation Cost Matrix
As per CRAFT procedure, the total cost of transportation of components among individual departments was calculated as the product of three individual matrices
namely- Part Flow Matrix, Distance Matrix and Cost Matrix; and tabulated in the form of Transportation Cost Matrix given as follows:
Table 6 – Transportation Cost Matrix
To
A B C D E F G H I J K
From
A 0 4674212 18833293 0 0 0 0 0 0 0 0
B 0 0 9875062 61796 0 0 0 0 0 0
C 0 7181294 530710 0 0 0 0 0 0
D 0 2653568 2559965 0 0 145598 0 0
E 0 0 0 10582754 0 0 0
F 0 7898231 0 0 0 0
G 0 0 0 15489928 0
H 18927281 0 0 0 0
I 0 856233 0
J 0 47871333
K 0
The value of the objective function TC (Transportation Cost) can be calculated as the sum of all the quantities in the Transportation Cost Matrix.
Therefore, in the study for a period of 3 months, the value of TC Function for the present layout was found out to be 148141263.
Now for improving the layout, we perform various department interchanges. These interchanges are carried out for-
Equal area departments
Departments sharing a common borderThe departments are swapped using pair wise exchanges, either in 2-opt or 3-opt manner. For the presented case a total of 46 interchanges are possible. The
[image:5.612.62.551.385.604.2]International Journal of Emerging Technology and Advanced Engineering
Website: www.ijetae.com (ISSN 2250-2459, ISO 9001:2008 Certified Journal, Volume 6, Issue 8, August 2016)
[image:6.612.45.293.158.613.2]116
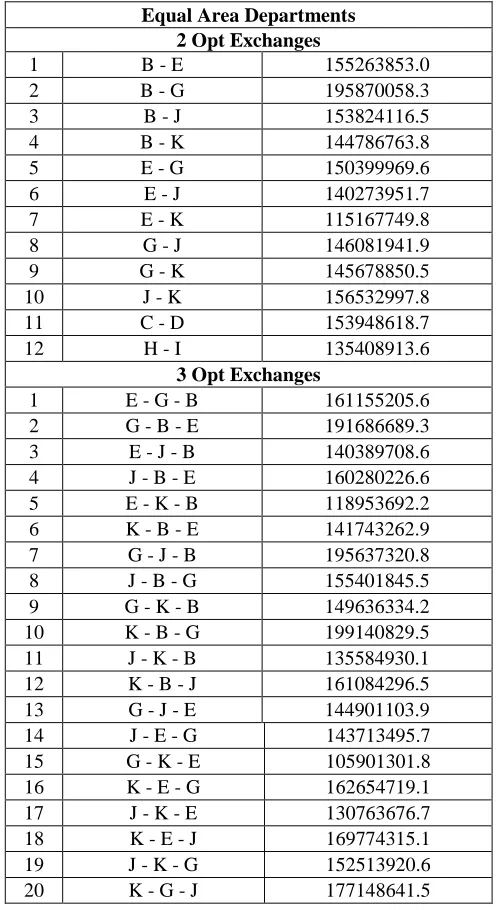
Table 7 –
Transportation Cost Function for variousDepartment Interchanges
Equal Area Departments 2 Opt Exchanges
1 B - E 155263853.0
2 B - G 195870058.3
3 B - J 153824116.5
4 B - K 144786763.8
5 E - G 150399969.6
6 E - J 140273951.7
7 E - K 115167749.8
8 G - J 146081941.9
9 G - K 145678850.5
10 J - K 156532997.8
11 C - D 153948618.7
12 H - I 135408913.6
3 Opt Exchanges
1 E - G - B 161155205.6
2 G - B - E 191686689.3
3 E - J - B 140389708.6
4 J - B - E 160280226.6
5 E - K - B 118953692.2
6 K - B - E 141743262.9
7 G - J - B 195637320.8
8 J - B - G 155401845.5
9 G - K - B 149636334.2
10 K - B - G 199140829.5
11 J - K - B 135584930.1
12 K - B - J 161084296.5
13 G - J - E 144901103.9
14 J - E - G 143713495.7
15 G - K - E 105901301.8
16 K - E - G 162654719.1
17 J - K - E 130763676.7
18 K - E - J 169774315.1
19 J - K - G 152513920.6
20 K - G - J 177148641.5
Adjacent Departments 2 Opt Exchanges
1 D - F 152506556.7
2 F - G 142695074.0
3 H - K 146273343.6
4 I - E 126353130.2
3 Opt Exchanges
1 D - F - C 153997399.5
2 F - C - D 157937967.9
3 F - D - C 157186182.5
4 F - G - D 161685822.6
5 G - D - F 165468524.1
6 G - F - D 165305470.2
7 B - H - K 143089311.7
8 B - K - H 141148577.5
9 K - B - H 140934252.7
10 J - I - E 142675759.3
International Journal of Emerging Technology and Advanced Engineering
Website: www.ijetae.com (ISSN 2250-2459, ISO 9001:2008 Certified Journal, Volume 6, Issue 8, August 2016)
[image:7.612.96.551.131.393.2]117
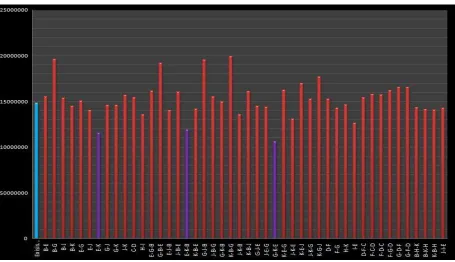
Fig. 3 - Graph of TC Function comparison for various Department Interchanges
From the graph, it can be observed that the TC Function shows variation for different interchanges.
As the objective of optimization is minimization of TC we have the following department interchanges as optimum.
Table 8 – Optimal Layout Details
`Sr. No.
Departmental Interchange
Transportation Cost Function (TC)
% Reduction in TC
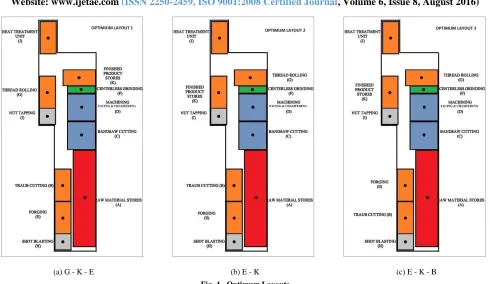
1. G - K - E 105901301.8 28.51
2. E - K 115167749.8 22.26
[image:7.612.172.444.466.554.2]International Journal of Emerging Technology and Advanced Engineering
Website: www.ijetae.com (ISSN 2250-2459, ISO 9001:2008 Certified Journal, Volume 6, Issue 8, August 2016)
118
[image:8.612.61.551.122.406.2](a) G - K - E (b) E - K (c) E - K - B
Fig. 4 - Optimum Layouts
B. Virtual Factory using Digital Manufacturing Solution DELMIA
Fig. 5 - Steps involved in creating a Digital Factory
As department interchange G - K - E leads to the most optimum layout, an Optimized Digital Factory was set up for the same.
DELMIA Resource Definition and Layout
Create an Area Resource
Impose Plan of the Layout and Machine Footprints on the Area
Import 3D Machine Models into Virtual Environment
Machine Replications according to the Footprint
[image:8.612.69.275.447.643.2]International Journal of Emerging Technology and Advanced Engineering
Website: www.ijetae.com (ISSN 2250-2459, ISO 9001:2008 Certified Journal, Volume 6, Issue 8, August 2016)
119
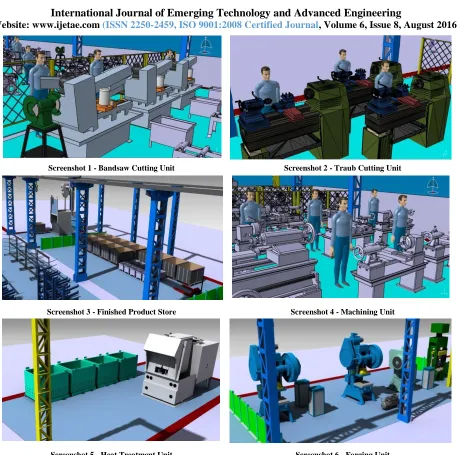
Screenshot 1 - Bandsaw Cutting Unit Screenshot 2 - Traub Cutting Unit
Screenshot 3 - Finished Product Store Screenshot 4 - Machining Unit
[image:9.612.80.537.99.554.2]Screenshot 5 - Heat Treatment Unit Screenshot 6 - Forging Unit
Fig. 6 - Different Views of the 3D Plant Model
IV. RESULTS AND DISCUSSION
After performing layout optimization using CRAFT, we observe that a well planned and optimized manufacturing system results into a profitable production cycle. Properly locating various machines, production facilities and employee amenities in the industry leads to better utilization of the machines and higher production rates.
International Journal of Emerging Technology and Advanced Engineering
Website: www.ijetae.com (ISSN 2250-2459, ISO 9001:2008 Certified Journal, Volume 6, Issue 8, August 2016)
[image:10.612.43.295.198.334.2]120
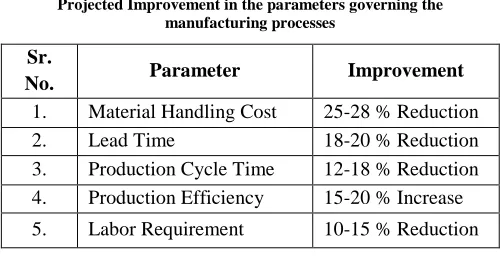
After producing the optimized layouts and discussing the results with the senior stakeholders of the industry it was stated that the following improvements can be projected from the optimized layout and the virtual factory-Table 9 –
Projected Improvement in the parameters governing the manufacturing processes
Sr.
No. Parameter Improvement
1. Material Handling Cost 25-28 % Reduction
2. Lead Time 18-20 % Reduction 3. Production Cycle Time 12-18 % Reduction
4. Production Efficiency 15-20 % Increase
5. Labor Requirement 10-15 % Reduction
V. CONCLUSION
When the results from the present layout are compared with the improved layout, it is found that there is an increase in the utilization of the machines in the new layout and also there is a considerable reduction in the cost of material transportation. The machines and departments are relocated in such a way that the flow of the material is smoother. Additionally, through digital manufacturing, it is possible to incorporate changes in the virtual factory models faster and ensure that they are operating under optimal layout, throughput and material flow before production ramp-up. Therefore, from the variety of advantages derived, it is clear that this paper can be an initial reference for implementing this technology in other small scale industries as well.
REFERENCES
[1] Gordon C. Armour, Elwood S. Buffa, (1963) A Heuristic Algorithm and Simulation Approach to Relative Location of Facilities, Management Science 9(2):294-309
[2] Hari Prasad.N, Rajyalakshmi.G, Sreenivasulu Reddy.A, A Typical Manufacturing Plant Layout Design Using CRAFT Algorithm, 12th Global Congress On Manufacturing And Management, GCMM 2014, Procedia Engineering 97 ( 2014 ) 1808 – 1814
[3] Bobby John, Jubin James, Mahesh Rengaraj, Analysis and Optimization of Plant Layout using Relative Allocation of Facilities Technique, International Journal of Emerging Technology and Advanced Engineering, ISSN 2250-2459, ISO 9001:2008 Certified Journal, Volume 3, Issue 8, August 2013
[4] K Balamurugan, V Selladurai, and B Ilamathi, Design and optimization of manufacturing facilities layouts, Department of Mechanical Engineering, Bannari Amman Institute of Technology, Sathyamangalam, India, 2 May 2006
[5] Tompkins, White, Bozer, Tanchoco, Facilities Planning, Wiley, 2015
[6] G Chryssolouris, D Mavrikios, N Papakostas, and K Georgoulias, Digital manufacturing: History, perspectives, and outlook, Proceedings of the Institution of Mechanical Engineers, Part B: Journal of Engineering Manufacture 2009 223: 451, 20 June 2008 [7] Milan Gregor and Stefan Medvecky (2010). Digital Factory –
Theory and Practice, Engineering the Future, Laszlo Dudas (Ed.),
ISBN: 978-953-307-210-4, InTech, Available from:
http://www.intechopen.com/books/engineering-the-future/digital-factory-theory-and-practice
[8] Tullio Tolio, Marco Sacco, Walter Terkaj, Marcello Urgo, Virtual Factory: an integrated Framework for Manufacturing System Design and Analysis, 46th CIRP Conference of Manufacturing Systems 2013, Procedia CIRP 7 (2013) 25-30
[9] Dassaults Systemes Case Study, Tata Motors Adopts DELMIA Solutions for Digital Manufacturing , Tata Motors Ltd., 2008 [10] SIEMENS PLM Case Study, Digital manufacturing solution