International Journal of Emerging Technology and Advanced Engineering
Website: www.ijetae.com (ISSN 2250-2459,ISO 9001:2008 Certified Journal, Volume 4, Issue 9, September 2014)
622
User Interface for Integrating Airport Operations
Zhexing Yan
1, Mahroo Eftekhari
21,2School of Civil and Building Engineering, Loughborough University, Leicestershire, UK, LE11 3TU
Abstract—In the past few decades, air traffic problems at
major airports have been increased significantly and are expected over in the near future, which imposes a high requirement for more efficient cooperation across all airport operations. Thus, determining efficient airport operations is an important and critical problem for airports, airlines, passengers and other stakeholders. In this situation, the complexity of the problem means that advanced decision support systems are needed to guarantee efficient airside airport operations and to mitigate the environmental impact. The research Integrating and Automating Airport Operations has the main driver to decrease any detrimental effects of airport operations upon the environment. It represents a wide ranging multi-disciplinary and cross-institutional initiative to exploit recent research advances in automated search methodologies and decision support techniques for air operations (and other related areas). This research will build integrated computational models. As a part of the research, developing Human Machine Interface (HMI) is based on the user interface requirements making a platform to link the air operation models together, to build a computer simulation of the airport problem solving environment. The research is funded by EPSRC and focuses on the Manchester Airport.
Keywords— Airport operations, Decision support system,
Human-computer interaction, Human machine interface, User interface.
I. INTRODUCTION
[image:1.612.351.536.204.312.2]Today, Manchester Airport is the busiest airport outside London and busier than many European capital city airports. In 2006, over 22 million passengers travelled on over 226,000 aircraft movements to over 200 destinations worldwide. The Airport has three passenger terminals and two runways; the Second Runway opened in February 2001, providing the most substantial increase in national airport capacity for many years. The Airport serves a wide catchment area across Northern Britain, although the majority of passengers are from the North West Region [1].
Figure 1. Passengers Per Hectare at Manchester Airport from 1975 to 2030.
In 1975 Manchester Airport handled 5,325 passengers per hectare. This had grown to 36,388 passengers per hectare by 2005 and the goal is to continue to improve efficiency to 62,500 passengers per hectare by 2030. However, airport is proposing an increase in the size of the Operational Area from 625 hectares to around 750 hectares by 2030 (Figure 1). By 2030, the Government believes the number of passengers travelling through the Airport could reach 50 million a year [1].
Growth brings opportunities as well as challenges. The growth brings a big challenge to airport operations, and occurs delays as a result. Airport requires an integrated operation system to minimize the potential delay. Not only the transport faces the challenge, but also environment issues significant increased.
International Journal of Emerging Technology and Advanced Engineering
Website: www.ijetae.com (ISSN 2250-2459,ISO 9001:2008 Certified Journal, Volume 4, Issue 9, September 2014)
623
[image:2.612.50.288.211.369.2]The Group is funded by EPSRC (Engineering and Physical Sciences Research Council) and focuses on the Manchester Airport, developing the operations particularly based on the data from Manchester Airport. The group works closely with colleagues from airport to ensure continuous access to user specification and data.
Figure 2. Universities Cooperation.
In the airfield, there has been significant previous research into the stand/gate allocation problem, the arrival and departure sequencing problems, the ground movement and stand operations problems. However, most research has considered only one of these problems at a time. This project considers the ways in which these problems are linked, and the ways in which previous academic models have deviated from the real problems, in order to increase the level of automation which is practical for real airports.
One of the problems of a holistic airport management system would be the understand ability of the solutions or schedules. Different operators usually focus on individual aspects of the problem (e.g. gate assignment [2], only arrival sequencing, etc.).
The whole group aim to build an integrated system to link the key airport operations together. Group members Jun Chen et al. (2012) have utilised Fuzzy Rule-Based Systems for taxi time estimations at airports [3] and Stefan Ravizza et al. (2012) trade-off between taxi time and fuel consumption in ground movement [4]. Also physical blockages from apron taxi way which can be taken into account in the early stage of planning gate allocation [5]. An integrated system which has to make locally undesirable solutions (e.g. accept a delay in arrivals to facilitate runway crossings, move an aircraft to an inconvenient gate to facilitate ground movement or prevent contention).
A local or myopic system user would, therefore, be surprised on why they have to take a hit, or why some part of a solution is obviously undesirable. From this perspective, a HMI with explanatory power could be an interesting direction e.g., not only displaying the solution, but also stating the reason for the solution.
II. PROBLEM DESCRIPTION
A. Gate Allocation Problem
Push-back blocking and taxi blocking as examples of physical blockages can be taken into account in the early stage of planning. The group member Urszula M. Neuman (2013) has pointed out that GPush-back blocking happens when a departing aircraft is ready to leave a gate but cannot due to another aircraft is blocking its push-back trajectory. This conflict can be observed only at the area close to the gates. Taxi blocking happens either when there are two aircraft going along a straight taxiway in opposite directions, or when two taxiways occur at the crossing point at the same time. This type of blocking may occur not only at the gates but also further along the taxiways, for aircraft on the way to/from the runway [5].
B. Ground Movement Problem
Manchester Airport has two runways, Runway 1(23R/05L) opened on 17 May 1937 and Runway 2 (23L/05R) became operational on 5 February 2001. The prevailing wind direction in the UK is westerly so normally aircraft fly from northeast to southwest. In practice this means that normally aircraft land from the northeast over Stockport, Cheadle and Heald Green and take off towards and around Knutsford. In dual runway operations aircraft will usually land on Runway 1 (23R) and depart from Runway 2 (23L). The wind direction changes, usually affect approximately 20% movements per annum. The operations are reversed with aircraft landing from the southwest, lining up to the south of Northwich and over Knutsford and taking off towards Stockport. In dual runway operations aircraft will usually land on to Runway 2 (05R) and depart from Runway 1(05L) [6].
International Journal of Emerging Technology and Advanced Engineering
Website: www.ijetae.com (ISSN 2250-2459,ISO 9001:2008 Certified Journal, Volume 4, Issue 9, September 2014)
[image:3.612.58.281.135.323.2]624
Figure 3. Crossing path between Runway 1 and Runway 2 of Manchester Airport.
III. DECISION SUPPORT SYSTEM DEVELOPING
A. Case-Based Reasoning for Decision Support System
Having access to relevant case history in problem solving reduces the need for problem analysis because solution chunks from old problems can be reused and less in-depth analysis of the new problem is required. The conventional wisdom is that Case-Based Reasoning (CBR) is particularly appropriate in weak theory domains where the important influences and interactions are not well understood. The objective is that the problem of modelling these interactions can be finessed by reusing previously solved problems stored as cases [7, 8].
[image:3.612.331.555.464.700.2]The aim of this research is to develop a Multi-system as shown in Figure 2, based on a decision support centre combining a CBR system [9]. The reason for creating an integrated HMI is not only to display the solutions from a decision support system, but also be able to analysis the reason for the decision. This kind of HMI would be used in education and training purpose as well.
Figure 4. Development of a Multi-system.
As the Multi-system diagram (Figure 4) shows, the real world problems are analysed and are appropriately represented to be analysed by a reasoning system, then a decision support centre will provide an integrated solution.
B. Level Checking System
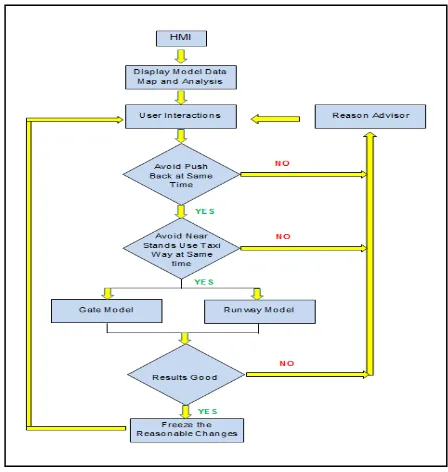
Level 1 Quick Check: Recently display the model data and model date in the interface, do the colour mapping and analysis. Analyse and minimize the variables which users can change and play around in the interface, the results of the basic human interaction will be checked through Quick Check first. The Quick Check bans the obvious faults (e.g. opposite stands push back at the same time, or near stands use the taxi way at the same time etc.), and sends the faults to Reason Advisor, which is based on the reasoning system to display the fault reasons to users. The other changes will be submitted to the next level check (Figure 5).
Level 2 Long Check: In this level, the changes will be submitted to optimize system. The gate model and runway model do the long check and give the feedback, analyse the influence of the reschedule, which shows how good or bad if do so. The Reason Advisor collects the bad user changes, and gives the reasons to users about the faults. Other useful analysis will be passed to the next level (Figure 5).
Level 3 Debug: According to the previous two levels checks, users would be able to freeze the reasonable changes and fix the rest (Figure 5).
[image:3.612.47.289.585.694.2]International Journal of Emerging Technology and Advanced Engineering
Website: www.ijetae.com (ISSN 2250-2459,ISO 9001:2008 Certified Journal, Volume 4, Issue 9, September 2014)
625
IV. HUMAN MACHINE INTERFACE DESIGN
As this group project is divided into several areas, (Runway Sequencing, Ground Movement Gate Assignment and Fuel Consumption), a User Interface is needed to integrate the information and automate the operations. The User Interface Design optimizes coordination and integrates the full information from each individual area.
C. Graphical User Interface (GUI) Design
To create a useful and easy learning UI, the UI layout becomes a key factor for users to learn and control, so that before programming the data base, a better UI layout needs to be decided.
A part of layout design idea is from the literature review of existing UI, e.g. Sensis Aerobahn [10] Interface designs several icons for integrating and visible graphic for reporting, which are convenient for user to operate and monitor.
[image:4.612.324.567.208.436.2]In the initial design stage, only Overview and Gate UI layouts have been set up. The following four figures show the element panels design.
Figure 6. Daily Operations panel.
[image:4.612.52.286.384.594.2]Daily Operations panel (Figure 6) mainly displays the daily arrivals and departures by selecting time and date. According to the operation data, the UI will automatically create appropriate graph for reporting purpose. Current Weather data as a reference factor appears on the left corner of the UI.
Figure 7. T2 Real Time Data 29th August 2011 in HMI Flights panel.
Flight panel (Figure 7) displays the basic air flight information (e.g. departure time, arrival time, runway, gate etc.) in the main table, once clicking on each flight; the detailed information will appear in the Flight Info label. In addition, the Passengers Info plans to send numbers and details of passengers to the operation and security; this part is set in the layout, but if not possible to get passengers information from airport system, it will be rebuilt in the future.
International Journal of Emerging Technology and Advanced Engineering
Website: www.ijetae.com (ISSN 2250-2459,ISO 9001:2008 Certified Journal, Volume 4, Issue 9, September 2014)
[image:5.612.95.519.140.338.2]626
Figure 8. Apron Road panel.
Apron Road panel (Figure 8) as a part of the gate allocation control scenario, gives the gate situations information to users. Figure 8 demonstrates Manchester Airport T2 gates.
The red points in the map mean flights arrive at those stands, and the green points show flights departure from those stands; as the time pass, the occupancies of each gate will be automatically updated by time.
Figure 9. Ground Movement tracking panel.
[image:5.612.96.518.397.701.2]International Journal of Emerging Technology and Advanced Engineering
Website: www.ijetae.com (ISSN 2250-2459,ISO 9001:2008 Certified Journal, Volume 4, Issue 9, September 2014)
627
Ground Movement tracking panel (Figure 9) is used to monitor crossing runway performance. According to the direction of operations, HMI has a panel for ground movement tracking, the aim is to help uses monitor aircraft movement and report the potential conflicts with visual control. In the Figure, the background map is a copy of OpenStreetMap. It is free to copy, distribute, transmit and adapt our data, as long as credit OpenStreetMapand its contributors [11]. Because of the essential ground details have been displayed, even the terminal area (purple colour) and runway area (green colour) have been separated by different colours. Thus users could easily distinguish the area locations. Aircraft tracking presents the movement of each in the tracking area; the colour points represent aircraft in different states. Figure shows one tracking example, aircraft 1 in blue colour is in schedule to cross the Runway 1 and depart from Runway 2 (23L); aircraft 1 is on hold due to the traffic control that aircraft 2 in yellow colour just in landing process on Runway 1 (23R). The demo shows the fundamental conflicts control in the key area.
D. Data Sharing
Java programming language has been used as the basic language tool for the whole group to achieve the goal of the project.
Recently, the data sharing between the group members via CSV (comma-separated values) files, by saving the simulation results and programming code as CSV files, and inputting the CSV data files to the HMI scenario to display the results.
E. Gate Allocation Analysis
In order to make a case study of Manchester Airport gate allocation, T2 has been selected for an analysis. As the most distant terminal from the runways, T2 has fourteen gates with air bridges, numbered from 202 to 215. It is now the quietest terminal but the airport tries to revive it by encouraging airlines to use it more often.
The real time operation data have been downloaded from the date 29th August 2011 to 4th September 2011 by the airport operator. The real time data have been transferred to HMI Flights information panel (Figure 7) as reference data. According to the one week real data, the analysis focuses on one of the busy summer day 29th August 2011. Re-organized the real data, filtered the same flight by the registration number, the results pointed out that there were 41 different flights arrival and departure at T2.
[image:6.612.75.543.450.646.2]The arrival time and departure time have been displayed by minutes, for convenient comparing purpose. T2 Arrivals & Departures 29th August 2011 timeline chart application (Figure 10) bases on the real time and model one day data to display the daily T2 gate states.
International Journal of Emerging Technology and Advanced Engineering
Website: www.ijetae.com (ISSN 2250-2459,ISO 9001:2008 Certified Journal, Volume 4, Issue 9, September 2014)
628
[image:7.612.49.288.232.386.2]In Figure 10, the X axis is time in minutes; the Y axis is the gate number of T2. In real time analysis, arrivals have been presented as the yellow points, and the departures have been presented as the blue points; in the model analysis, arrivals have been presented as the red points, and the departures have been presented as the green points. It is easy to identify that in the real time performance, gate 207 to 211 were quite busier than others.
Figure 11. Comparison of Real and Model Flight Number 29th August.
Figure 11 shows the comparison of fight number of two kinds of data in each gate. In the real time data, four gates were not used, two gates held 5 flights a day, four gates held 4 flights a day, and others had no more than 3 flights. However, in the model results, all the gates were used and no more than 3 flights a day.
The analysis shows the crowded area of T2, the problem could be solved by integrating ground and runway information. Meanwhile, the time lags between the arrivals and departures, and also between different flights scheduled in the same gate would possibly be relocated.
V. CONCLUSION
To sum up this paper, the Integrating and Automating Airport Operations group is using advanced modelling to integrate multiple airport operations. We used the interface to display and monitor key areas performance and do the decision making, which achieves gate relocated to minimize potential delay. Fuel consumption estimation is the next step in the interface to advise user for the energy saving.
REFERENCES
[1] Environment Plan, Part of the Manchester Airport Master Plan to 2030, 2007.
[2] Y. Chen, A rule-based reactive model for the simulation of aircraft on airport gates, Knowledge-Based Systems 10, 1998, pp. 225-236. [3] J. Chen, S. Ravizza, J. A.D. Atkin, and P. Stewart, On the Utilisation
of Fuzzy Rule-Based Systems for Taxi Time Estimations at Airports, 11th Workshop on Algorithmic Approaches for Transportation Modelling, Optimization, and Systems, Alberto Caprara & Spyros Kontogiannis, pp. 134-145.
[4] S. Ravizza, J. Chen, J. A.D. Atkin, E. k. Burke and P. Stewart, The trade-off between taxi time and fuel consumption in airport ground movement, Conference on Advanced Systems for Public Transport (CASOT12).
[5] Urszula M. Neuman, Jason A. D. Atkin Airport, "Gate Assignment Considering Ground Movement", in proceedings of th 4th International Conference, ICCL 2013, Copenhagen, Denmark, 2013. [6] Runway Data Sheet, Manchester Airport Community Information,
2011.
[7] P. Cunningham and A. Bonzano, Knowledge engineering issues in developing a case-based reasoning application, Knowledge-Based Systems 12, 1999, pp. 371–379.
[8] M. Brandena, N. Wiratungaa, D Burtonb and S. Crawa, Integrating case-based reasoning with an electronic patient record system, Artificial Intelligence in Medicine 51, 2011, pp. 117–123.
[9] A. Bonzano, P. Cunningham and C. Meckiff, ISAC: A CBR system
for decision support in air traffic control, advances in case-based reasoning, in: I. Smith, B. Faltings (Eds.), Proceedings of the 1996 European Workshop on Case-Based Reasoning, Springer Verlag Lecture Notes in Artificial Intelligence, 1996, pp. 44–57.