ISSN: 1992-8645 www.jatit.org E-ISSN: 1817-3195
SENTIMENT ANALYSIS SYSTEM AND CORRELATION
ANALYSIS ON HOSPITALITY IN BALI
I GEDE SUARDIKA
STMIK STIKOM Bali, Denpasar Indonesia
E-mail: [email protected]
ABSTRACT
Bali is one of the favorite tourist destinations for foreign visitors who are currently experiencing over-capacity accommodation facilities. One way to stabilize between positive and negative impacts is by improving tourism marketing which can be done by increasing the number of rating and review on online media. Review valence (positive or negative review) is one of the aspects that affect consideration to a hotel guest. Classification to review valance can be done with sentiment analysis. In this research, sentiment analysis to hotel review is conducted by Naïve Bayes Method. The dataset used is reviews of some hotel in some areas in Bali are selected based on its ranking on Tripadvisor. Review of several hotels in several areas in Bali are selected based on its ranking on Tripadvisor is used as dataset. A web-based system is built to perform sentiment analysis. Tests conducted to determine the level of classification accuracy. Correlation analyzes were conducted to determine whether there is a relationship between ratings with the classification results. Sentiment Analysis System can be built using the PHP programming language, MySQL database, and Naïve Bayes classifier algorithm with average accuracy level is 81%. Correlation analysis proved the hypothesis that the lower rating of the hotel on the TripAdvisor website, the greater percentage of negative sentiment. Results of tests of significance of the correlation coefficient indicates that the data and coefficients obtained in the sample used in this study can be generalized to the population.
Keywords: Sentiment Analysis System; Hotel Reviews; Correlation Analysis
1. INTRODUCTION
[image:1.612.310.528.451.580.2]Bali is one of the provinces in Indonesia which is favorite destination for foreign tourists. In 2014, 39.92% of the total foreign tourists visiting Indonesia are tourists who visited Bali. The number of tourist arrivals to Indonesia, and the percentage visiting Bali from years 2001-2014 shown by
Table 1: Number Of Foreign Tourist Arrivals
Year Number Of Foreign Tourist Arrivals
INDONESIA BALI %
2001 5,153,620 1,356,774 26.33
2002 5,033,400 1,285,844 25.55
2003 4,467,021 993,029 22.23
2004 5,321,165 1,458,309 27.41
2005 5,002,101 1,386,449 27.72
2006 4,871,351 1,260,317 25.87
2007 5,505,759 1,664,854 30.24
2008 6,234,497 1,968,892 31.58
Year Number Of Foreign Tourist Arrivals
INDONESIA BALI %
2009 6,323,730 2,229,945 35.26
2010 7,002,944 2,493,058 35.60
2011 7,649,731 2,756,579 36.03
2012 8,044,462 2,892,019 35.95
2013 8,802,129 3,278,598 37.25
2014 9,435,411 3,766,638 39.92
ISSN: 1992-8645 www.jatit.org E-ISSN: 1817-3195 Europe; and (4) land tax is too high and the
[image:2.612.89.300.398.735.2]consumptive culture of Bali [1]. Sutapa and Wisnawa mention that the best way to stabilize between positive and negative effects of over-capacity of accommodation in Bali: (1) increasing the marketing efforts of tourism in Bali; (2) MICE tourism boost; (3) halt the construction of accommodation facilities in the area of South Bali; and (4) standardize the price of the room [1].
Table 2: Number of Star Hotel Rooms in Bali
Year Hotel Star Count
5 4 3 2 1
(1) (2) (3) (4) (5) (6) (7)
2014 12 122 9 345 5 304 1 469 562 28 811
2013 11 177 7 463 4 045 1 385 790 24 860
2012 10 803 7 548 3 729 1 351 784 22 794
2011 10 469 6 887 3 215 1 340 883 21 133
2010 10 462 6 064 2 485 1 676 446 18 684
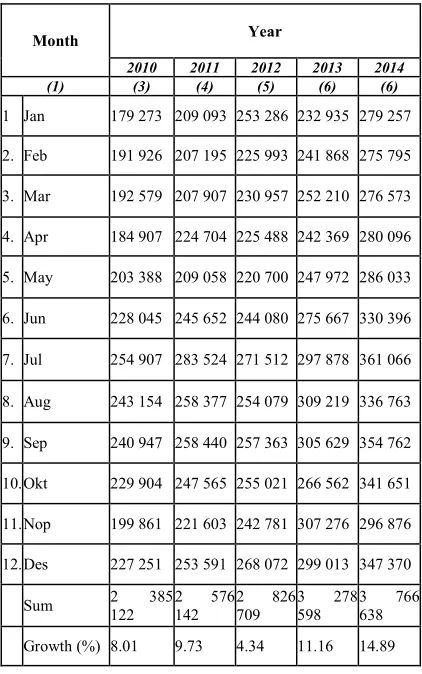
Table 3: Number of Foreign Tourists Visit To Bali
Month Year
2010 2011 2012 2013 2014
(1) (3) (4) (5) (6) (6)
1 Jan 179 273 209 093 253 286 232 935 279 257
2. Feb 191 926 207 195 225 993 241 868 275 795
3. Mar 192 579 207 907 230 957 252 210 276 573
4. Apr 184 907 224 704 225 488 242 369 280 096
5. May 203 388 209 058 220 700 247 972 286 033
6. Jun 228 045 245 652 244 080 275 667 330 396
7. Jul 254 907 283 524 271 512 297 878 361 066
8. Aug 243 154 258 377 254 079 309 219 336 763
9. Sep 240 947 258 440 257 363 305 629 354 762
10.Okt 229 904 247 565 255 021 266 562 341 651
11.Nop 199 861 221 603 242 781 307 276 296 876
12.Des 227 251 253 591 268 072 299 013 347 370
Sum 2 385
122
2 576
142
2 826
709
3 278
598
3 766
638
Growth (%) 8.01 9.73 4.34 11.16 14.89
To improve marketing, primarily to increase the hotel bookings, hence the hotel needs to increase the number of rating and review on online media Research conducted by Deependra Singh and Edwin Torres get the result that both the online ratings and total review give a positive impact on the average amount of each transaction [2]. In addition to providing a positive impact on transaction ordering, number of hotel reviews on online media can also improve the performance of the hotel. Pasi Tuominen in the study stated that there is a correlation between the performance of the hotel and a number of reviews given as well as the ratings of these reviews [3]. Consideration for hotel guests is influenced by several aspects of the review of the hotel. These aspects according to Ivar and Daphne are: (1) review valence (positive or negative reviews), (2) hotel familiarity (famous or less famous), and (3) reviewer expertise (expert or non-expert) [4].
To perform the classification of the review valence, can be done with sentiment analysis. Sentiment analysis is a process that aims to determine the contents of the dataset (documents, sentences, paragraphs, etc.) are positive, negative or neutral [5]. There is lot of sentiment classification algorithm proposed by the researchers, namely: Naïve Bayes (NB), Artificial Neural Network (ANN), and Support Vector Machine (SVM) [6].
Several studies have been conducted to find the right algorithm to perform sentiment analysis, but have not found the most appropriate
algorithm. The algorithm is most often
demonstrated high performance in analyzing the sentiment is NB, ANN and SVM. This study uses an NB algorithm to analyze the sentiment of the review of the hotel.
The purpose of this research are: (1) to build an Analysis Sentiment System with Naïve Bayes Classifier algorithm; (2) to find out the correlation between rating of hotel on Tripadvisor and percentage of negative sentiment; and (3) to find out if the sample used in this study can be generalized to the population where it is taken from.
2. RELATED WORK
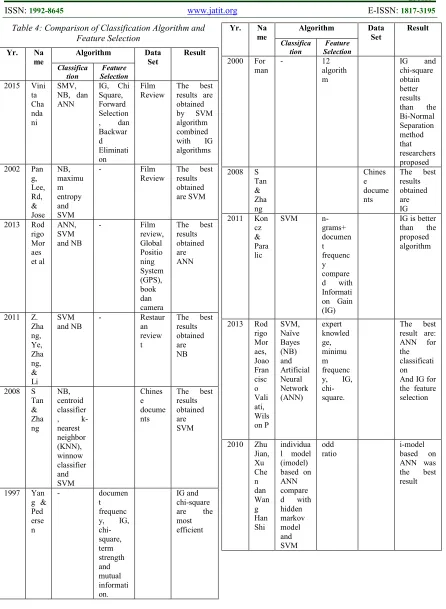
ISSN: 1992-8645 www.jatit.org E-ISSN: 1817-3195 Table 4: Comparison of Classification Algorithm and
Feature Selection
Yr. Na
me
Algorithm Data
Set Result Classifica tion Feature Selection
2015 Vini ta Cha nda ni
SMV, NB, dan ANN
IG, Chi Square, Forward Selection
, dan
Backwar d Eliminati on Film Review
The best results are obtained
by SVM
algorithm combined
with IG
algorithms
2002 Pan
g, Lee, Rd, & Jose NB, maximu m entropy and SVM
- Film
Review
The best results obtained are SVM
2013 Rod
rigo Mor aes et al ANN, SVM and NB
- Film
review, Global Positio ning System (GPS), book dan camera
The best results obtained are ANN
2011 Z. Zha ng, Ye, Zha ng, & Li SVM and NB
- Restaur
an review t
The best results obtained are NB
2008 S Tan & Zha ng NB, centroid classifier
,
k-nearest neighbor (KNN), winnow classifier and SVM Chines e docume nts
The best results obtained are SVM
1997 Yan
g & Ped erse n
- documen
t frequenc y, IG, chi-square, term strength and mutual informati on. IG and chi-square
are the
most efficient
Yr. Na
me
Algorithm Data
Set Result Classifica tion Feature Selection
2000 For
man
- 12
algorith m
IG and
chi-square obtain better results than the Bi-Normal Separation method that researchers proposed 2008 S
Tan & Zha ng Chines e docume nts
The best results obtained are IG
2011 Kon
cz & Para lic
SVM
n-grams+ documen t frequenc y compare d with Informati on Gain (IG)
IG is better than the proposed algorithm
2013 Rod
rigo Mor aes, Joao Fran cisc o Vali ati, Wils on P SVM, Naïve Bayes (NB) and Artificial Neural Network (ANN) expert knowled ge, minimu m frequenc y, IG, chi-square.
The best result are:
ANN for
the classificati on And IG for the feature selection
ISSN: 1992-8645 www.jatit.org E-ISSN: 1817-3195
Yr. Na
me
Algorithm Data
Set
Result
Classifica tion
Feature Selection
2008 Son
gbo Tan dan Jin Zha ng
centroid classifier
,
K-nearest neighbor, winnow classifier , NB and SVM
Mutual Informati on, IG, chi-square and Docume nt Frequenc y
The best result are:
SVM for
the classificati on And IG for the feature selection
Research conducted by Novantirani Anita, Mira Kania Sabariah, and Veronikha Effendy performs sentiment analysis of the twit dataset of overland public transportation using SVM algorithm. The results obtained are SVM can be implemented with an accuracy of 78.12%. Variables that influence the accuracy is the amount of data, comparison of the amount of training data and test, as well as the comparison of positive and negative amount of data used [8].
Research conducted by Tough Heru Susilo, Siti Rohimah performs classification and sentiment analysis on social media status. The results obtained are within the classification of topics in Indonesian, a collaboration between the method Support Vector Machine (SVM) with weighting feature Term Frequency - Inverse Document Frequency (TF-IDF), can be used with a 93% accuracy rate. While performing sentiment analysis in Bahasa, collaborative methods of Maximum Entropy (MAXENT) with the features of word-shape "dan2" and POS-tagged using Hidden Markov, can be used with a level of accuracy of 70% to document positive and 53% to document negative [9].
Research conducted by Amir Hamzah performs sentiment analysis to the text document containing suggestions and comments from AKPRIND IST students. The algorithm used to perform the classification of opinions is NBC with an average accuracy of 85.59% [10].
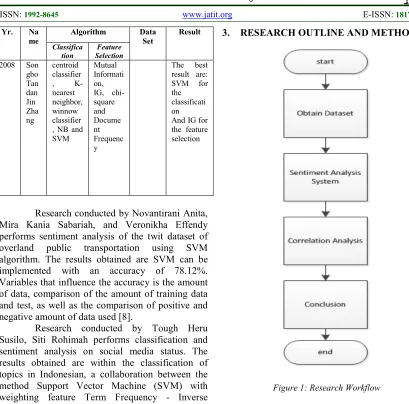
[image:4.612.91.500.67.471.2]3. RESEARCH OUTLINE AND METHOD
Figure 1: Research Workflow
3.1 Dataset
Dataset is hotel reviews which is obtained by scraping Tripadvisor website. Several area of hotel was selected for scraping, which is Jimbaran, Kuta, Nusa Dua and Seminyak. One hotel with high ranking and one hotel with low ranking is selected for each area. Tests will be conducted to determine whether there is a relationship between ratings with sentiment analysis results. The dataset is shown in the Table 5.
Table 5: Data Set
No Area
Rank-ing
Hotel Review
1 Jimbaran High
INTERCONTI-NENTAL Bali
Resort
130
2 Jimbaran Low The Rich Prada
Hotel Bali
25
3 Kuta High Discovery Kartika
Plaza Hotel
70
[image:4.612.306.530.624.739.2]ISSN: 1992-8645 www.jatit.org E-ISSN: 1817-3195 Indonesia
6 Nusa Dua Low Bali Relaxing
Resort Spa
24
7 Seminyak High W Retreat Spa
Bali Seminyak
20
8 Seminyak Low Bali Relaxing
Resort Spa
10
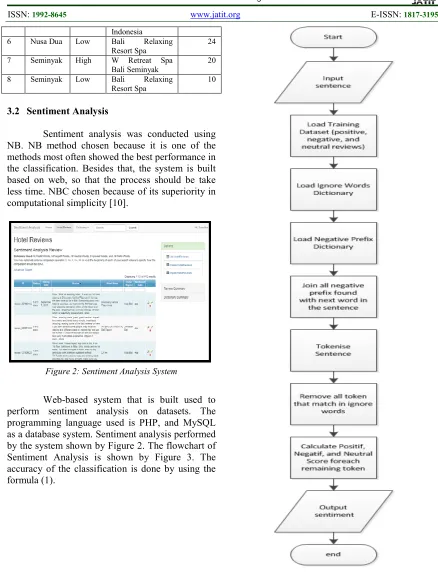
3.2 Sentiment Analysis
[image:5.612.83.521.67.651.2]Sentiment analysis was conducted using NB. NB method chosen because it is one of the methods most often showed the best performance in the classification. Besides that, the system is built based on web, so that the process should be take less time. NBC chosen because of its superiority in computational simplicity [10].
Figure 2: Sentiment Analysis System
Web-based system that is built used to perform sentiment analysis on datasets. The programming language used is PHP, and MySQL as a database system. Sentiment analysis performed by the system shown by Figure 2. The flowchart of Sentiment Analysis is shown by Figure 3. The accuracy of the classification is done by using the formula (1).
[image:5.612.92.295.289.427.2]ISSN: 1992-8645 www.jatit.org E-ISSN: 1817-3195
Accuracy = (1)
3.3 Correlation Analysis
To determine whether there is a
relationship between the rankings in Tripadvisor with sentiment analysis results performed by correlation analysis. Correlation analysis is a statistical method used to measure the linear relationship between two or more variables [11].
The formula used to calculate the correlation coefficients Modest is as formula (2): (This formula is also called the Pearson Product Moment).
r = (2)
n = The number of data pair X and Y
Σx = The total amount of the variable X
Σy = The total amount of variable Y
Σx2= Squares of Total Number of Variable X
Σy2= Squares of Total Number of Variable Y
Σxy= Multiplication results of the Total Number of variable X and variable Y
4. RESULT AND DISCUSSION
4.1 Sentiment Analysis
Data processing is performed based on data which is obtained from Tripadvisor hotel reviews. The dataset is then carried out by the sentiment analysis system built using Naïve Bayes classifier. The evaluation procedure presented by measuring the level of classification accuracy.
The data that has been processed is then used as a basis in the search for the relationship between hotel ranking (high or low) on the Tripadvisor site with the results of the classification (in positive sentiment, negative sentiment, or neutral sentiment).
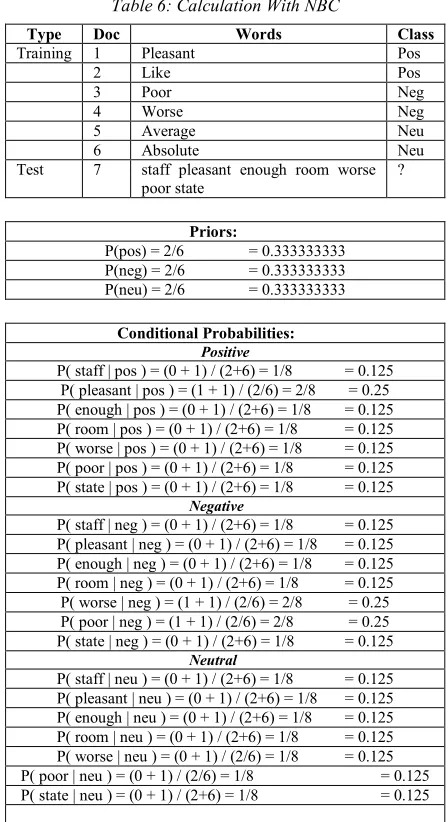
[image:6.612.87.532.43.712.2]Examples of hotel review that will be analyzed is: “staff pleasant enough room worse poor state”. The results of analysis performed by the system indicates that a review of the hotel is classified as negative sentiment, where scores of each type of sentiment is negative = 0.571, positive = 0.286, and neutral = 0.143 as shown by the Figure 4.
Figure 4: Calculation of Sentiment Analysis on the System
[image:6.612.305.529.295.706.2]If calculated by the method Naïve Bayes Classification, then the calculation is as follows:
Table 6: Calculation With NBC
Type Doc Words Class
Training 1 Pleasant Pos
2 Like Pos
3 Poor Neg
4 Worse Neg
5 Average Neu
6 Absolute Neu
Test 7 staff pleasant enough room worse poor state
?
Priors:
P(pos) = 2/6 = 0.333333333
P(neg) = 2/6 = 0.333333333
P(neu) = 2/6 = 0.333333333
Conditional Probabilities: Positive
P( staff | pos ) = (0 + 1) / (2+6) = 1/8 = 0.125 P( pleasant | pos ) = (1 + 1) / (2/6) = 2/8 = 0.25 P( enough | pos ) = (0 + 1) / (2+6) = 1/8 = 0.125 P( room | pos ) = (0 + 1) / (2+6) = 1/8 = 0.125 P( worse | pos ) = (0 + 1) / (2+6) = 1/8 = 0.125 P( poor | pos ) = (0 + 1) / (2+6) = 1/8 = 0.125 P( state | pos ) = (0 + 1) / (2+6) = 1/8 = 0.125
Negative
P( staff | neg ) = (0 + 1) / (2+6) = 1/8 = 0.125 P( pleasant | neg ) = (0 + 1) / (2+6) = 1/8 = 0.125 P( enough | neg ) = (0 + 1) / (2+6) = 1/8 = 0.125 P( room | neg ) = (0 + 1) / (2+6) = 1/8 = 0.125 P( worse | neg ) = (1 + 1) / (2/6) = 2/8 = 0.25 P( poor | neg ) = (1 + 1) / (2/6) = 2/8 = 0.25 P( state | neg ) = (0 + 1) / (2+6) = 1/8 = 0.125
Neutral
P( staff | neu ) = (0 + 1) / (2+6) = 1/8 = 0.125 P( pleasant | neu ) = (0 + 1) / (2+6) = 1/8 = 0.125 P( enough | neu ) = (0 + 1) / (2+6) = 1/8 = 0.125 P( room | neu ) = (0 + 1) / (2+6) = 1/8 = 0.125 P( worse | neu ) = (0 + 1) / (2/6) = 1/8 = 0.125
P( poor | neu ) = (0 + 1) / (2/6) = 1/8 = 0.125
P( state | neu ) = (0 + 1) / (2+6) = 1/8 = 0.125
ISSN: 1992-8645 www.jatit.org E-ISSN: 1817-3195 P( neg | d7) = 2/6 * (1/8) * 1/8 * 1/8 * 1/8 * 2/8 * 2/8 * 1/8 =
0.00000064
P( neu | d7) = 2/6 * (1/8) * 1/8 * 1/8 * 1/8 * 1/8 * 1/8 * 1/8 = 0.00000016
In percentages:
P( pos | d7) = 0.00000032 / (0.00000032 + 0.00000064 + 0.00000016) = 0.286
P( neg | d7) = 0.00000064 / (0.00000032 + 0.00000064 + 0.00000016) = 0.571
P( neu | d7) = 0.00000016 / (0.00000032 + 0.00000064 + 0.00000016) = 0.143
So, d7 belong to the class neg. Thus the hotel review "staff pleasant enough room worse poor state" is belonging to the negative sentiment.
4.2 Measurement accuracy level of sentiment
analysis
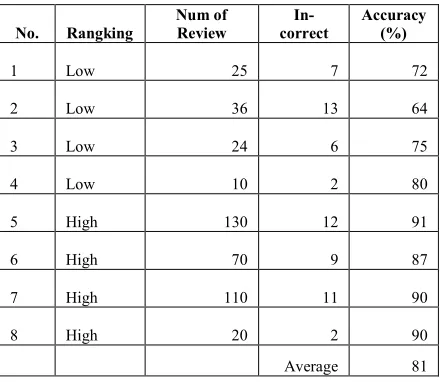
[image:7.612.85.305.407.598.2]A number of datasets are selected and counted the number of positive sentiment, negative sentiment, and neutral sentiment. The accuracy is calculated by the formula: Accuracy = correct amount / number of test data x 100%. The average level of accuracy sentiment analysis conducted by the method of Naïve Bayes classifier is at 81%.
Table 7: Classification Accuracy
No. Rangking
Num of Review
In-correct
Accuracy (%)
1 Low 25 7
72
2 Low 36 13
64
3 Low 24 6
75
4 Low 10 2
80
5 High 130 12
91
6 High 70 9
87
7 High 110 11
90
8 High 20 2
90
Average 81
4.3 Correlation Analysis Product Moment
N O
Rang king
Neg. Sent.(%)
X Y X2 Y2 XY
1 Low 12
2 12
4 144 24 2 Low
22
2 22
4 484 44 3 Low
30
2 30
4 900 60 4 Low
40
2 40
4 1600 80
N O
Rang king
Neg. Sent.(%)
X Y X2 Y2 XY
5 High 4
1 4
1 16 4 6 High
3
1 3
1 9 3 7 High
3
1 3
1 9 3 8 High 5 1
5
1 25 5
Sum 12 11
9
20 3187 223
rxy =
rxy =
rxy =
rxy = 0.836
So the correlation coefficient between the effect of the hotel rangking on Tripadvisor site with the results of the sentiment analysis (negative sentiment) is 0.836, meaning the two variables have a close relationship and shape of the relationship is linear positive, which means that the lower of the hotel rating on the TripAdvisor, the greater the percentage of negative sentiment.
The correlation coefficient when tested its significance, comparing with table r (r Product Moment), the error level of 5% (95% confidence level) and N = 8, then the value of r table = 0.707. R count value is greater than r table (0836> 0707), so that Ho refused and Ha accepted. So in conclusion, there is a positive relationship and the correlation coefficient between the ranking with sentiment analysis results is 0.836. Data and coefficient obtained in the sample can be generalized to the population which is taken from TripAdvisor.
ISSN: 1992-8645 www.jatit.org E-ISSN: 1817-3195
Figure 5: Scatter Plot Hotel Rangking vs Sentiment Analysis Result
5. CONCLUSION
The conclusions obtained from this study are:
1. Analysis Sentiment System can be built with Php programming language, Database MySQL, and Naïve Bayes Classifier algorithm where average accuracy is 81%.
2. The results of correlation analysis prove the hypothesis that the lower rating of the hotel on the TripAdvisor, the greater the percentage of negative sentiment.
3. The significance of the test results show that the correlation coefficient data and the coefficient obtained in the sample used in this study can be generalized to the population where it is taken from.
REFRENCES:
[1] I Ketut Sutapa and I Made Bayu Wisnawa,
"OVER CAPACITY PEMBANGUNAN
FASILITAS AKOMODASI DI BALI
DALAM PERSPEKTIF EKONOMI DAN BISNIS," Jurnal Perhotelan dan Pariwisata, vol. 3, no. 2, p. 69, 2013.
[2] Dipendra Sing and Edwin Torres, "Hotel Online Reviews and Their Impact on Booking Transaction Value," XVI Annual Conference Proceedings, January 2015.
[3] Pasi Tuominen, "The Influence of TripAdvisor Consumer-Generated Travel Reviews on Hotel Performance," University of Hertfordshire Business School Working Paper, 2011. [4] Ivar E. Vermeulen and Daphne Seegers, "Tried
and tested: The impact of online hotel reviews on consumer consideration," Tourism Management, vol. xxx, 2008.
[5] E. Kontopoulos, C. Berberidis, T. Dergiades,
and N. Bassiliades, "Ontology-based sentiment analysis of twitter posts," Expert Systems with Applications, 2013.
[6] P. Koncz and J. Paralic, "An approach to feature selection for sentiment analysis," IEEE International, 2011.
[7] Vinita Chandani, Romi Satria Wahono, and Purwanto, "Komparasi Algoritma Klasifikasi Machine Learning Dan Feature," Journal of Intelligent Systems, vol. 1, no. 1, February 2015.
[8] Anita Novantirani, Mira Kania Sabariah, and Veronikha Effendy, "Analisis Sentimen pada Twitter untuk Mengenai Penggunaan," Jurnal EPROC, Dec. 2014.
[9] Tegar Heru Susilo and Siti Rochimah, "Pengklasifikasian Topik dan Analisis Sentimen Dalam Media Sosial," SNASTI, 2013.
[10] A. Hamzah, "Meningkatkan Kinerja Naïve Bayes Classifier (NBC) Untuk Klasifikasi Teks dengan Menggunakan Clustering untuk Pemilihan Feature Kata," Prosiding Seminar Nasional TEKNOIN 2012, Universitas Islam Indonesia, November 2012.
[11] R.E. Walpole, Pengantar Statistika, 3rd ed. Jakarta: Gramedia, 1995.
[12] Amir Hamzah, "SENTIMENT ANALYSIS
UNTUK MEMANFAATKAN SARAN
KUESIONER DALAM EVALUASI
PEMBELAJARAN DENGAN
MENGGUNAKAN NAIVE BAYES